0873
Evaluation of task-induced δCMRO2 with a simultaneous acquisition of CBV, CBF and BOLD signals during normoxia and hypoxia conditions1Center for MRI Research, Peking University, Beijing, China, 2Peking-Tsinghua Center for Life Sciences, Peking University, Beijing, China, 3Beijing City Key Lab for Medical Physics and Engineering, Peking University, Beijing, China, 4MR Research China, GE Healthcare, Beijing, China
Synopsis
Existing studies have reported various results regarding CMRO2 behaviors during hypoxia. In this study, a simultaneous acquisition of CBV, CBF and BOLD signals was implemented to evaluate task-induced δCMRO2 under both normoxia and hypoxia conditions. Of 40 subjects who completed two runs of block-designed, black-and-white checkerboard visual tasks (normoxia and hypoxia) and a CO2 challenge, we found δCMRO2 increase significantly during hypoxia. We reckon that the simultaneous acquisition technique makes it possible for all necessary data to be acquired in one run of task, thus minimizing motion and physiological artifacts caused by separate data acquisitions through task repetitions.
Introduction
Cerebral metabolic rate of oxygen (CMRO2) is a crucial character used to evaluate the health stage of the brain, and it varies under different environmental oxygenation conditions. Previous studies on baseline CMRO2 have reported unchanged and increased values in rats(1) and humans(2), respectively, during mild hypoxia. Recently, Barreto et al.(3) first suggested a decrease in task-induced δCMRO2 during hypoxia, using a method which involves separately measuring cerebral blood volume (CBV), cerebral blood flow (CBF) and blood-oxygen-level-dependent (BOLD) signals in three repetitions of the same task. To further investigate on CMRO2 behaviors during hypoxia, in this study, we implemented a simultaneous CBV, CBF and BOLD acquisition method, which has the advantages of shortening acquisition time, minimizing motion and physiological artifacts, and ultimately generating more accurate results.Methods
40 subjects (20-30 years) were recruited for two runs of visual tasks (normoxia and hypoxia) and a CO2 challenge. The visual task was consisted of a 12s dummy period, followed by three 60s sessions alternating between resting and visual activation. The subjects gazed at a white crosshair on a black background during resting and a black-and-white checkerboard flickering at 8Hz during visual activation.
Medical air (21% O2, 79% N2) and hypoxia gas mixture (12% O2, 88% N2) were provided during normoxia and hypoxia, respectively. For the CO2 challenge, medical air was provided for the first 2 minutes, followed by hypercapnia gas mixture (5% CO2, 20% O2, 75%N2) for additional 3 minutes. Gas was delivered to subjects via a laboratory-built gas system; and sufficient time was made in-between runs for blood-oxygen-saturation level stabilization.
A pulse sequence which simultaneously acquires VASO, ASL and BOLD signals(4) was implemented on a 3.0T GE MR750 system. A single oblique slice passing through the primary visual cortex was imaged. Acquisition parameters were: FOV=260x260mm2, voxel size=4.0625x4.0625x6mm3, TE=9.4/11.6/28.1ms for VASO/ASL/BOLD images, inversion slab=100mm, TI1 for VASO images were individually determined using an inversion recovery pulse sequence (~701.7ms), TI2=1200ms for ASL images and TR=2000ms.
Data collected during dummy period, as well as the first 8s of every resting/activation session, were discarded to account for the hemodynamic response effect. VASO/CBF/BOLD data were obtained by adding/subtracting/adding the slab-selective and adjacent nonselective images acquired from the first/second/third echo of the pulse sequence. δCBV was calculated using Equation 1:
$$δCBV=-(\frac{C_{par}}{C_{blood}\cdot{CBV_{rest}}}-1)\cdot{δVASO}[1]$$
where Cpar=0.89 and Cblood=0.87ml water/ml substance represent water contents for parenchyma and blood, respectively, CBVrest=0.055ml blood/ml parenchyma(4).
Student’s t-test (t>3, P<0.005) was performed to compare resting and activation states. Region of interest was determined by selecting voxels that were activated for all functional signalsof both conditions.
The M value was calculated with the functional data obtained during the CO2 challenge using Equation 2:
$$M=\frac{δBOLD}{1-{(δCBV+1)(δCBF+1)^{-β}}}[2]$$
where β=1.5(4). Based on the measurements of δCBV, δCBF and δBOLD obtained during the visual tasks and the M value obtained via CO2 challenge, δCMRO2 can be calculated using Equation 3:
$$δCMRO_2=(1-\frac{δBOLD}{M})^\frac{1}{β}\cdot{(1+δCBV)^{-\frac{1}{β}}}\cdot{(1+δCBF)}-1[3]$$
Results
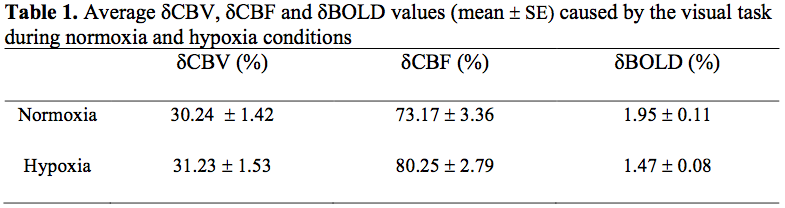
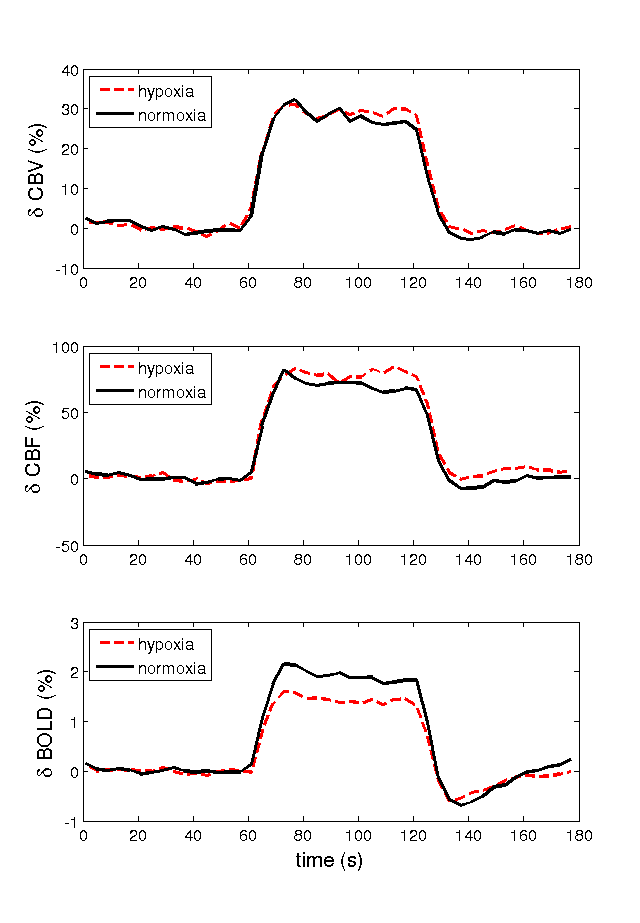
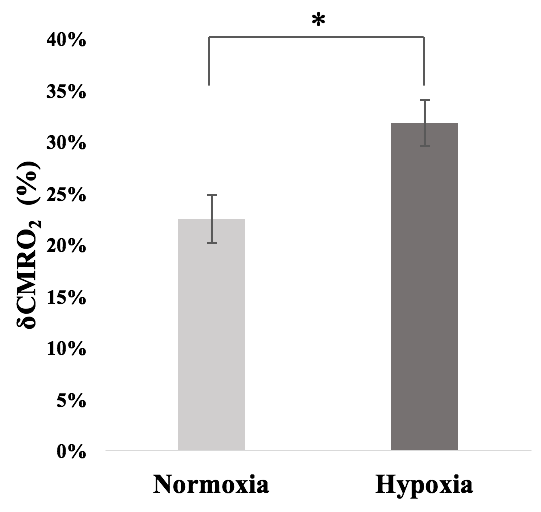
The measured δCBV, δCBF and δBOLD, averaged over all subjects, caused by the visual task during normoxia and hypoxia were listed in Table 1. Significant difference was observed between normoxia and hypoxia only for δBOLD, but not the other two signals. Figure 1 displays the average timecourses of the above signals. The average M value (mean ± SE) was 0.119 ± 0.016. δCMRO (mean ± SE) were 22.45% ± 0.023% and 31.83% ± 0.022% for normoxia and hypoxia, respectively. Figure 2 indicates a significant increase of the δCMRO2 during hypoxia compared to normoxia.Discussion and conclusion
Our measurements of the functional signals agree with results from previous studies(4,5), suggesting the applicability of the simultaneous acquisition technique. We found that δBOLD, but not δCBV or δCBF, decreases significantly during hypoxia, which is similar to the findings of Barreto et al.(3) Our M value falls in the expected physiological range(6). For hypoxia, we report an increase of task-evoked δCMRO2, suggesting that the brain manages the increased workload by generating more energy. This goes along with previous evidences demonstrating no lactate accumulation during visual stimulation(7) and promoted glycolysis and intracellular oxygen tension during hypoxia(8). The inconsistency with findings of Barreto et al.(3) may arise from means of data acquisition. The simultaneous acquisition of CBV, CBF and BOLD used in this study makes it possible for all data to be acquired in one run of task, thus minimizing motion and physiological artifacts caused by multiple data acquisitions via task repetitions. A broader range of experiments need to be conducted on different task stages and brain functional regions in order to further verify CMRO2 behaviors under hypoxia environment.Acknowledgements
No acknowledgement found.References
1. Sicard KM, Duong TQ. Effects of hypoxia, hyperoxia, and hypercapnia on baseline and stimulus-evoked BOLD, CBF, and CMRO2 in spontaneously breathing animals. NeuroImage 2005;25:850–858.
2. Xu F, Liu P, Pascual JM, Xiao G, Lu H. Effect of hypoxia and hyperoxia on cerebral blood flow, blood oxygenation, and oxidative metabolism. J Cereb Blood Flow Metab 2012;32:1909–1918.
3. Barreto FR, Mangia S, Garrido Salmon CE. Effects of reduced oxygen availability on the vascular response and oxygen consumption of the activated human visual cortex. J. Magn. Reson. Imaging 2016.
4. Lin A-L, Fox PT, Yang YEA, Lu H, Tan L-H, Gao J-H. Evaluation of MRI models in the measurement of CMRO 2and its relationship with CBF. Magn. Reson. Med. 2008;60:380–389.
5. Ho Y-CL, Vidyasagar R, Shen Y, Balanos GM, Golay X, Kauppinen RA. The BOLD response and vascular reactivity during visual stimulation in the presence of hypoxic hypoxia. NeuroImage 2008;41:179–188.
6. Chiarelli PA, Bulte DP, Piechnik S, Jezzard P. Sources of systematic bias in hypercapnia-calibrated functional MRI estimation of oxygen metabolism. NeuroImage 2007;34:35–43.
7. Tuunanen PI, Murray IJ, Parry N, Kauppinen RA. Heterogeneous oxygen extraction in the visual cortex during activation in mild hypoxic hypoxia revealed by quantitative functional magnetic resonance imaging. J Cereb Blood Flow Metab 2006;26:263–273.
8. Papandreou I, Cairns RA, Fontana L, Lim AL, Denko NC. HIF-1 mediates adaptation to hypoxia by actively downregulating mitochondrial oxygen consumption. Cell Metabolism 2006;3:187–197.
Figures