0870
Differentiating neural and non-neural fMRI signals using CBV-BOLD fMRI1SFIM, NIMH, Bethesda, MD, United States, 2FMRIF, NIMH, Bethesda, MD, United States, 3MBIC, Maastricht, Netherlands, 4MPI-CBS, Leipzig, Germany
Synopsis
fMRI is noisy and suffers from signal origin ambiguities. We propose a straightforward method that can classify the origin of neurally- and non-neurally-driven signal fluctuations by means of simultaneously acquired BOLD and CBV fMRI-data. For neurally-driven fMRI-signal fluctuations, BOLD and CBV are synchronized. For non-neurally-driven fluctuations, however, abnormal temporal correlations are seen. Upon identification of the non-neural components, they can be filtered out. This helps to remove artifacts and improve the specificity and interpretability of fMRI activation maps. Moreover, we show that it can remove venous signal components in ultra-high-resolution fMRI and improve the spatial specificity across cortical laminae.
Purpose
Functional MRI (fMRI) is noisy and suffers from signal origin ambiguity, especially in resting-state fMRI. Signal fluctuations are a combination of:
- neurally-induced changes of blood volume and oxygenation,
- neurally-independent changes of the vasculature e.g. due to respiration changes,
- M0/S0 changes e.g. due to head motion and scanner drifts
- thermal noise.
We seek to develop a simple classification method to identify different sources of signal fluctuations, which allows subsequent denoising of fMRI time-series. In order to do so, we use simultaneously acquired BOLD and CBV data and characterize fMRI signal fluctuation sources based on their CMRO2-dependent interactions, which are estimated by a µ-score. We developed a method that combines the high sensitivity of BOLD with the improved quantifiability and localization specificity of CBV-fMRI (following previous ASL-based approaches [Simon 2013]).
Methods
Based on established biophysical BOLD models (Davis-model [Davis 1998], Grubb-law [Grubb 197] etc.) a scale-factor µ of CBV and BOLD fluctuations is indicative of the CMRO2 contribution to signal fluctuations (see equations [1-6] in Fig. 1). VASO signal is a negative contrast and decreases for increased CBV [Lu 2003]. Hence, for neurally-driven signal fluctuations the inverse VASO signal fluctuations are proportional to BOLD signal changes (µ≈1). For non-neural vascular fluctuations, e.g. for respiration changes or voxels with large draining veins, the BOLD signal is substantially larger than the inverse VASO signal (Fig. 2) (µ≫1). When magnetization moves in and out of a voxel and when there are slow scanner drifts, BOLD and VASO signal fluctuations are positively synchronized and no longer anti-correlated (µ<0). For thermal noise, there is no correlation between BOLD and VASO (µ≈0). “Denoising” and removal of non-neural components follows the MEICA approach [Kundu 2012]: ICA components with non-neural µ-scores are removed.
A SS-SI-VASO sequence was used to obtain two sets of BOLD and CBV-weighted data:
- 1.5mm resolution with multi-echo TE=12/32/52ms.
- 0.78mm resolution with one TE = 32ms.
Other sequence parameters were: 24 slices, TR/TI = 3.4/1.1s, 7T (Siemens-Healthineers). To validate the method with tasks of known neurally-driven and non-neural vasculature-driven fluctuations, we used: finger-tapping, visual flickering checkerboard, 5% CO2-hypercapnia (12-15 min each).
Results
The validity of µ-scores to identify neural and non-neurally-driven vascular fluctuations is confirmed in validation experiments, where the underlying neural and non-neural origin of the fMRI signal changes is known (Fig. 2). Visual flickering-checkerboard-induced fMRI signal changes and finger-tapping-induced activation is known to have a neural origin (µ≈1). Hypercapnia-induced fMRI signal changes are known to have a non-neural vascular origin (µ≫1). Fig. 3 depicts a representative spectrum of the corresponding µ-scores in resting-state fMRI:
- µ-scores around 1 represent neurally-driven activity with corresponding CMRO2 changes.
- µ-scores bigger than 1 are dominated by non-neural vascular changes.
- µ-scores smaller than 1 are associated with non-vascular magnetization changes, e.g. head motion, signal spikes etc.
The majority of ICA networks have neural origin in all 6 participants. Fig. 4 depicts resting-state ICA components and their respective time-courses and µ-scores. It can be seen that non-neural vascular components can be clearly differentiated from neural components by means of their larger µ-scores. For signal denoising purposes, these time-courses can be filtered out.
Fig. 5 depicts that regression of non-neuronal components in task-based fMRI, can help to remove the bias of large draining veins and improve the localization specify of GE-BOLD fMRI. Laminar responses become better visible.
Discussion
The acquisition of interleaved VASO images reduces the TR efficiency by approximately 30%-50% compared to conventional BOLD. Non-neural components can only be filtered out, if they have different spatiotemporal signatures and are manifested as separate ICA components.
Since the µ-score procedure is applied in the networks space (ICA components), multiple voxels contribute to every single µ-score. This means that the proposed approach does not suffer from the high noise level of the VASO contrast in individual voxels. Hence, it can be applied in ultra-high resolution studies. It is notable that upon removal of non-neural components, the BOLD fMRI maps are less biased by large draining veins, which results in a better GM specificity, revealing layer-signatures (arrows in Fig. 5B).
Conclusion
We introduced a method that can differentiate neurally-driven from non-neurally-driven fMRI signal fluctuations across resting-state networks and across voxels in task-fMRI based on the relationship between their VASO and BOLD fluctuations. As such, the proposed method provides significant gains in specificity of activation maps. The proposed method marries the high sensitivity of BOLD and the high localization specificity of CBV signal into one resulting activation map with both quality features. In particular, we demonstrate empirically how this method can reliably remove unwanted ‘artefactual’ signal-components of draining veins.Acknowledgements
This research is supported by the NIMH Intramural Research Program. We thank Benedikt Poser for the 3D-EPI readout and his help to include it in to the VASO sequence environment that was used in subsets of the second protocol set. We thank Steffen von Smuda for his help in implementing the multi-echo sequence that was used in the first protocol set. We thank Leonie Lampe for medical supervision during CO2 inhalation experiments. Maria Guidi was supported by Initial Training Network, HiMR, funded by the FP7 Marie Curie Actions of the European Commission (FP7-PEOPLE-2012-ITN-316716). Review board-approved protocol (93-M-170, ClinicalTrials.gov identifier: NCT00001360).References
[Buxton 2010] Buxton et al., Front. NeuroEnerg., 2010, 2:article8. Interpreting oxygenation-based neuroimaging signals: The importance and the challenge of understanding brain oxygen metabolism
[Chen 2009] Chen et al., NMR Biomed, 2009, 22:1054-1062. BOLD-specific cerebral blood volume and blood flow changes during neuronal activation in humans
[Davis 1998] Davis et al., PNAS, 1998, 95:1834-1839. Calibrated functional MRI: Mapping the dynamics of oxidative metabolism
[Grubb 1974] Grubb et al., Stroke, 1974, 165:630-639. The effects of changes in PaCO2 on cerebral blood volume, blood flow, and vascular mean transit time
[Huber 2017] Huber et al., 2017, Neuron, accepted: in print, pii S0896-6273(17)31033-4, High-resolution CBV-fMRI allows mapping of laminar activity and connectivity of cortical input and output in human M1.
[Kundu 2012] Kundu et al., NeuroImage, 2012, 60:1759-1770. Differentiating BOLD and non-BOLD signals in fMRI time series using multi-echo EPI.
[Lu 2003] Lu et al., MRM, 2003, 50:263-274. Functional magnetic resonance imaging based on changes in vascular space occupancy.
[Marrett 1997] Marrett et al., Adv. Exp. Med Biol, 1997, 413:205-208. Changes of blood flow and oxygen consumption in visual cortex of living humans
[Simon 2013] Simon et al., PLoS ONE, 2013, 8:e54816. A Novel Method of Combining Blood Oxygenation and Blood Flow Sensitive Magnetic Resonance Imaging Techniques to Measure the Cerebral Blood Flow and Oxygen Metabolism Responses to an Unknown Neural Stimulus
Figures
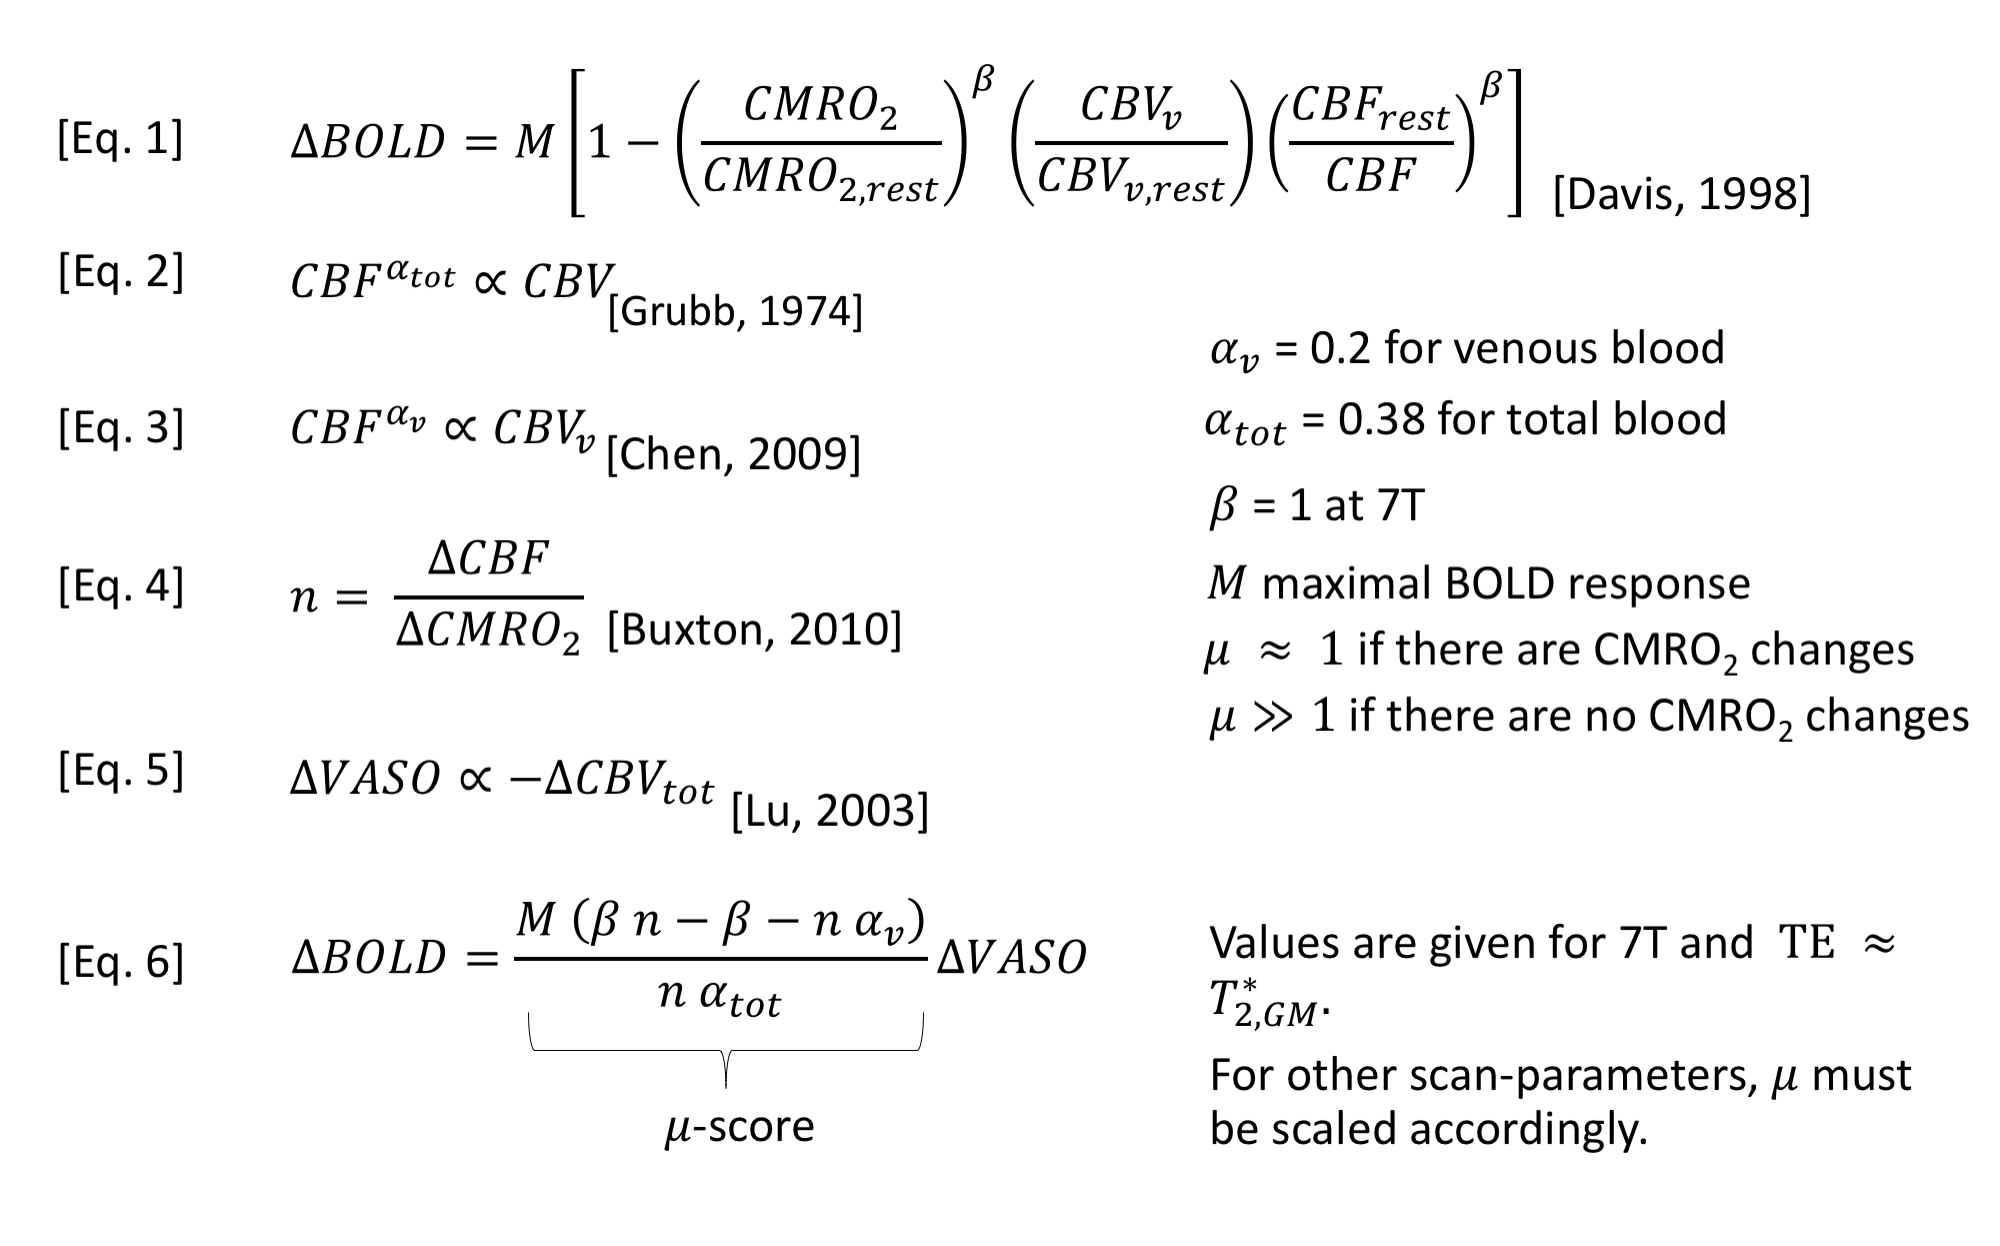
Fig. 1: Biophysical models of BOLD fMRI.
To a first order approximation, BOLD and VASO fluctuations can be considered proportional to each other. The proportionality-factor µ is dependent on the physiological origin of the fMRI signal changes. When vascular dilation is accompanied with CMRO2 increases [Marrett 1997], the CMRO2-dependent increase in deoxyhemoglobin attenuates the BOLD signal, without affecting CBV (µ≈1). When vascular responses are not accompanied with CMRO2 changes, the BOLD signal is not attenuated and relatively stronger compared to CBV (µ≫1). In this study, µ is used as a score to determine the neural origin of fMRI signal changes.
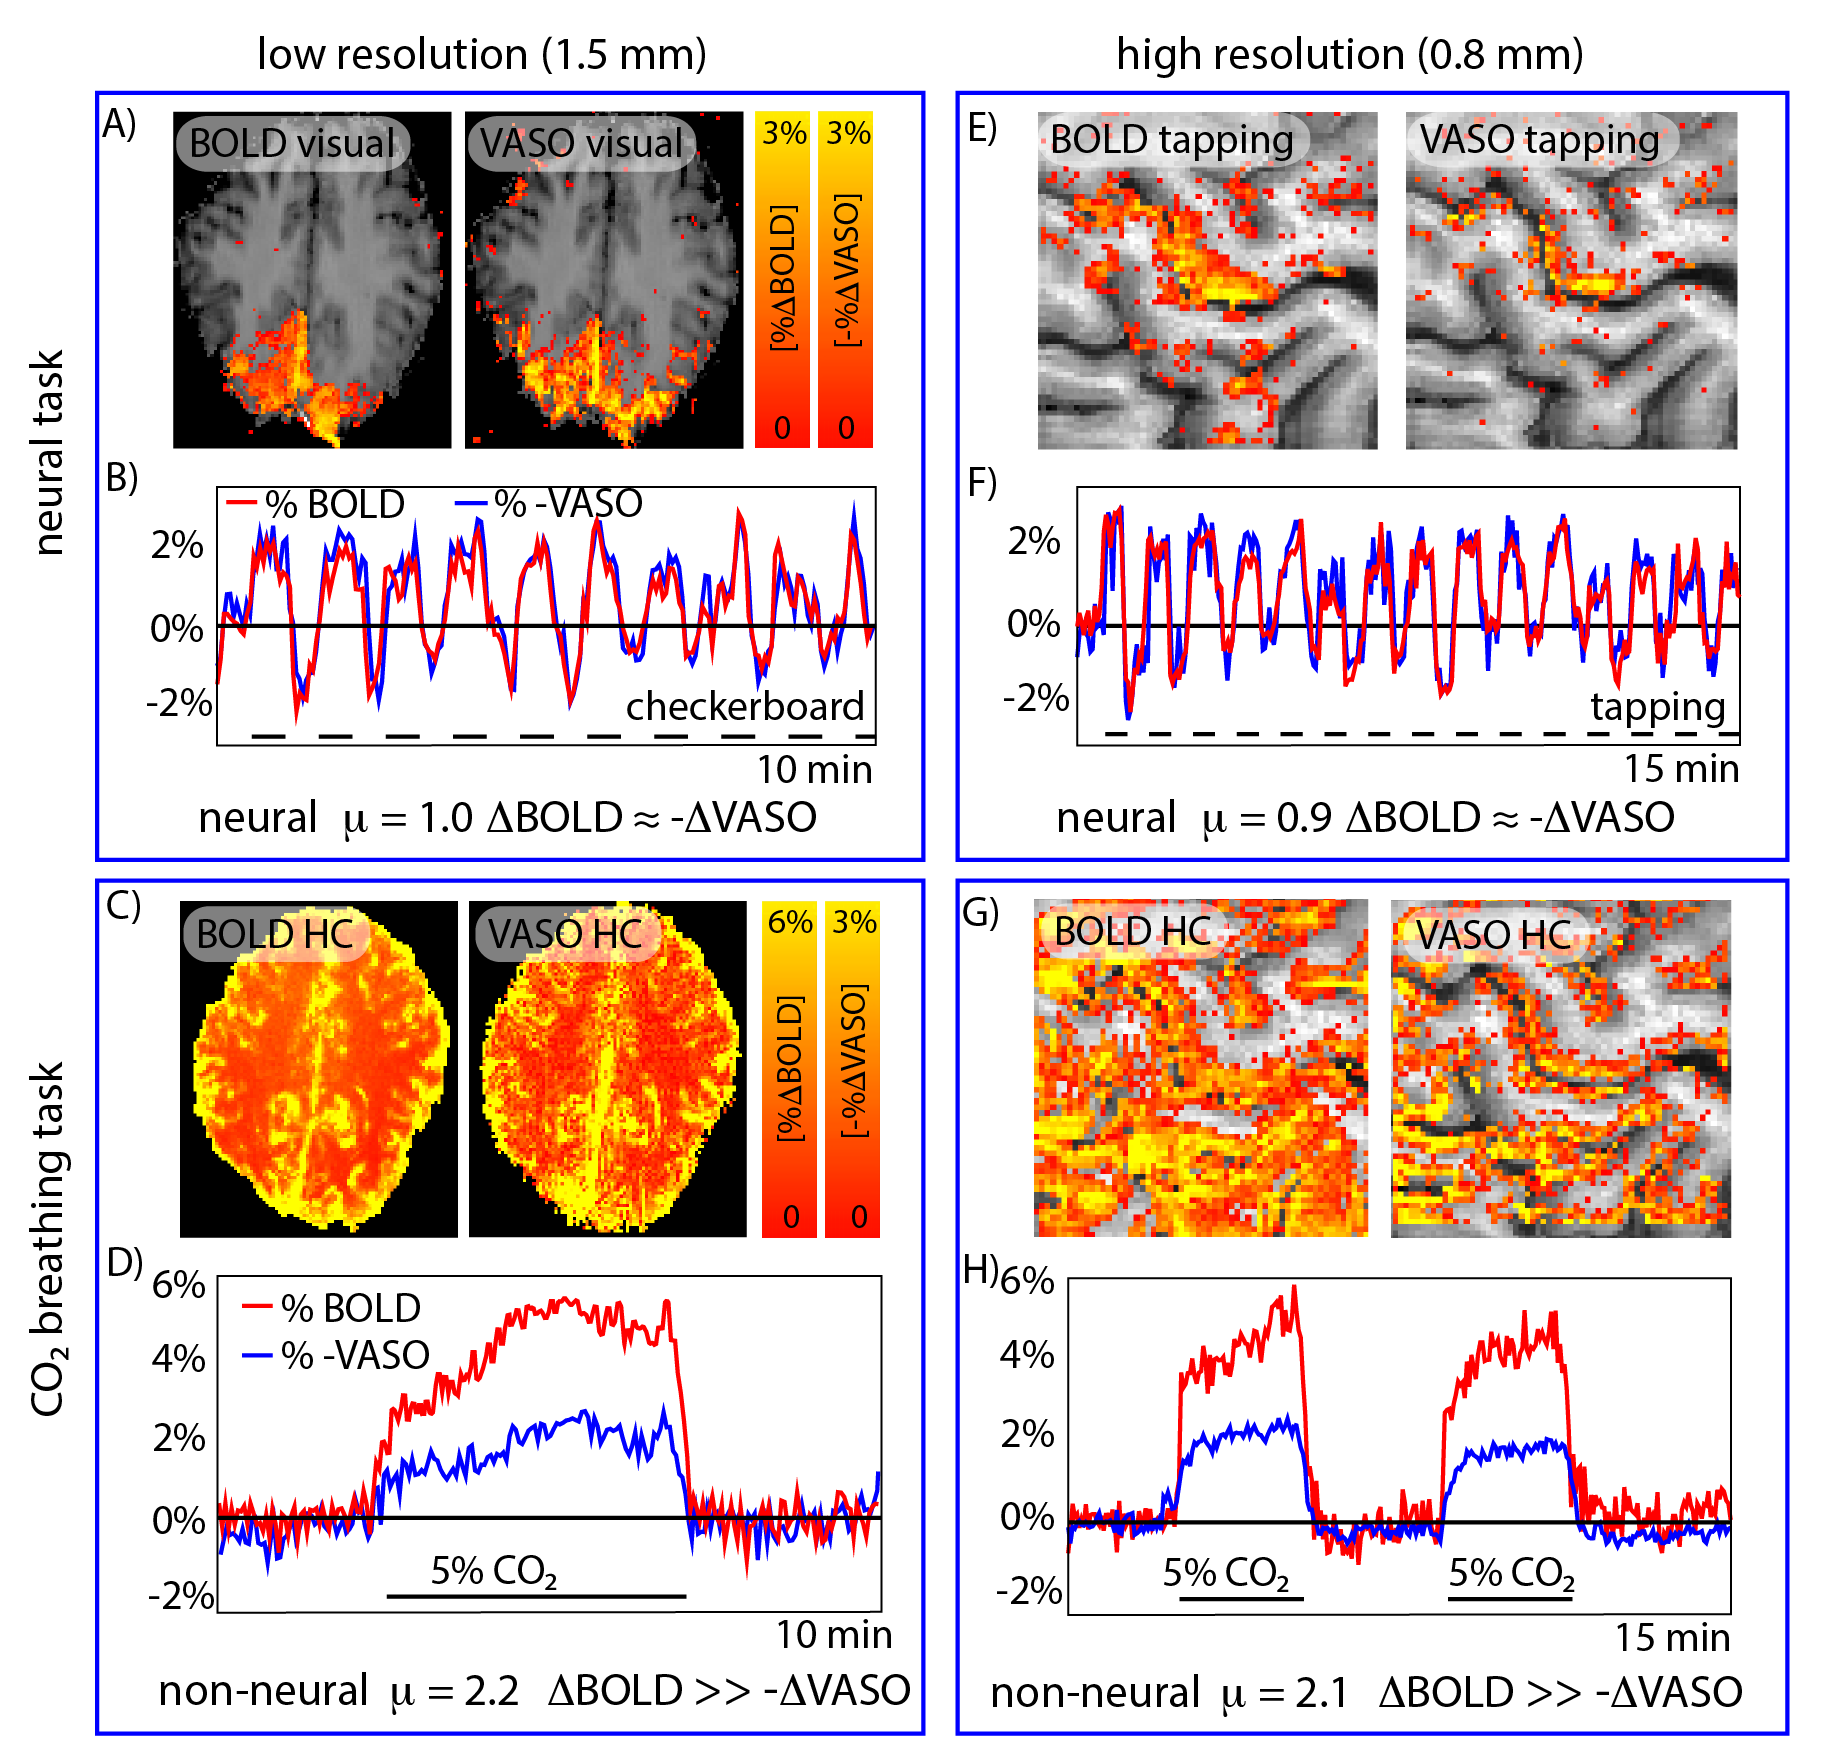
Fig. 2: Validation of the use of µ-scores for identifying the neural fMRI signal origin.
Validation experiments with known neural and non-neural fMRI signal fluctuations origin are used to confirm the cogency of µ-scores. For finger-tapping and flickering-checkerboard-induced fMRI signal changes, BOLD and inverse VASO signal fluctuations are synchronized (µ≈1), as expected. For breathing manipulations (hypercapnia), the BOLD signal changes are substantially larger compared to inverse VASO signal fluctuations (µ≫1), as expected.
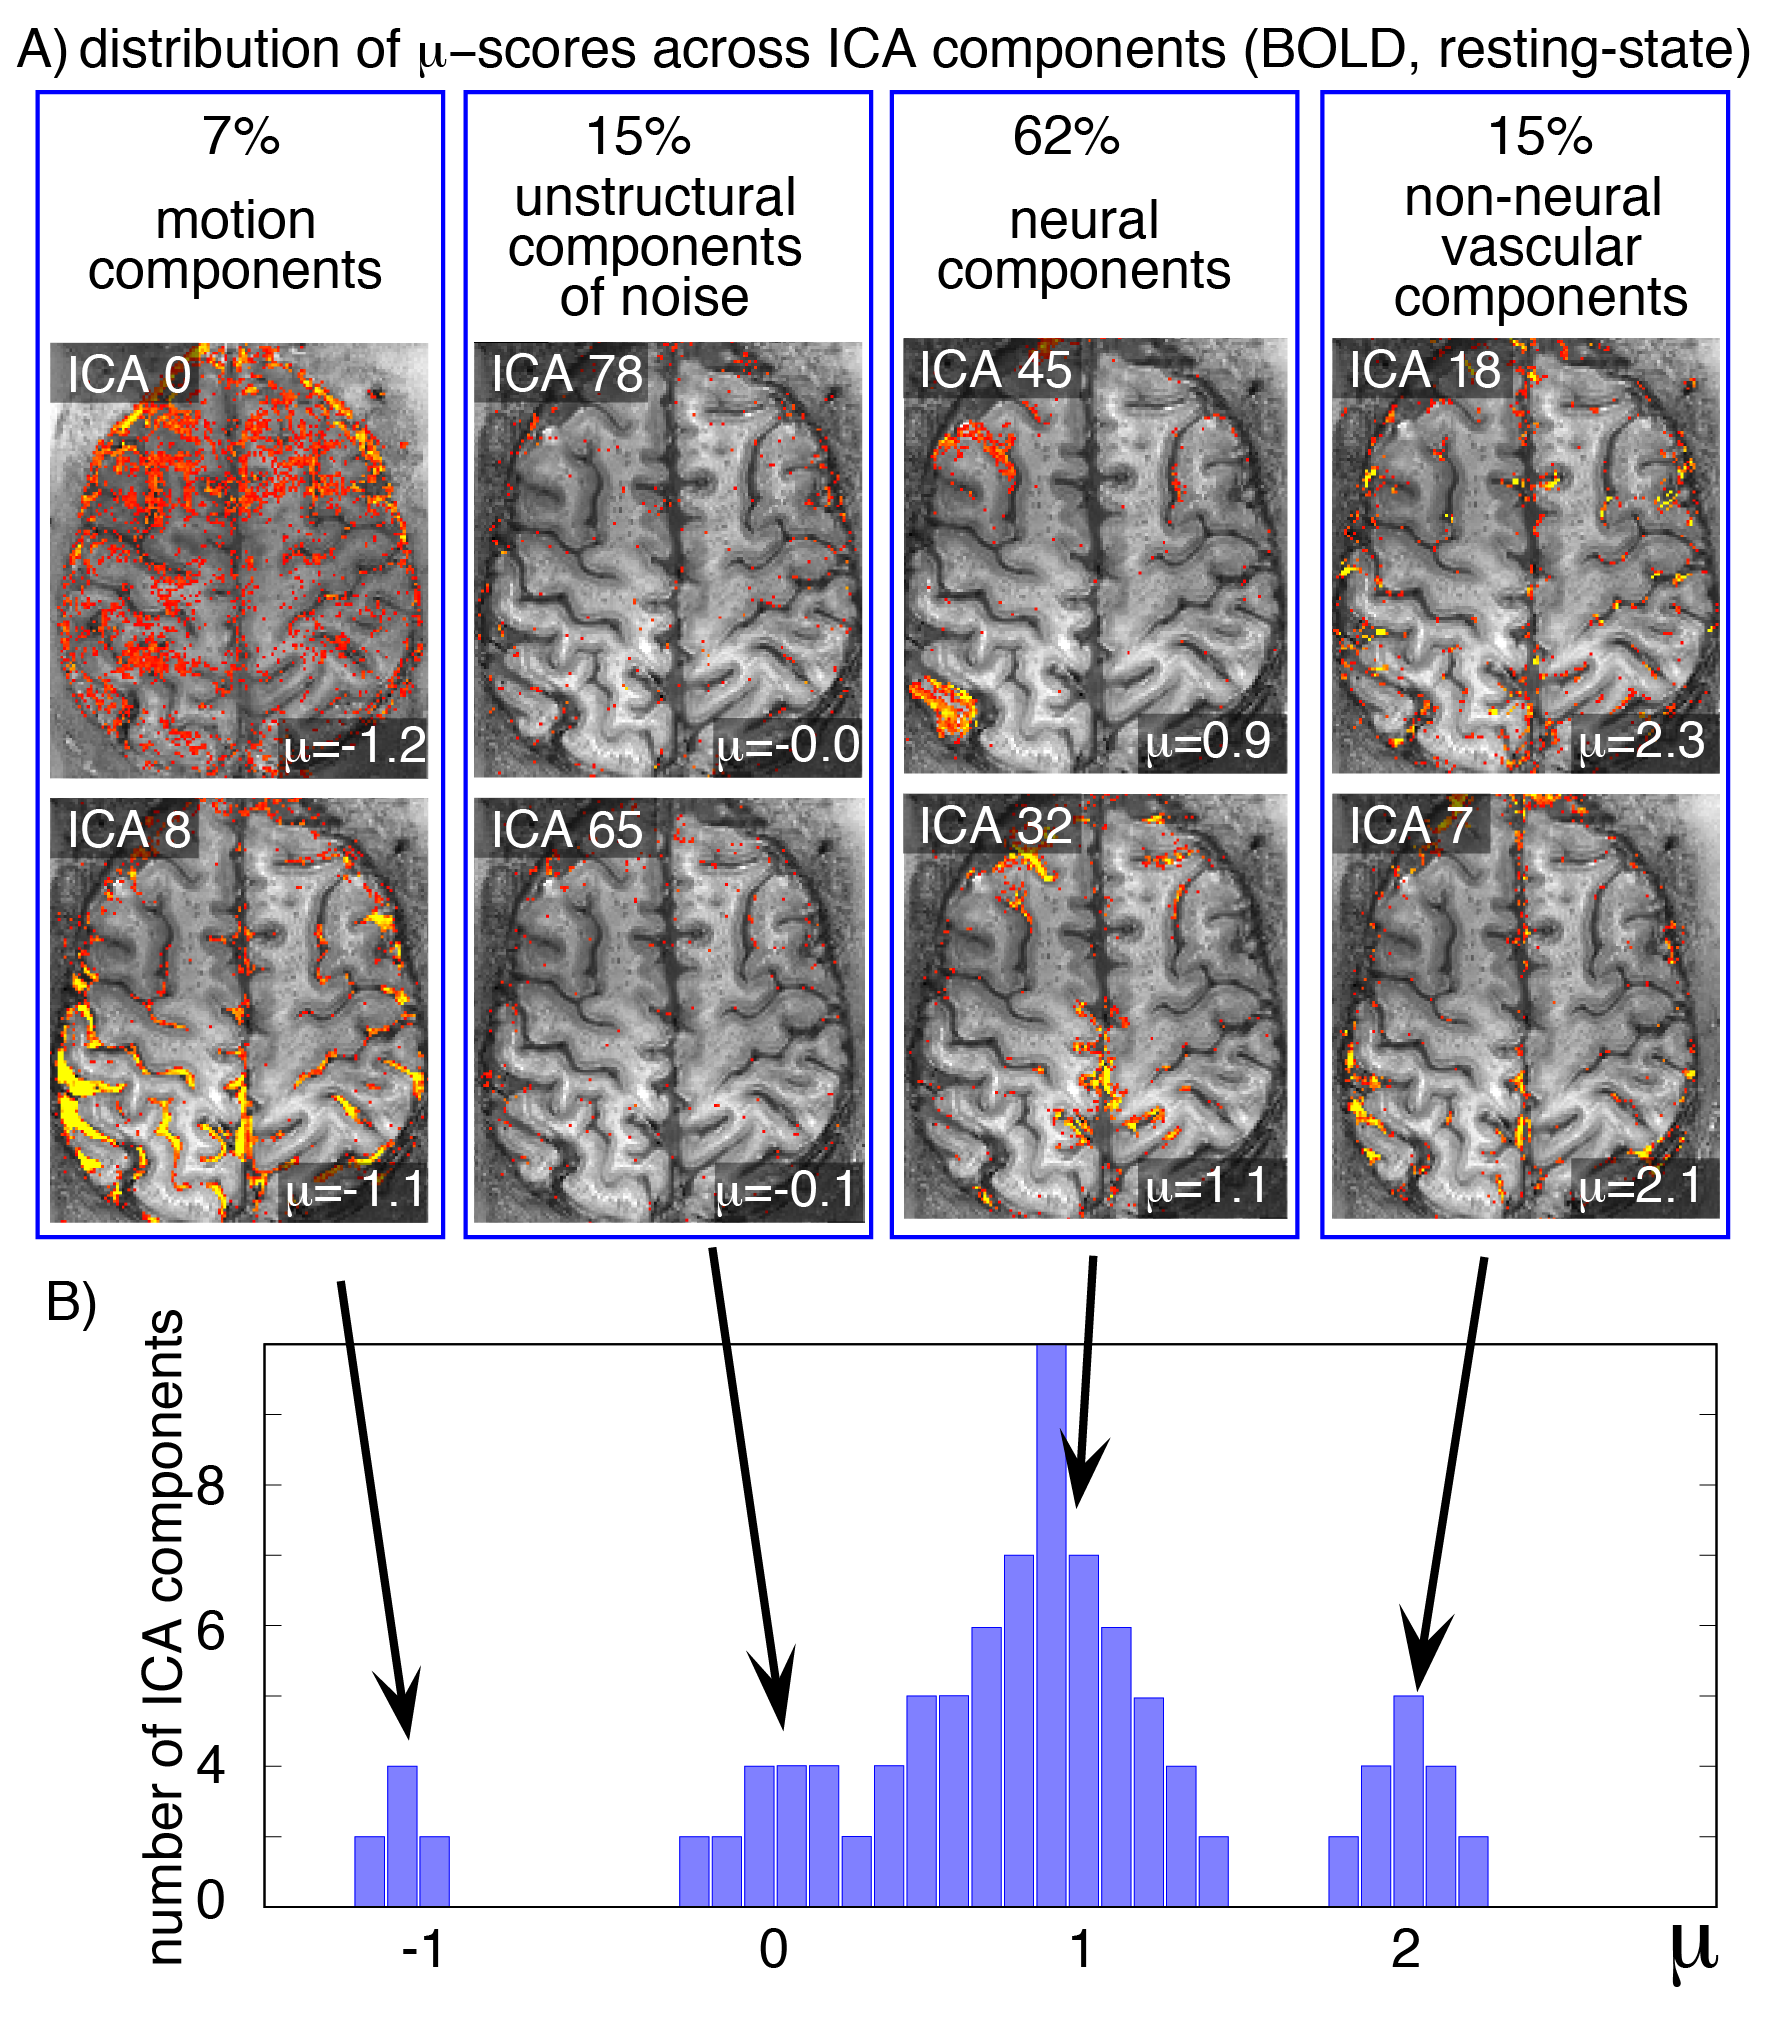
Fig. 3: Representative distribution of µ-scores in resting-state BOLD fMRI.
Usually, ICA components fall into one of four categories:
- Motion and signal drifts (µ<0),
- spatially unstructured components with thermal noise characteristics (µ≈0),
- desired neurally-driven components with corresponding CMRO2 changes (µ≈1),
- and non-neural vascular components without corresponding CMRO2 changes (µ≫1).
In all 6 participants of this study, the class of neurally-driven fluctuations contained the majority of components.
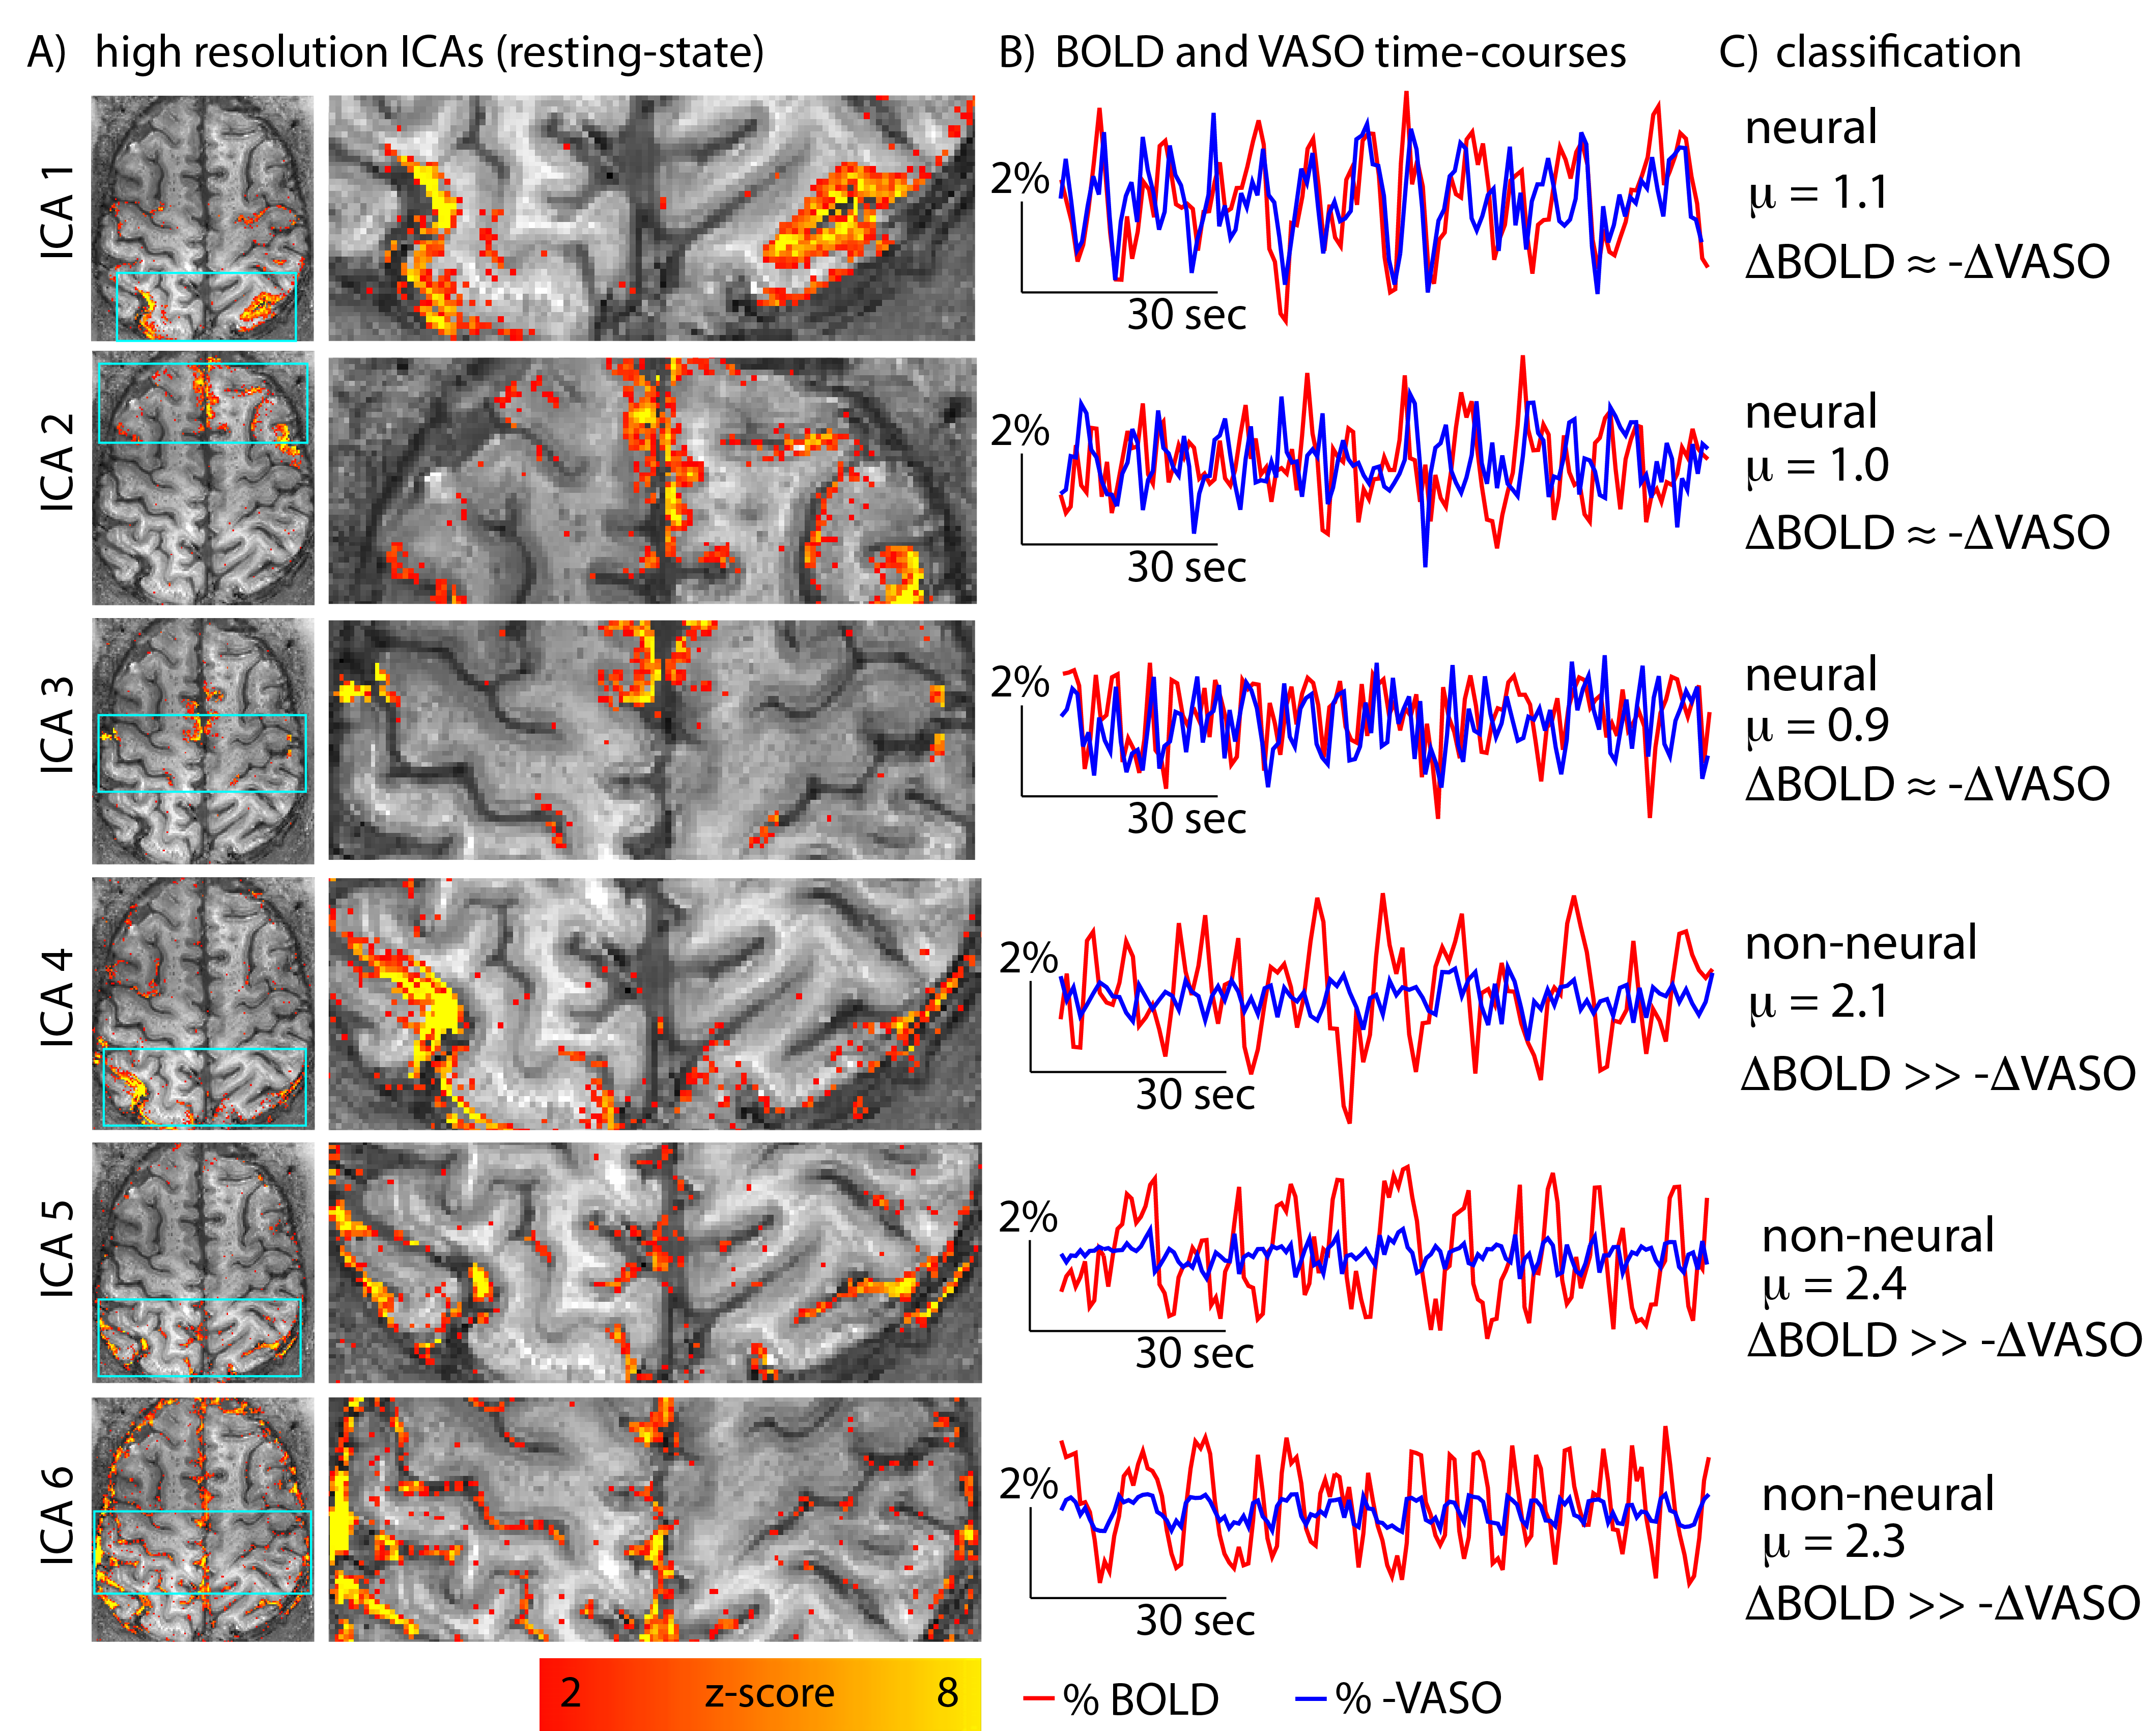
Fig 4: Example of resting-state ICA components and their time-courses.
ICA components 1-3 have very similar BOLD and VASO resting-state time-courses (µ≈1). Hence, they are classified as neural components. ICA components 4-6 have significantly larger BOLD signal amplitudes comparted to VASO (µ≫1). Hence, they are classified as non-neural, vascular components.
Note that the spatial patterns of those non-neural components are not always clearly distinguishable from the neural components. They might also be symmetric across hemispheres and are dominated from low frequency fluctuations (e.g. ICA 4,5). Only the time-course comparison of BOLD and VASO, allows a clear classification.
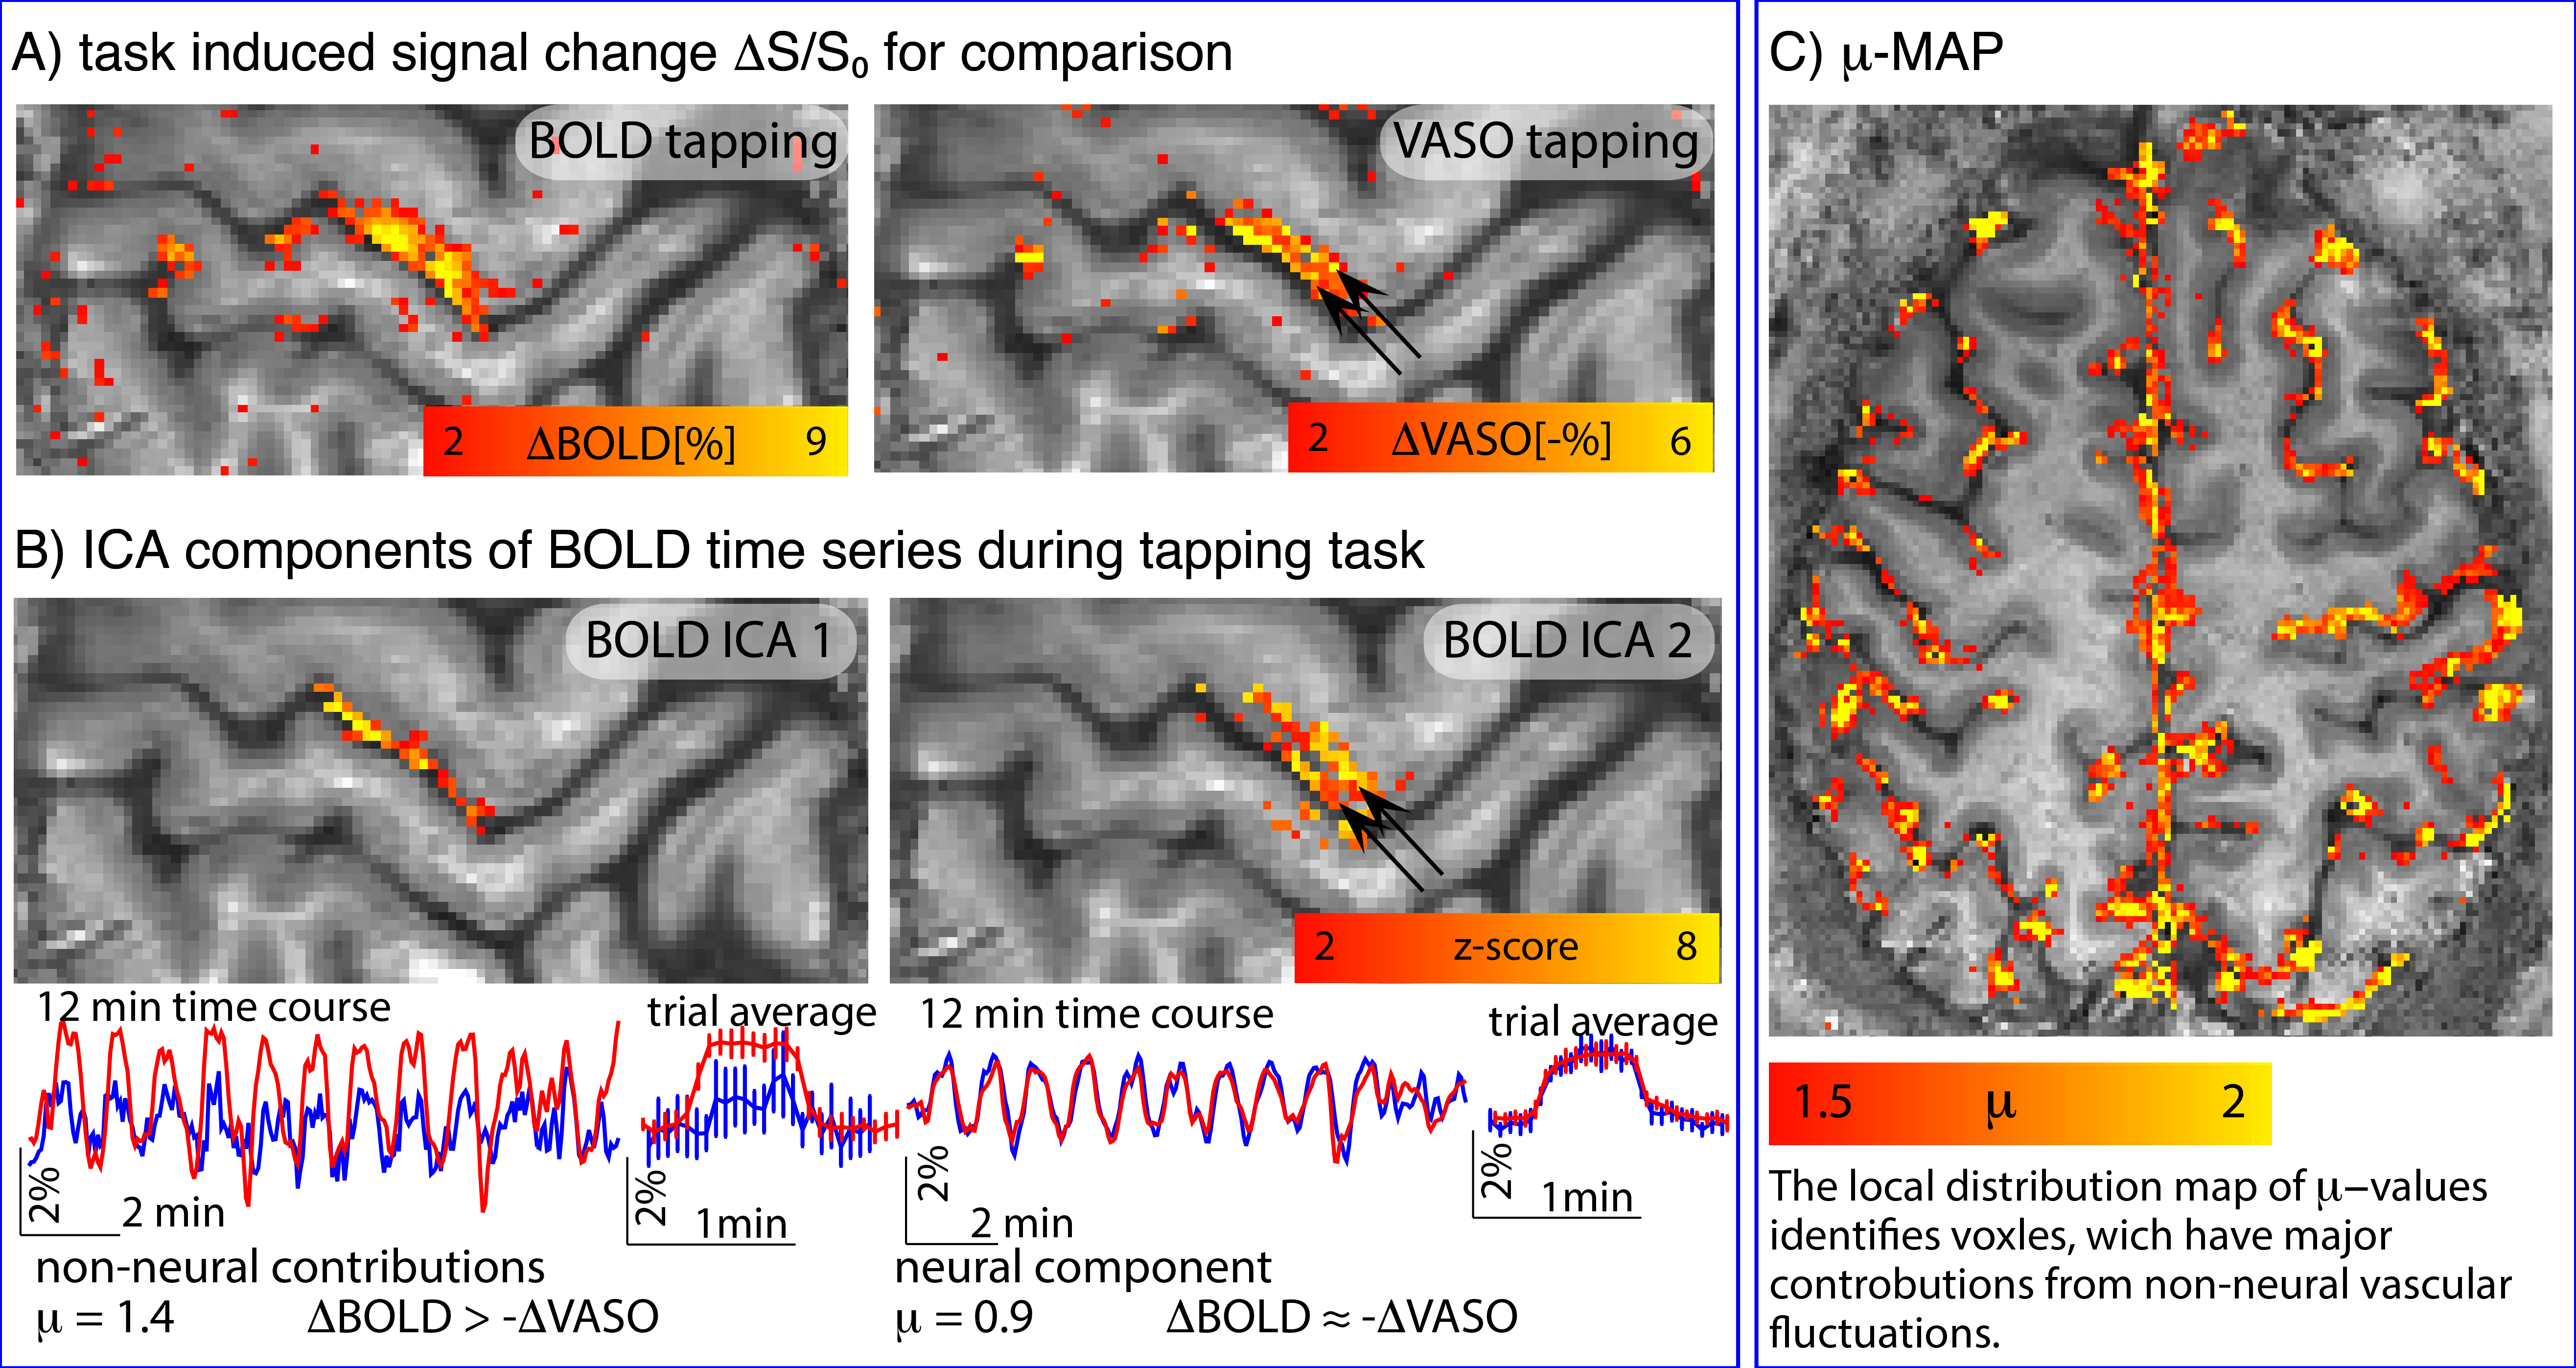
Fig. 5: Removal of non-neural components improves localization specificity.
A) depicts conventional block-design task-responses for 12-min finger-tapping at 0.75mm resolution. CBV results appear more specific to layers, but are noisier than BOLD.
B) depicts two ICA components of the BOLD data. Due to the slightly delayed response of large veins (ICA 1), they can be separated from the more microvascular BOLD components (ICA 2). The µ-score suggests that the ICA 1 component in superficial layers is less neurally-driven than the component of deeper layers. Voxel-wise calculation of the µ-score identifies voxels, which are dominated from non-neural vascular fluctuations.