0869
Determination of white matter cerebrovascular reactivity (CVR) and CVR compliance time responses to surgical revascularization using time regression analysis of hypercapnic BOLD fMRI data1Dept. of Radiology & Radiological Sciences, Vanderbilt University Medical Center, Nashville, TN, United States, 2Quantitative and Physical Biology Program, Vanderbilt University Medical Center, Nashville, TN, United States, 3Vanderbilt University School of Medicine, Vanderbilt University Medical Center, Nashville, TN, United States, 4Dept. of Neurology, Division of Pediatric Neurology, Vanderbilt University Medical Center, Nashville, TN, United States, 5Dept. of Neurological Surgery, Vanderbilt University Medical Center, Nashville, TN, United States
Synopsis
We applied a novel time-regression analysis to hypercapnic BOLD imaging data in a cohort of moyamoya patients with progressive steno-occlusion of the intracranial arteries before and after surgical revascularization with the overall goal of elucidating gray and white matter differences in cerebrovascular reactivity (CVR)-weighted responses and vascular compliance time measures. We observed differences between gray and white matter reactivity time delays, as well as depth-dependent differences in reactivity and time delays within the white matter. Additionally, we observed that the improvement in both white and gray matter hemodynamics following surgical revascularization was closely related to pre-surgical CVR-weighted metrics.
Introduction
The overall goal of this work is to utilize a BOLD hypercapnic protocol in conjunction with time-regression analyses to quantify cerebrovascular reactivity (CVR)-weighted changes in deep white matter (WM) following surgical revascularization in patients with arterial steno-occlusive disease. CVR, or the ability of parenchyma to increase blood flow in response to a stimulus, is increasingly used to evaluate vascular health1. Literature focuses on gray matter (GM) parenchymal CVR, due to relatively low blood volume (1.6-2.5 ml blood / 100 ml brain) and long bolus arrival times (1.5-2.5s) in WM2, which leads to low contrast-to-noise ratio in white matter parenchyma, complicating interpretation with conventional noninvasive MRI methods. The few studies that have investigated WM reactivity reported decreased magnitude and increased time to peak reactivity relative to GM in healthy adults3-5, and decreased magnitude in patients with arterial steno-occlusive disease6. However, these effects have not been evaluated in the context of treatments or longitudinally for reproducibility; our hypothesis was that CVR and CVR response times (e.g., CVRLAGTIME7 ) improve in both deep WM structures and cortex in response to surgical revascularization.Methods
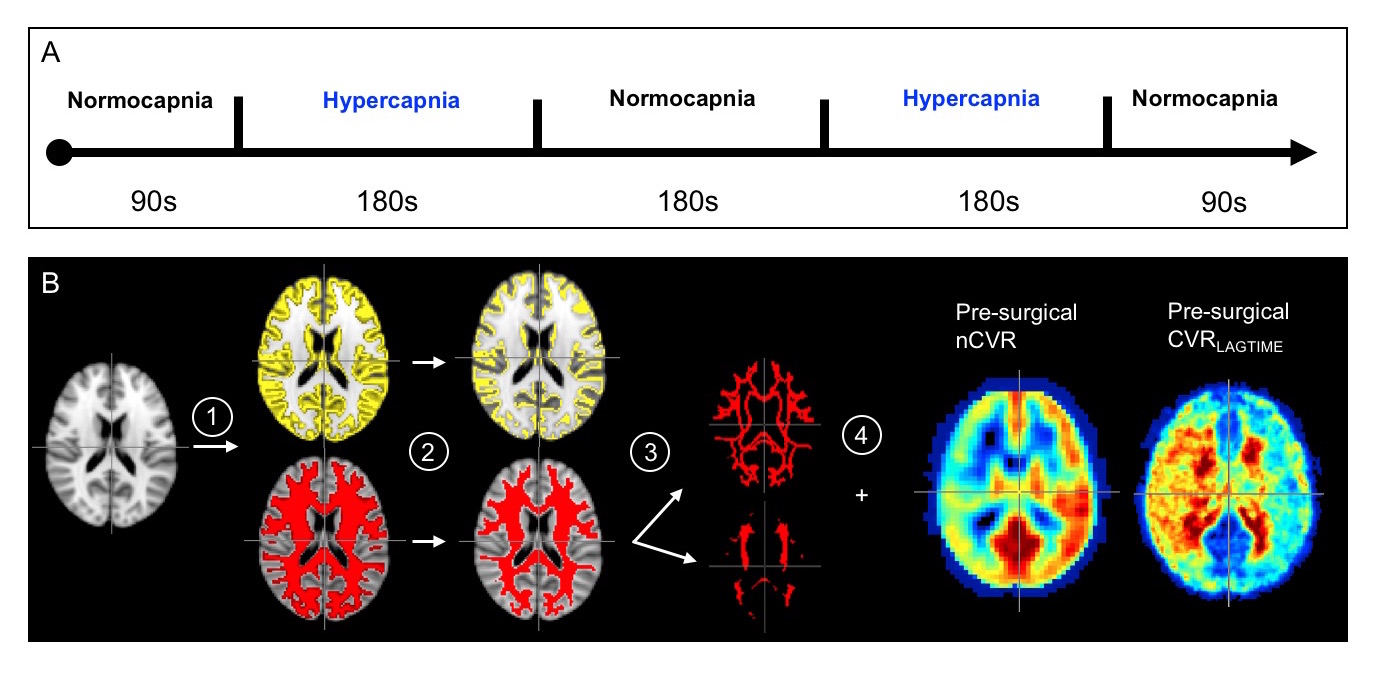
Moyamoya patients (n=20; sex=17/3 F/M; age=41.7±12.8 years) provided informed consent and were scanned consecutively at 3T (Philips) at 1.9±1.6 months pre- and 12.9±4.7 months post-revascularization. The longer duration post-revascularization was chosen as 25/26 hemispheres were revascularized indirectly, which requires 1-2 years for hemodynamic improvements to plateau. The BOLD protocol consisted of two 180s blocks of hypercapnic stimuli (5% CO2) alternated with 180s normocapnia (Fig. 1A)7. Data were slice-time and motion corrected8 and post-processed using the RIPTiDe7 method, which cross-correlates BOLD data with the stimulus timecourse and time-shifts the regressor until the maximum correlation is produced. From this analysis, CVRLAGTIME maps, indicating the time to reach peak correlation, were calculated. CVR-weighted measurements, from the z-statistic map, were normalized by posterior cerebral artery CVR z-statistics (nCVR) to improve comparison fidelity between time points, as posterior circulation stenosis was <70% in all moyamoya subjects. Maps were registered to the T1-weighted images and a standard MNI atlas and grouped into surgical hemispheres (n=26; oriented radiological right) and contralateral (n=17; oriented radiological left), respectively. Values were calculated as a function of depth: total GM, and total, inner, and outer WM; masks were segmented and eroded using FSL9 (Fig. 1B). Plateau time was calculated as the time when BOLD signal did not change significantly. Paired t-tests were used to evaluate differences in means, and Spearman tests were used for significance of correlations.
Results
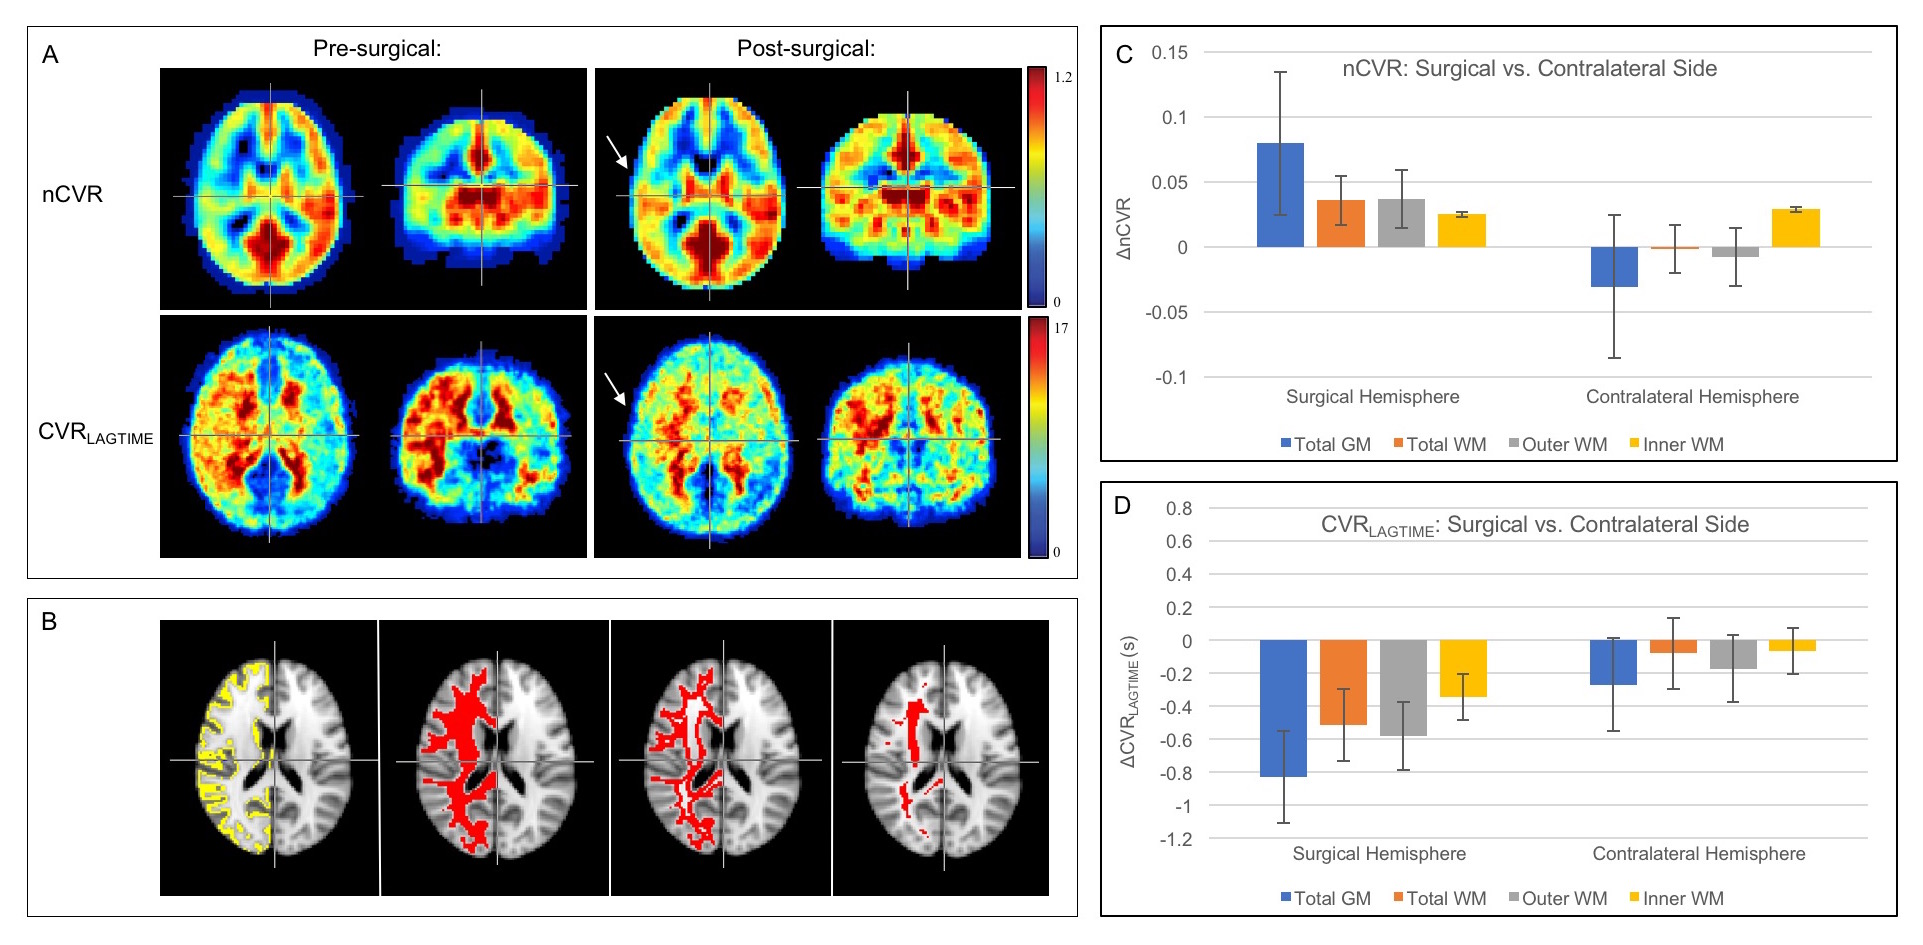
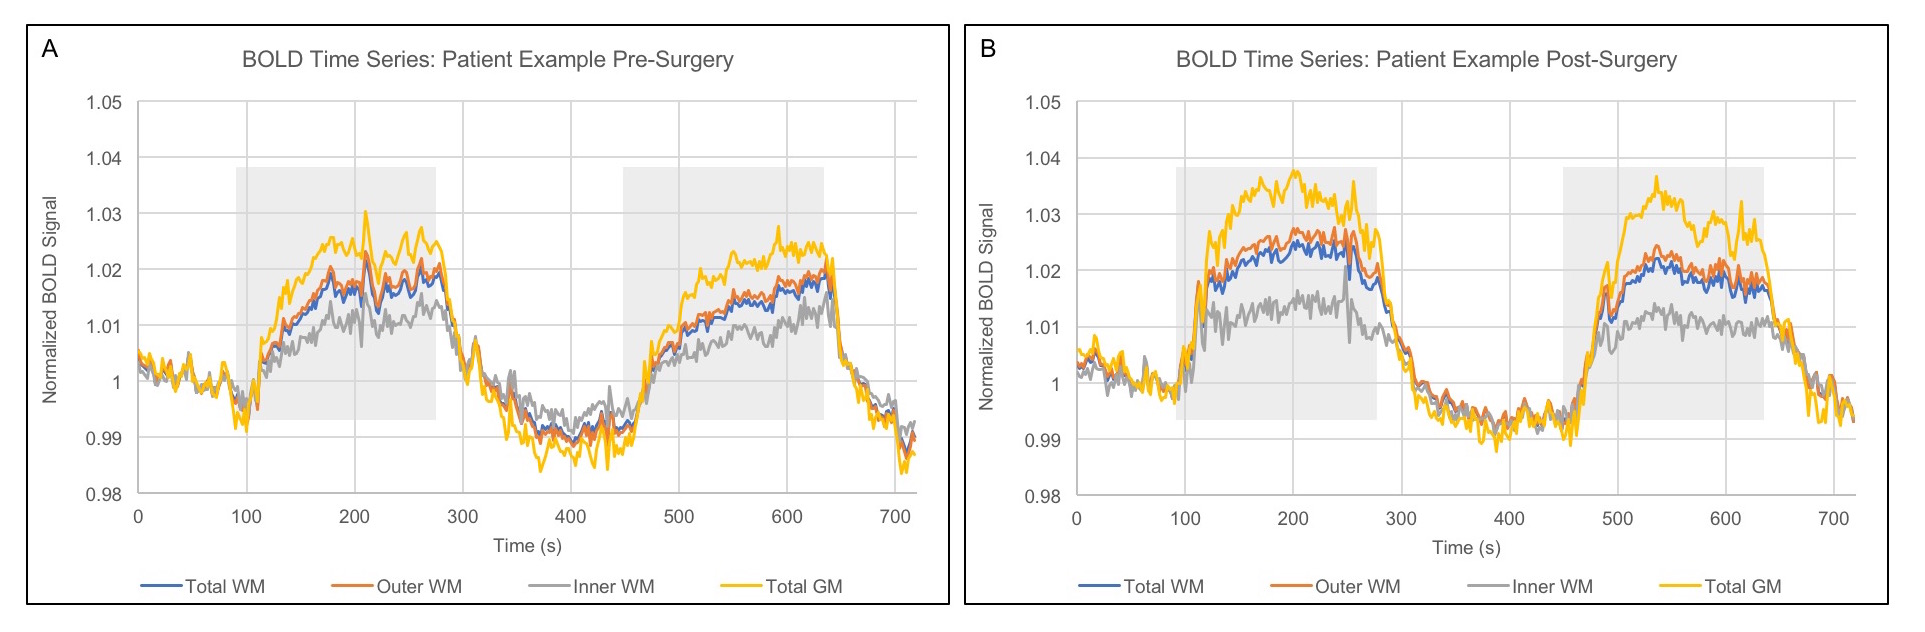
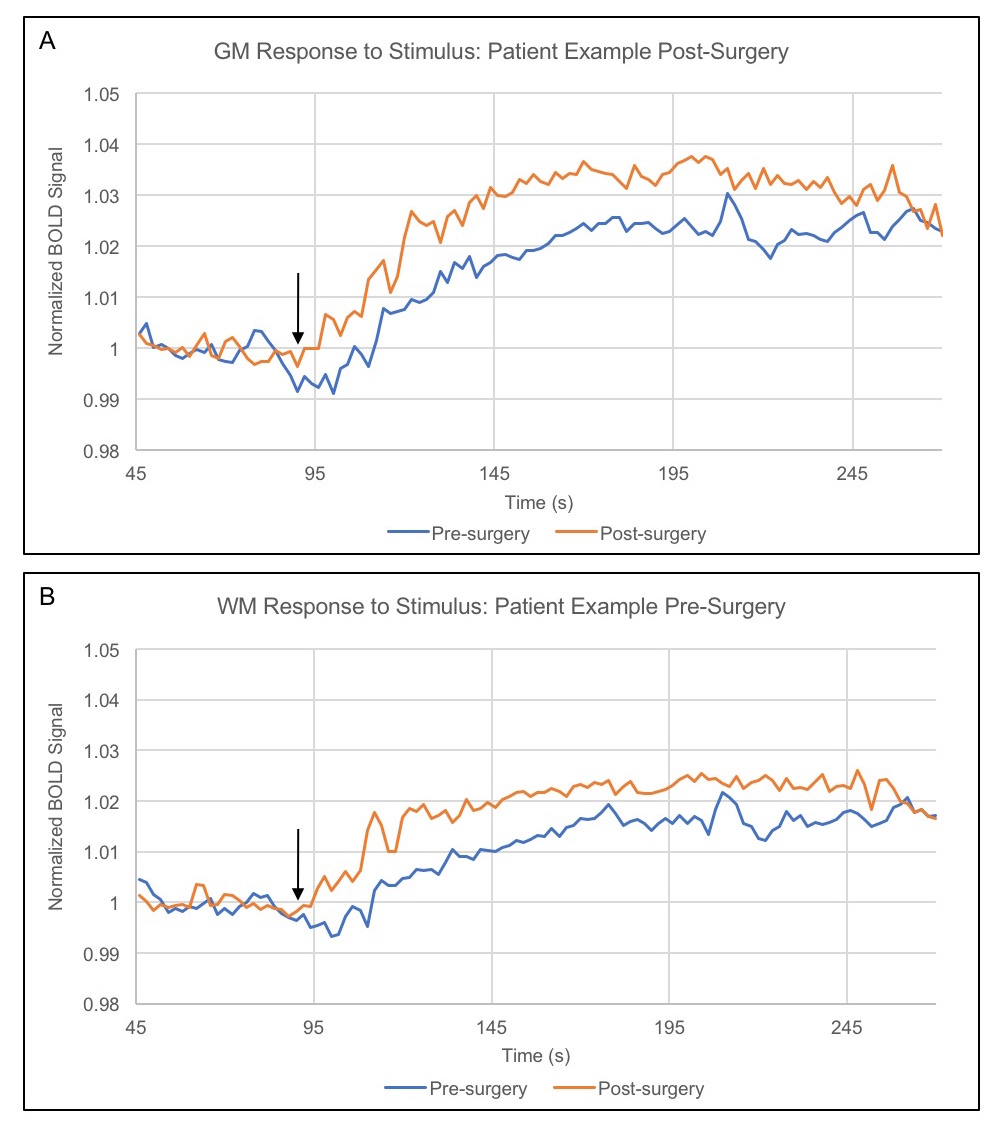
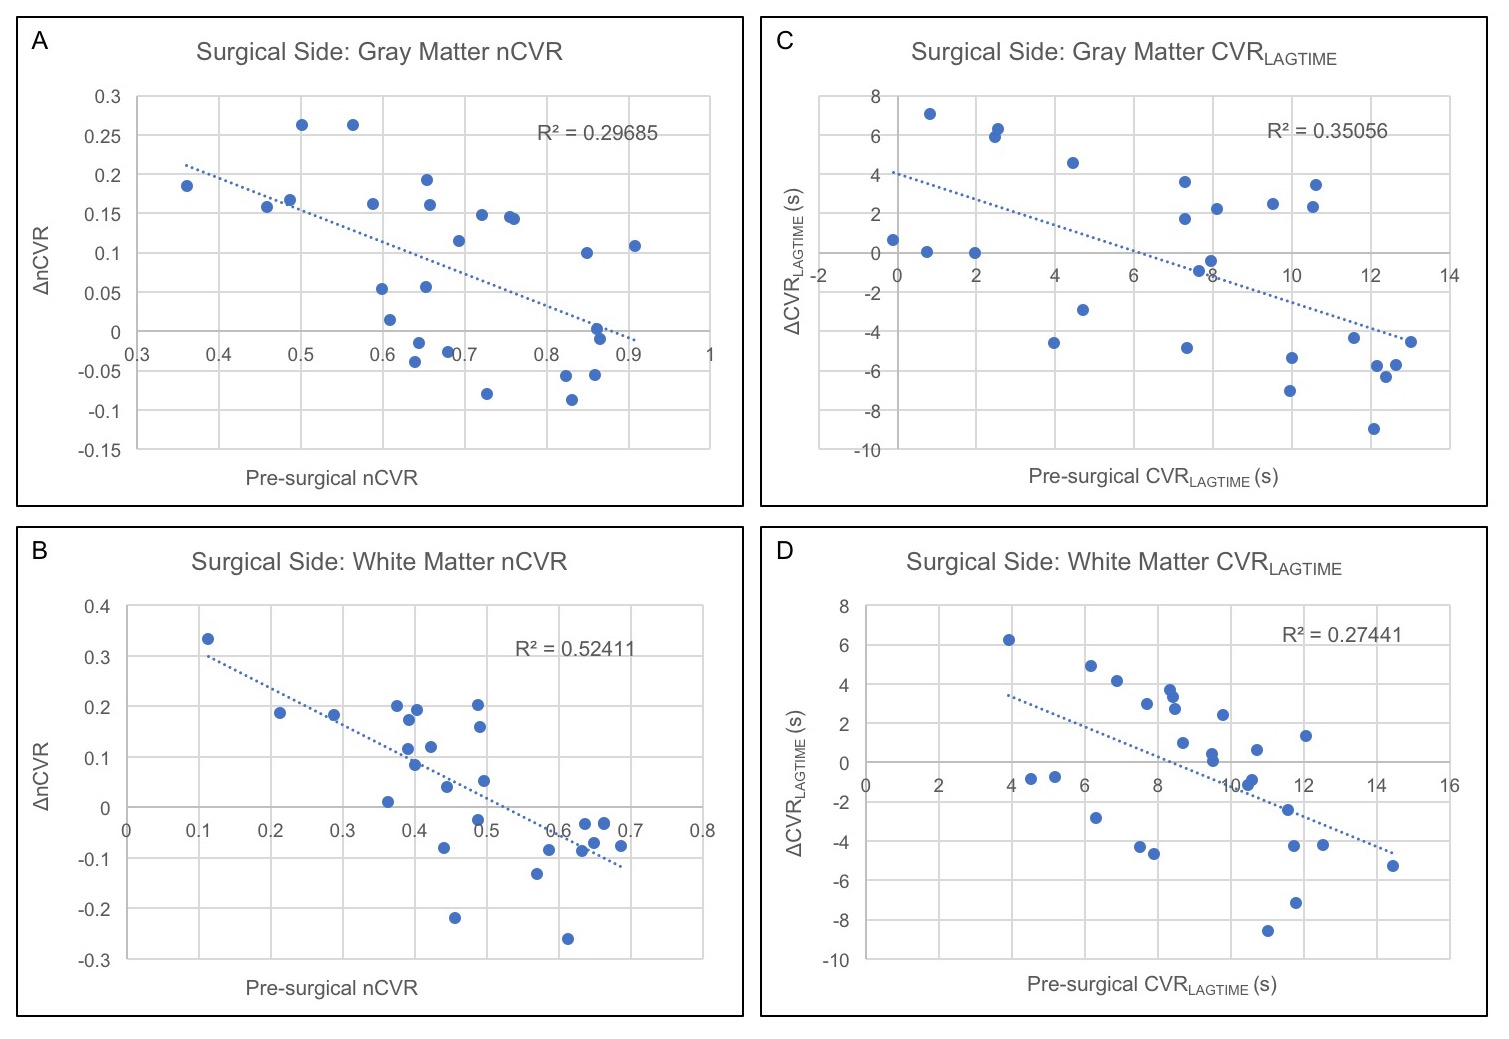
Figure 2 shows group level nCVR increases and CVRLAGTIME decreases post-surgically ipsilateral to surgery in all regions. Pre-revascularization, nCVR in the surgical hemisphere is significantly less than in the contralateral hemisphere in both the GM (p<0.01) and WM (p<0.01), consistent with impairment beyond cortex. In the surgical hemisphere, nCVR increases by 7.5% in total WM, 5.8% in inner WM, 7.5% in outer WM, and 11.6% in GM after revascularization. CVRLAGTIME decreases in the surgical hemisphere by 5.7% in total WM, 3.4% in inner WM, 6.5% in outer WM, and 11.2% in GM (Fig. 2C-D). No differences in mean hemodynamic parameters were observed (p>0.05) in the contralateral hemisphere in any of the regions analyzed, and values were correlated before and after surgery. Figure 3 shows the mean BOLD time series for a single patient, demonstrating reductions in CVRLAGTIME and increases in maximal reactivity from pre- (Fig. 3A) to post-revascularization (Fig. 3B) in both gray (Fig. 4A) and white matter (Fig. 4B). Pre-surgical CVR metrics show a significant inverse relationship with change in the metrics from pre- to post-surgery (Figure 5).Discussion
We performed novel time regression analysis to hypercapnic BOLD data and report reproducible CVR metrics in GM and WM parenchyma in non-surgical hemispheres at two time points, and improvements in GM and WM in surgical hemispheres following revascularization. The decrease in GM CVRLAGTIME may be attributable to improved smooth muscle and/or endothelial compliance to vasoactive stimuli in neo-angiogenic vessels. In WM, a reduction in CVRLAGTIME was also observed, suggesting that the cortical angiogenic changes influence WM parenchyma as well, possibly through reductions in blood arrival time initiated by complex changes in intracranial resistance over a large spatial range. Consistent with infarct topography in moyamoya, reactivity impairments persist in GM and WM, and both parenchymal classes likely benefit from surgical revascularization.Conclusion
nCVR and CVRLAGTIME are impaired in moyamoya patients in both GM and WM. Following surgical revascularization, increases in nCVR and decreases in CVRLAGTIME can be visualized using time regression analysis, and these changes parallel the pre-surgical CVR metrics.Acknowledgements
No acknowledgement found.References
1. Yun TJ, Paeng JC, Sohn CH, et al. Monitoring Cerebrovascular Reactivity through the Use of Arterial Spin Labeling in Patients with Moyamoya Disease. Radiology. 2016;278(1):205-213.
2. van Osch MJP, Teeuwisse WM, van Walderveen MAA, Hendrikse J, Kies DA, van Buchem MA. Can arterial spin labeling detect white matter perfusion signal? Magnetic Resonance in Medicine. 2009;62(1):165-173.
3. Bhogal AA, Philippens ME, Siero JC, et al. Examining the regional and cerebral depth-dependent BOLD cerebrovascular reactivity response at 7T. Neuroimage. 2015;114:239-248.
4. Reich T, Rusinek H. Cerebral cortical and white matter reactivity to carbon dioxide. Stroke. 1989;20(4):453-457.
5. Thomas BP, Liu P, Park DC, van Osch MJ, Lu H. Cerebrovascular reactivity in the brain white matter: magnitude, temporal characteristics, and age effects. J Cereb Blood Flow Metab. 2014;34(2):242-247.
6. Mandell DM, Han JS, Poublanc J, et al. Mapping cerebrovascular reactivity using blood oxygen level-dependent MRI in Patients with arterial steno-occlusive disease: comparison with arterial spin labeling MRI. Stroke. 2008;39(7):2021-2028.
7. Donahue MJ, Strother MK, Lindsey KP, Hocke LM, Tong Y, Frederick BD. Time delay processing of hypercapnic fMRI allows quantitative parameterization of cerebrovascular reactivity and blood flow delays. J Cereb Blood Flow Metab. 2016;36(10):1767-1779.
8. Smith SM, Jenkinson M, Woolrich MW, et al. Advances in functional and structural MR image analysis and implementation as FSL. Neuroimage. 2004;23 Suppl 1:S208-219.
9. Zhang Y, Brady M, Smith S. Segmentation of brain MR images through a hidden Markov random field model and the expectation-maximization algorithm. IEEE Trans Med Imaging. 2001;20(1):45-57.
Figures