0868
Blood pressure correlated fluctuations of BOLD origin in fMRI signals: A multi-echo 7T study.1School of Physics and Astronomy, Cardiff University Brain Research imaging Centre (CUBRIC), Cardiff University, Cardiff, United Kingdom, 2School of Psychology, Caridiff University Brain Research Imaging Centre (CUBRIC), Cardiff University, Cardiff, United Kingdom
Synopsis
Previously we have reported that fluctuations in fMRI signals at approximately 0.1Hz are highly correlated with blood pressure fluctuations at the same frequency. A multi-echo resting-state fMRI experiment was performed at 7T to separate the effect of changes in transverse relaxation (R2*) and longitudinal magnetisation (S0) in these fluctuations. We demonstrate that the magnitudes of correlations with blood pressure are significantly greater for R2* signals, compared with corresponding S0 signals. These data suggest that there is a significant proportion of BOLD dependent signal variance in fMRI that is of non-neuronal origin.
Purpose
Functional MRI is based on the blood-oxygenation-level-dependent (BOLD) effect, which stems primarily from cerebral blood flow (CBF) related changes in transverse relaxation (R2*). Identifying and removing sources of non-neuronal noise is important when investigating brain function [1, 2]. Previously we demonstrated that fluctuations in mean arterial blood pressure (MAP) at approximately 0.1Hz are correlated with fluctuations in fMRI signals at the same frequency [3]. The origin of these 0.1Hz signal fluctuations is unclear, but they could be associated with global flow related changes that are related to cerebral autoregulation [2]. To investigate this further, we have performed a multi-echo experiment to separate the relative contribution of changes in transverse relaxation (R2*) and longitudinal magnetisation (S0).Methods
Image acquisition: Two 10 minute eyes closed resting-state scans were acquired in 5 subjects on a Siemens 7T scanner equipped with a 32-channel NOVA head coil. The CMRR SMS-EPI sequence was used to acquire multi-echo multiband EPI data with three echoes using the following parameters: Scan 1 – TR=1000ms, TE1/2/3=8.14/21.47/34.8ms, flip angle (α)=35°, 2.4mm2 in-plane resolution, 36 slices (2.5mm thick), SMS=4, GRAPPA=2) and Scan 2 - TR=500ms, TE1/2/3=8.14/21.47/34.8ms, flip angle (α)=90°, 2.4mm2 in-plane resolution, 6 slices (2.5mm thick), SMS=1, GRAPPA=2). Beat-to-beat blood pressure was recorded using the Caretaker device (Caretaker, BIOPAC).
Data analysis: Data were first motion corrected, and then a voxel-wise log-linear least-squares fit was used to estimate R2* and S0 time series for each scan. R2* and S0 time series were decomposed into 6 frequency scales using a maximal overlap discrete wavelet transform. The frequency range spanned by each scale of the wavelet decomposition is dependent on the sampling rate (TR), so the 0.1Hz frequency of interest was contained within scales 3 and 4 (0.0625 – 0.125Hz) for scans 1 and 2 respectively.
To account for a haemodynamic delay between MAP and fMRI fluctuations, the correlations between lagged MAP wavelet coefficients and mean grey-matter (GM) R2* wavelet coefficients were calculated. As a decrease in R2* corresponds to an increase in a single-echo T2* weighted EPI sequence, the most negative correlation between MAP and R2* was considered the optimal lag (as found previously, MAP leads fMRI by ~6s). Voxel-wise Pearson’s correlation coefficients (ρ) between the optimal lag MAP wavelet coefficients and matched frequency R2* and S0 wavelet coefficients were calculated, and correlation maps were spatially smoothed (5mm FWHM) and averaged across subjects.
Results
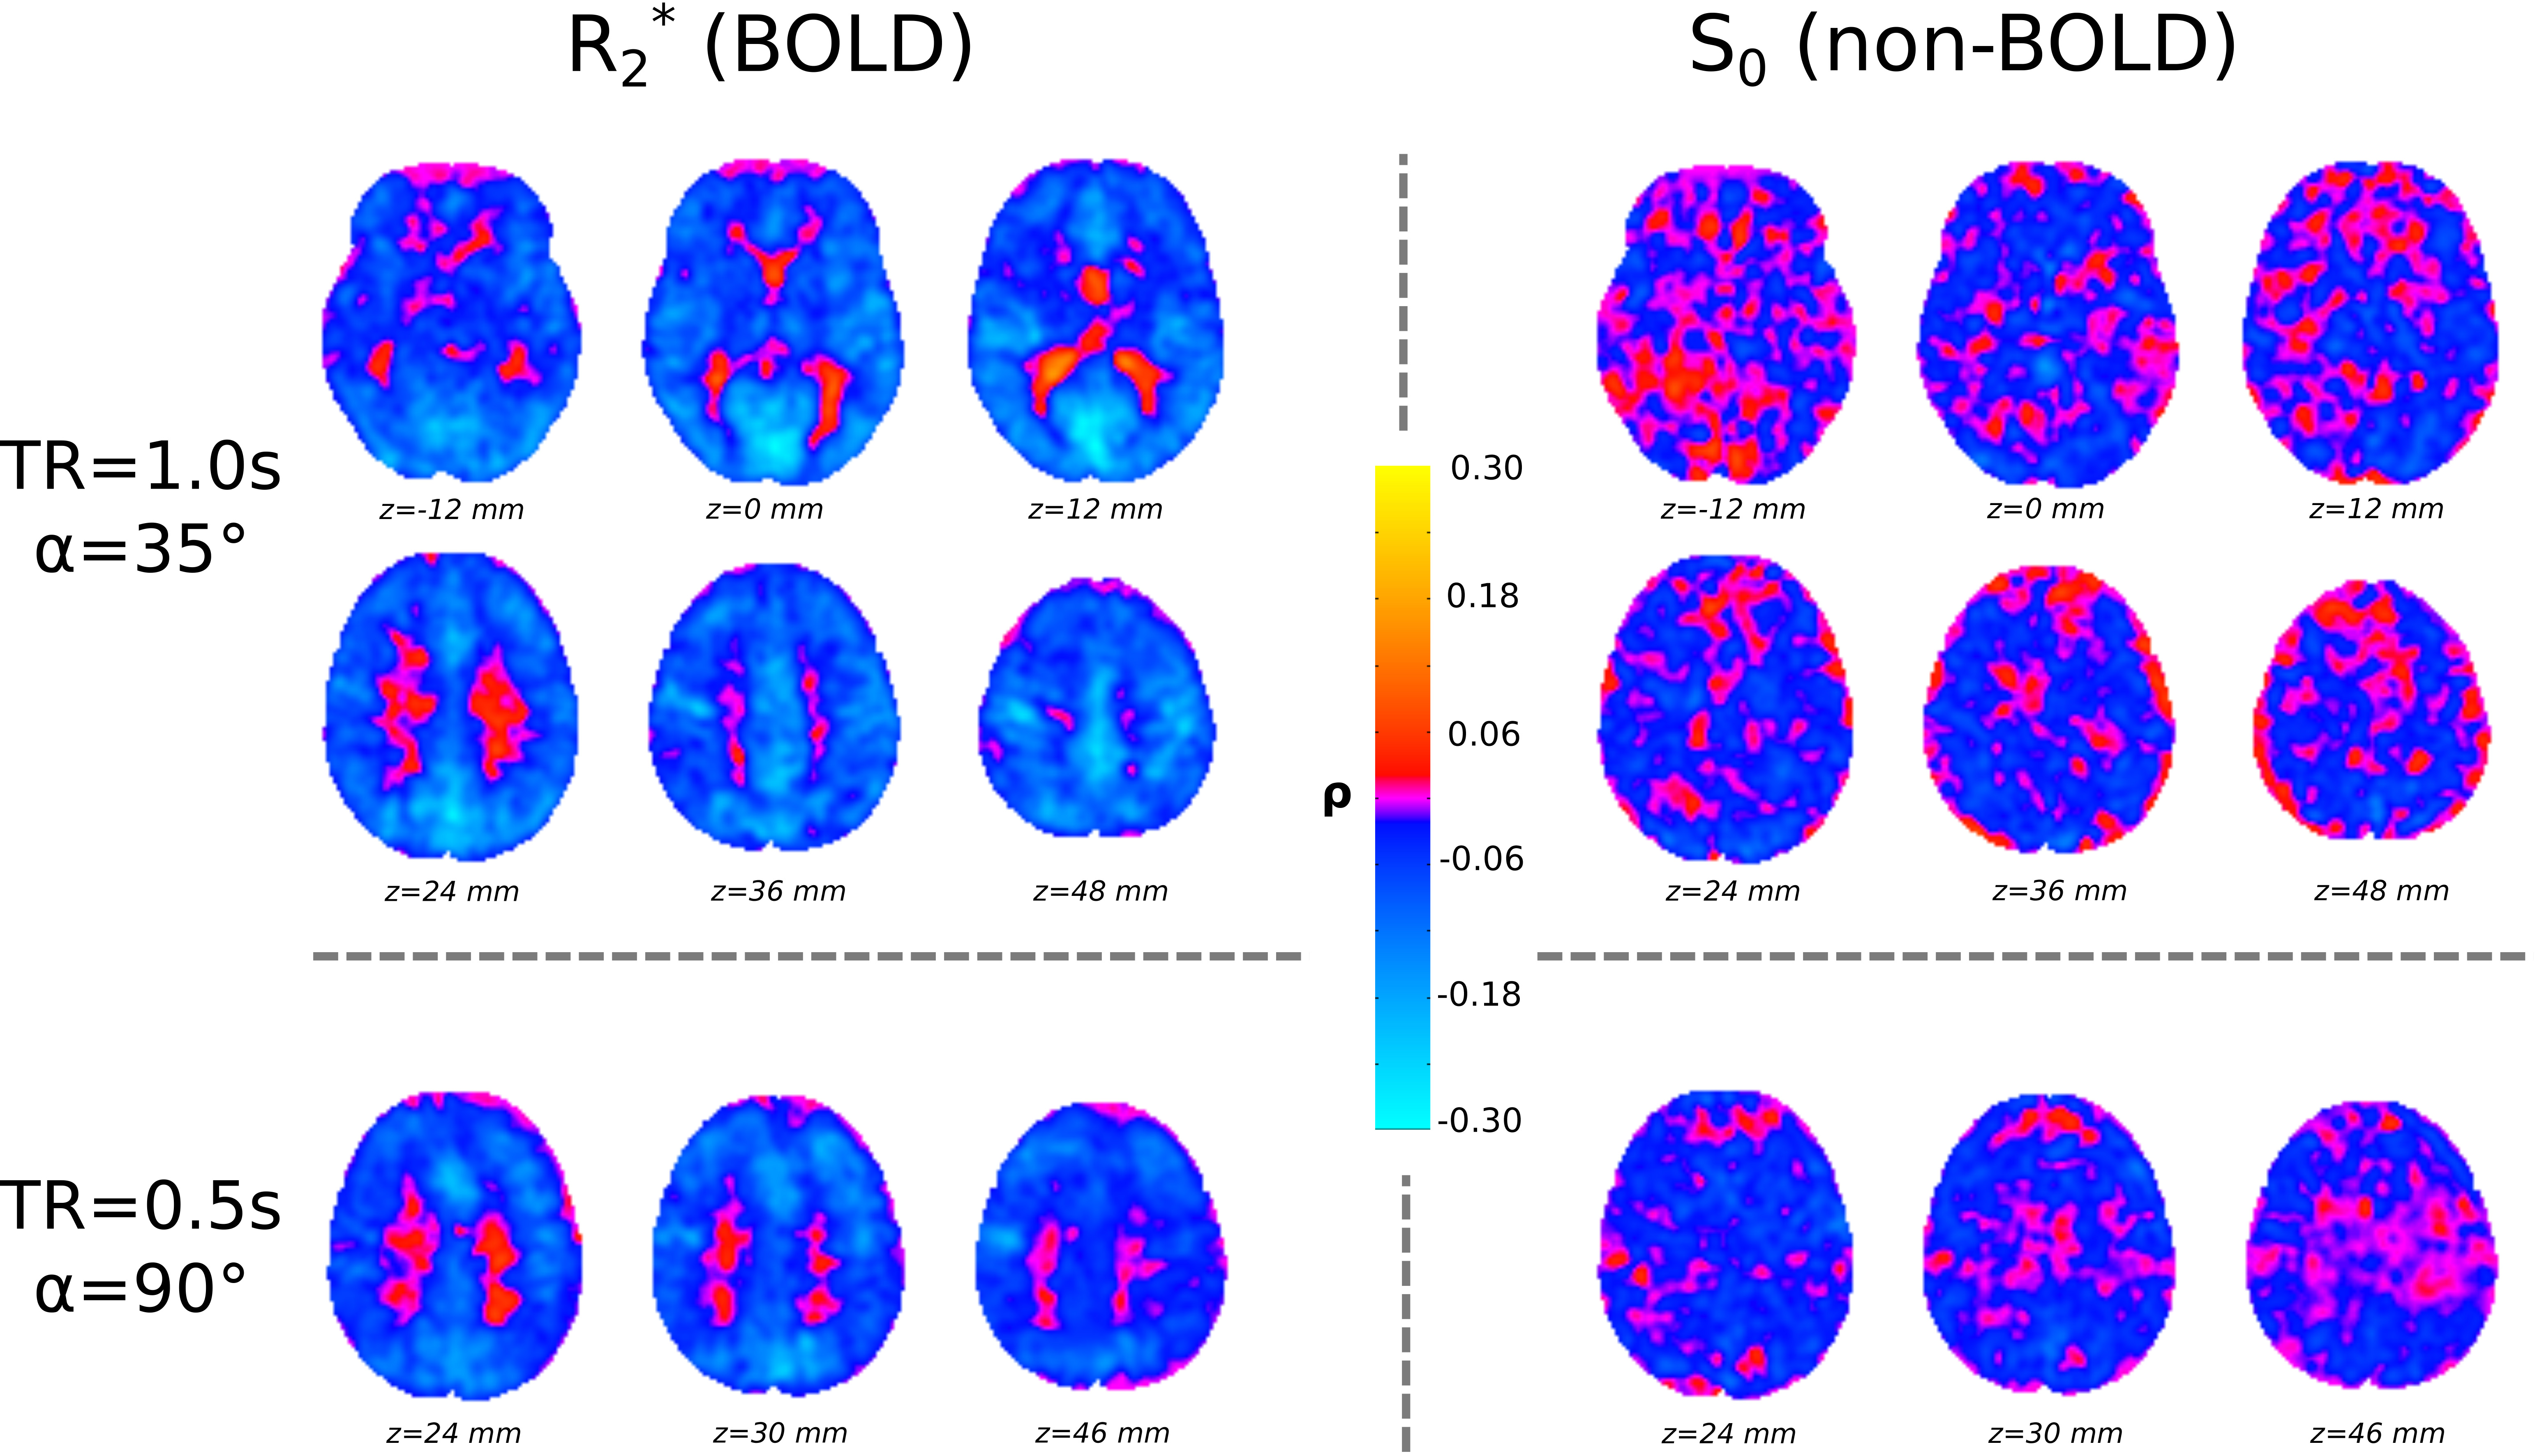
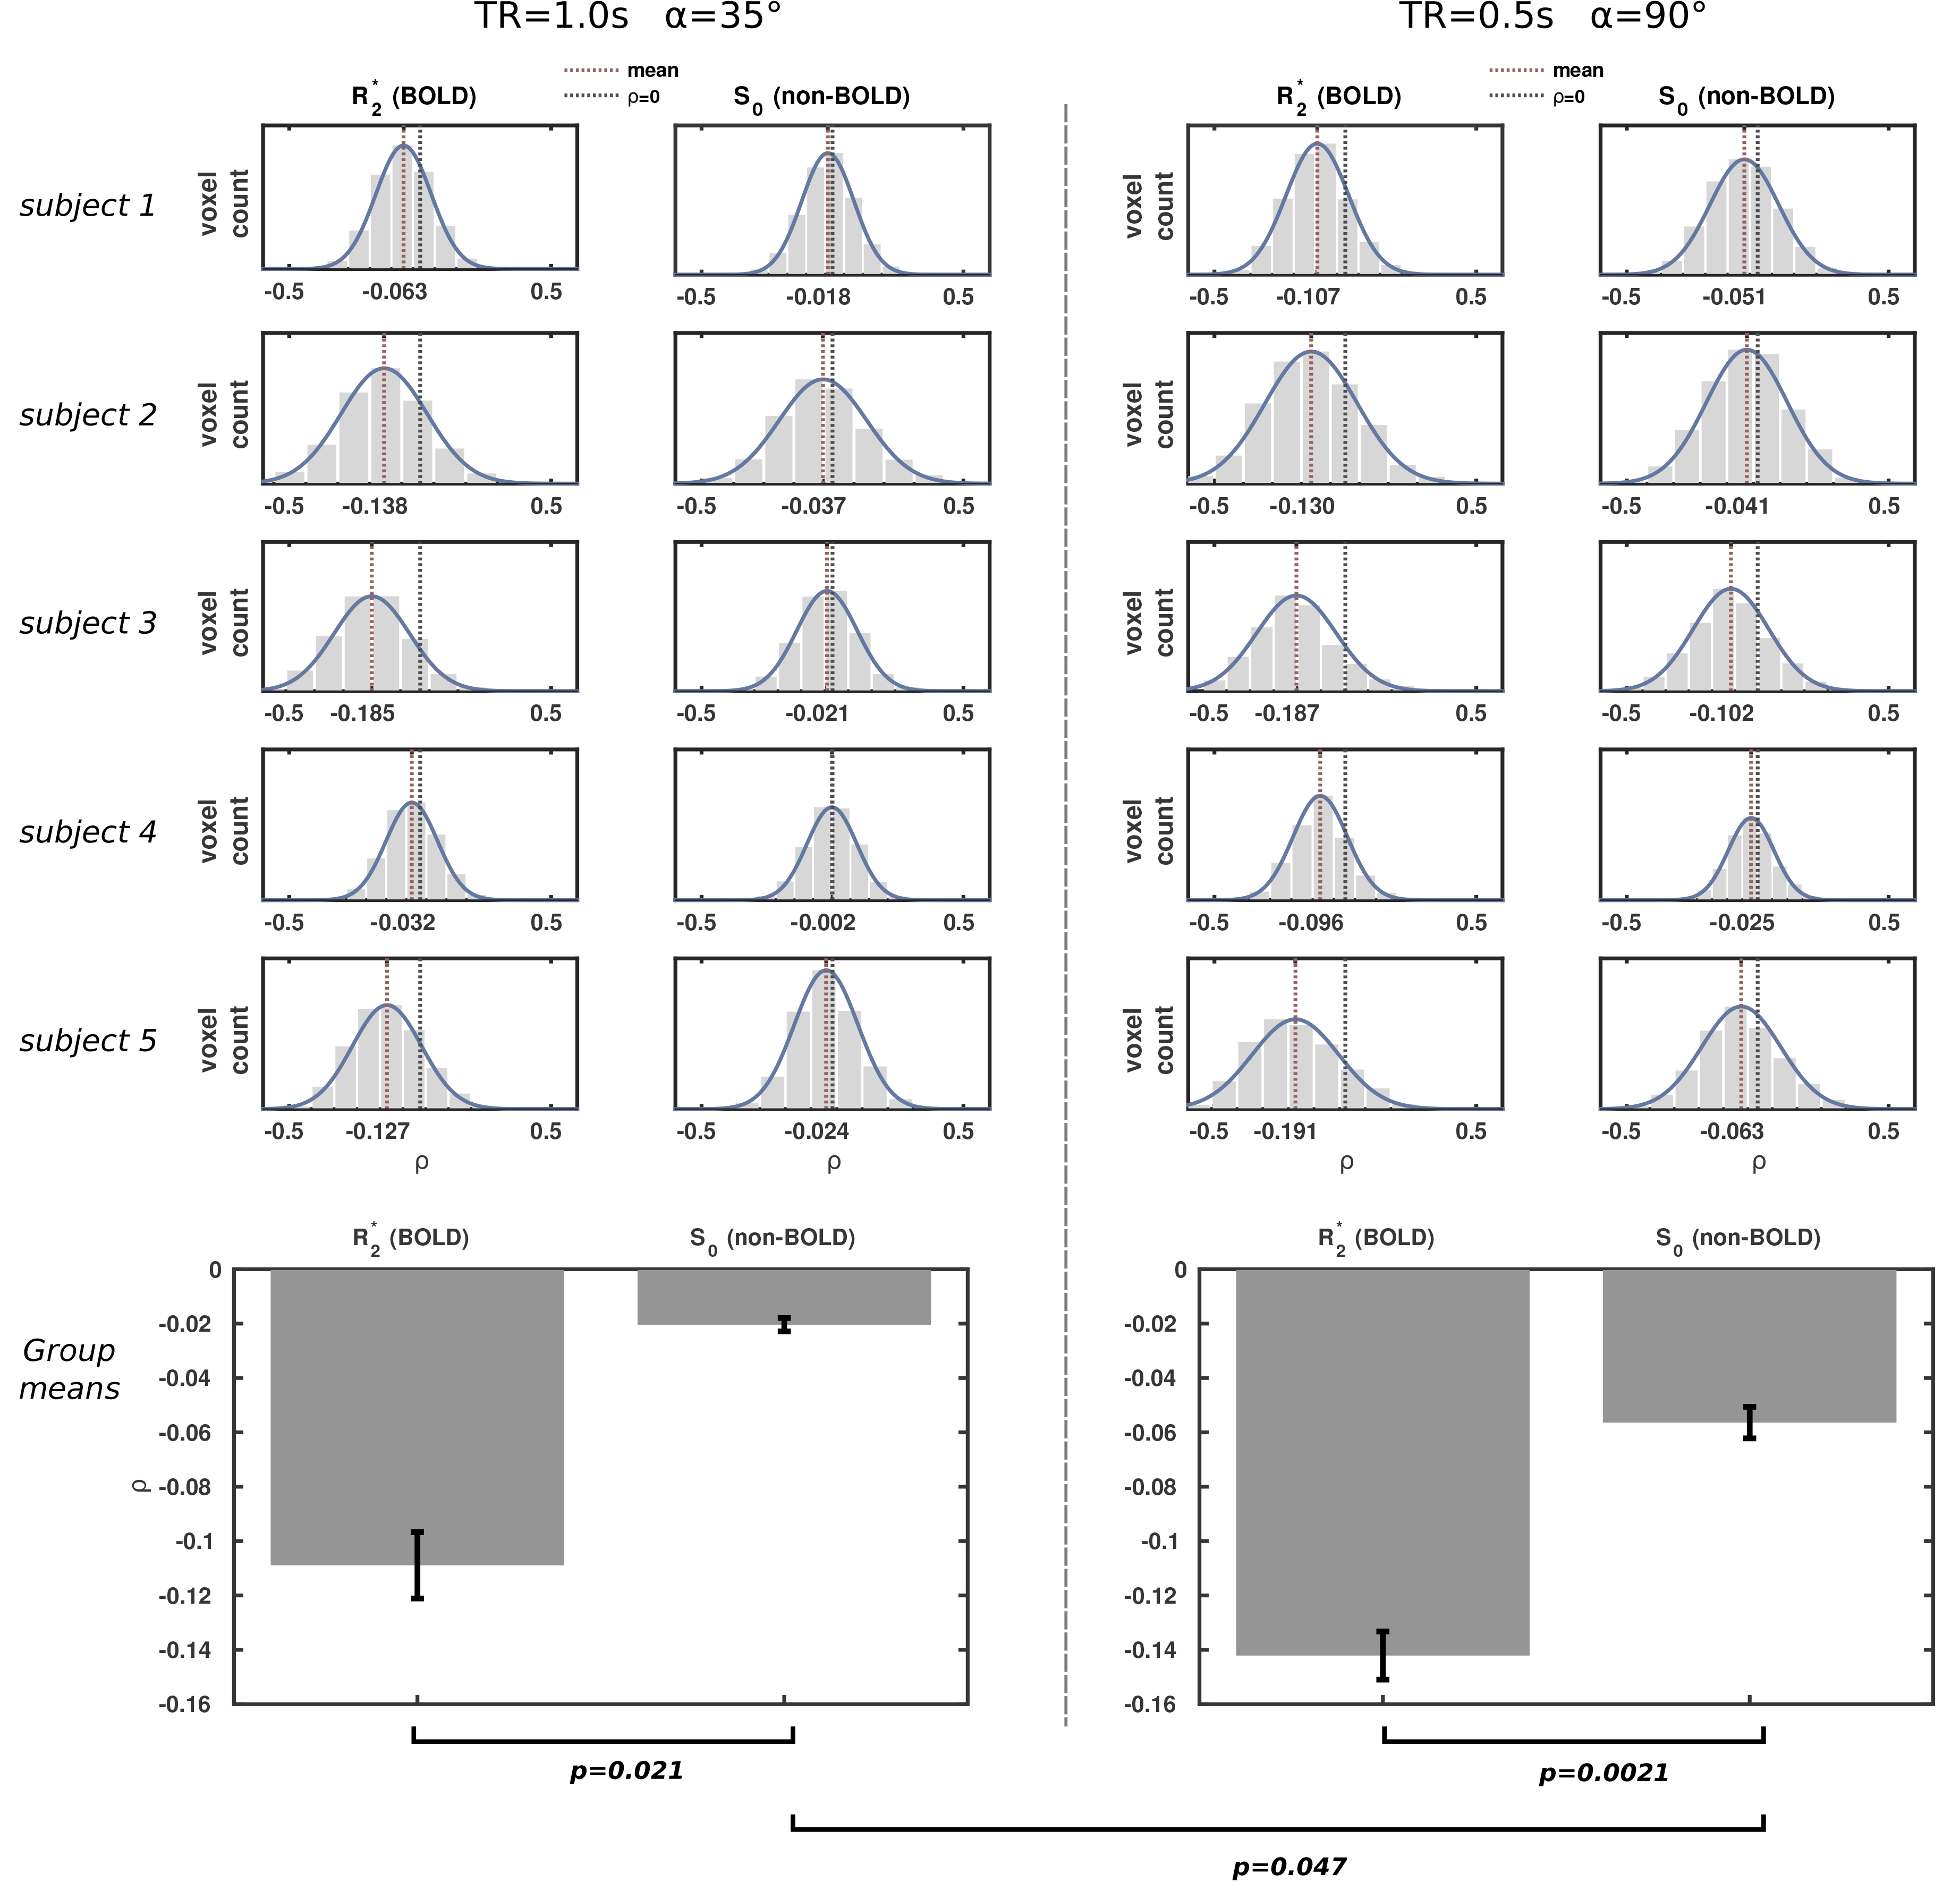
Fig.1 shows the group mean R2* and S0 MAP correlation maps for both scans. The R2* correlation maps very clearly show anatomical structure, with the negative correlations being more confined to GM. The S0 correlations can be seen to be lower in magnitude and lacking any discernable anatomical structure. Fig.2 shows the individual subject correlation coefficient (ρ) distributions in GM, and the group average of the mean GM values. For all subjects it can be seen that the R2*-MAP correlations are greater in magnitude that the S0-MAP correlations. For both scans the group average mean GM correlations are significantly greater in magnitude for R2* compared with S0 (p=0.021 scan 1, p=0.0021 scan2). The higher flip angle and reduced TR of scan 2 does not appear to have any considerable effect on the magnitude of the R2*-MAP correlations, whereas the S0-MAP correlations are significantly greater in magnitude for scan2, possibly indicating an increased contribution of an apparent T1 inflow effect.Discussion
Here we show that fluctuations in fMRI signals that are correlated with MAP at approximately 0.1Hz, are more prominent and spatially structured in R2* than S0 signals, and thus are likely mediated via the BOLD effect. An implicit assumption when inferring brain function using fMRI is that the BOLD signal is highly correlated with underlying neural activity. However, the implication of these data is that a significant proportion of BOLD fluctuations in the brain are due to localised control of blood flow that is independent of neural activity.
Correlation between MAP and BOLD fluctuations don’t establish causality, and so it is not clear how these signals are related, but it may be the case that they have a common systemic origin. A potential candidate is sympathetic nervous activity, which controls blood pressure, but may also influence blood flow in the brain via innervation of cerebral arteries [4]. These data provide an important demonstration that arteriolar mechanisms that regulate localised blood flow in the brain, are not solely responding to metabolic demands of neural activity. More data are required to better understand the nature of these fluctuations, how they relate to cerebrovascular function, and how they confound fMRI studies into brain function.
Acknowledgements
This work was supported by the Wellcome Trust [WT200804]References
1. Caballero-Gaudes, C. and R.C. Reynolds, Methods for cleaning the BOLD fMRI signal. Neuroimage, 2017. 154: p. 128-149.
2. Murphy, K., R.M. Birn, and P.A. Bandettini, Resting-state fMRI confounds and cleanup. Neuroimage, 2013. 80: p. 349-59.
3. Whittaker, J.R., Bright, M.G, Driver, I.D, Murphy, K. Beat-to-beat blood pressure fluctuations are present in time-frequency dynamics of resting-state fMRI. in Proc. Int. Soc. Magn. Reson. Med., 24 (2016), p. 0309. 2016.
4. Brassard, P., M.M. Tymko, and P.N. Ainslie, Sympathetic control of the brain circulation: Appreciating the complexities to better understand the controversy. Auton Neurosci, 2017.
Figures