0867
Resting-State BOLD MRI for Evaluating Cerebrovascular Reserve in Stroke Patients1Department of Radiology, Johns Hopkins University School of Medicine, Baltimore, MD, United States, 2Department of Neurology, Johns Hopkins University School of Medicine, Baltimore, MD, United States
Synopsis
The early stage of hemodynamic failure in ischemic cerebrovascular diseases is characterized by diminished cerebrovascular reserve. Tissues at this stage are at high risk for stroke. Assessment of cerebrovascular reserve by cerebrovascular reactivity (CVR) measurement usually requires the administration of vasoactive challenges (e.g., acetazolamide or CO2), which is often difficult or impractical in stroke patients. In this study, we demonstrate that CVR can be mapped in stroke patients without a physiological challenge but using the natural fluctuations of the resting-state BOLD signal. Results indicate that this technique can assess CVR in lesion, peri-lesional, and healthy tissue in a reproducible manner.
Introduction
The early stage of hemodynamic failure in ischemic cerebrovascular diseases is characterized by diminished cerebrovascular reserve while cerebral blood flow (CBF), cerebral oxygen metabolism and neural functions are still normal1,2. Tissues at this stage are considered to be at high risk for stroke3. Assessment of cerebrovascular reserve usually requires the administration of a vasoactive challenge, e.g. injection of acetazolamide or inhalation of CO2, while monitoring cerebrovascular reactivity (CVR) responses using MRI, CT, or SPECT. However, administration of such a vasoactive challenge to acute stoke patients is often difficult or impractical. Even for chronic patients, the complex procedure and added time and cost often result in CVR imaging being substantially under-utilized in clinical settings.
The purpose of the present study is to demonstrate the feasibility of mapping CVR without using any physiological challenge in stroke patients. The technique exploits resting-state (rs) BOLD fluctuations due to natural fluctuations in breathing pattern and was originally demonstrated and validated in healthy volunteers4. In this work, we evaluated rs-CVR in brain regions corresponding to stroke lesion, peri-lesional area, and contralateral normal tissue. We also tested the reproducibility of this method in a subgroup of patients.
Methods
Subjects: Twenty-three subjects (Table 1) were chosen from a larger stroke study5 based on the following inclusion criteria: (a) have a clinically confirmed stroke, (b) have a rs-BOLD scan, and (c) have at least a T2-weighted image, diffusion-weighted image (DWI), or T2 fluid attenuated inversion recovery (FLAIR) image collected in the same session as rs-BOLD data.
MRI scan: All subjects were scanned on standard 3T systems. The rs-BOLD imaging parameters were: FoV= 240x240x140mm3, resolution=3×3×4mm3, TR/TE=2000/30ms, 210 dynamics. In seven patients, the rs-BOLD scan was repeated in a follow-up visit.
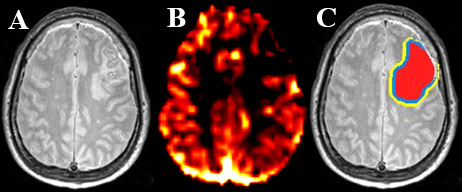
Data analysis: After preprocessing, the rs-BOLD images were temporally filtered with a band-pass filter of 0.02 to 0.04 Hz, where signals fluctuations are mostly attributed to end-tidal CO2 flunucations4. Using the whole-brain-averaged time course as independent variable, voxel-wise regression analysis was employed to calculate a CVR index map in % signal change, which was then normalized to whole-brain average to yield a relative CVR map. ROIs were manually drawn on the stroke lesion (hyperintense areas) and on the contralateral healthy region. Lesion ROIs were dilated to form 2 peri-lesional ROIs. ROIs were drawn on either T2-weighted images (N=14), T2-FLAIR (N=2) or DWI (N=7). Mean relative CVR values were calculated for each ROI.
Statistical analysis: A one-way ANOVA with repeated measures was performed to compare CVR values among ROIs. For patients with follow-up data, CVR between the initial and follow-up data was compared using cross-correlation and paired t-tests. A Bonferroni-corrected p value of 0.05 or less was considered significant.
Results and Discussion
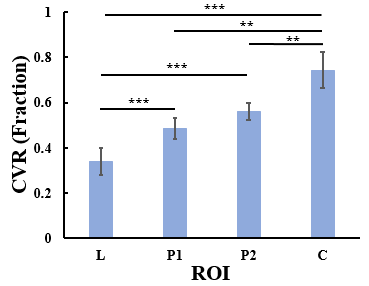
Figure 1 shows T2-weighted image and CVR map in a representative patient. Figure 2 summarizes CVR values in the four ROIs. ANOVA analysis revealed a significant difference in CVR across ROIs. Post-hoc analysis showed that CVR was different (corrected p<0.05) between each pairs of the ROIs, except between P1 and P2 (uncorrected p=0.017 and corrected p=0.1). Relative to control regions, CVR in stroke lesions were diminished by 50.6±38.0%.
Given that ROIs in some patients were delineated based on T2/FLAIR images and those in others were based on DWI images, we divided the participants into two sub-groups and performed the ANOVA analysis separately for the sub-groups. In both analyses, a significant CVR difference (p<0.001 for both T2/FLAIR and DWI sub-groups) was observed across ROIs, suggesting that CVR is diminished in both T2 and diffusion lesion areas. The CVR deficit we found in stroke regions is in agreement with previous studies1,3.
Compared to contralateral control regions, peri-lesional regions also revealed a reduced CVR (Figure 2). This may be because blood vessels in these regions are already dilated to preserve CBF in the presence of reduced perfusion pressure. Thus, these are considered regions with Stage I hemodynamic failure1,2. These findings support the use of resting-state CVR as a biomarker for delineation of Stage I tissues in ischemic cerebrovascular diseases.
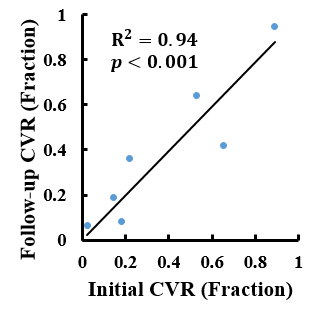
Figure 3 shows a scatter plot between CVR in the stroke lesions at initial scan and at follow-up scan. A strong correlation (R2=0.94, p<0.001) was observed between the two time points, suggesting an excellent reproducibility of the technique. A similar correlation (R2=0.97, p<0.001) was observed for CVR in the control regions.
Conclusion
CVR imaging based on resting-state BOLD MRI provides a task-free and reproducible method to measure vascular reserve in stroke patients. This technique can reveal hemodynamic failure in both lesion and perilesional areas, and may be a useful biomarker in diagnosis, stratification, and prediction of stroke.Acknowledgements
No acknowledgement found.References
- Nemoto EM, Synder JV, Carroll RG, Morita H. Global Ischemia in Dogs: Cerebrovascular CO2 Reactivity and Autoregulation. Stroke 1975;6:425-431.
- Powers WL. Cerebral hemodynamics in ischemic cerebrovascular disease. Ann Neurol. 1991; 29: 231– 240.
- Reinhard M, Schwarzer G, Briel M et al. Cerebrovascular reactivity predicts stroke in high-grade carotid artery disease. Neurol. 2014; 83(16):1424-1431.
- Liu P, Li Y, Pinho M, Park DC, Welch BG, Lu H. Cerebrovascular reactivity mapping without gas challenges. NeuroImage 2017; 146(1):320-326.
- Rajani S, Charltien L, Purcell JJ et al. Imaging Network Level Language Recovery after Left PCA Stroke. Restor. Neurol. Neurosci. 2016; 34(4):473-489.
Figures
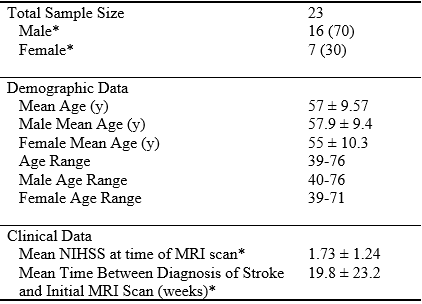
Table 1 Summary of Clinical and Demographic Characteristics of Stroke Patients.
*Number in parenthesis is percentage of whole group