0863
Comparison of velocity-selective and pulsed ASL perfusion MRI in patients with suspected cerebral cortical ischemia1Radiology, Massachusetts General Hospital, Boston, MA, United States, 2MGH/HST Martinos Center for Biomedical Imaging, Charlestown, MA, United States
Synopsis
Traditional pulsed ASL (PASL) suffers from arterial transit delay (ATD) effects, often resulting in inaccurate perfusion measurements in cerebral ischemia. Velocity selective ASL (VSASL), on the other hand, accurately measures perfusion independent of ATD. In this study, we compare VSASL and PASL perfusion in 27 patients with suspected cerebral cortical ischemia. Normal perfusion on VSASL and PASL had nearly perfect negative predictive value for ischemia, abnormal PASL perfusion had a high false positive rate for ischemia (25-35%), and abnormal VSASL perfusion had a ~0% false positive rate for ischemia.
INTRODUCTION
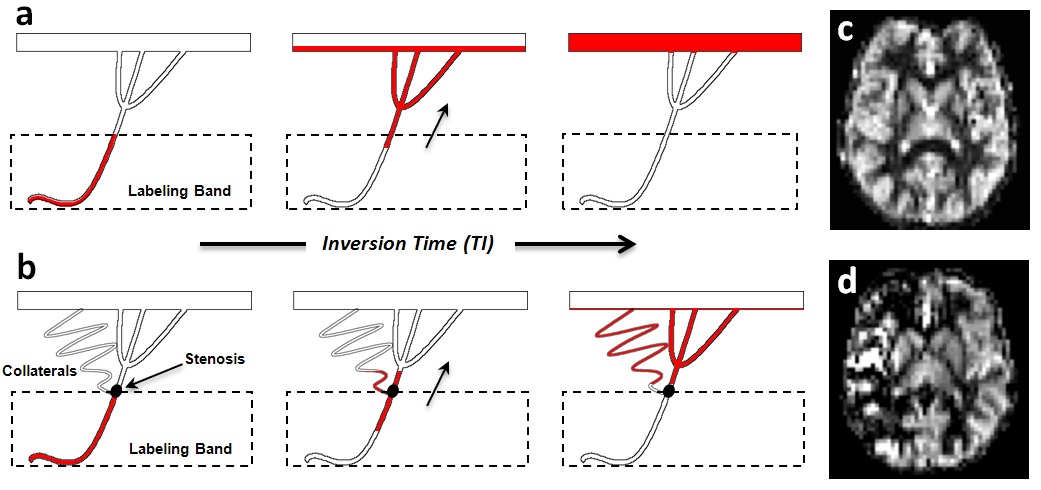
Perfusion imaging is vital for understanding cerebral ischemia. ASL perfusion MR would be ideal for this task, but is susceptible to arterial transit delay (ATD) effects, since the magnetic label must travel from proximal arteries to distant microvasculature1. While ATD effects are minimal in healthy subjects, they can lead to inaccurate perfusion measurements in ischemia2, in part due to delayed flow through proximal stenoses and/or collateral pathways (Figure 1).
Velocity-selective ASL (VSASL) is a newer ASL technique that accurately measures perfusion independent of ATD, since the magnetic label is created within the imaging slab itself, allowing immediate delivery to target microvasculature. Labeling is done via pulses that magnetize blood as it decelerates from small arterioles into the capillary network, based on a user-defined cutoff velocity (VCUTOFF)3. Despite its potential, VSASL has seen only limited clinical use in two small studies investigating moyamoya4,5.
In this study, we compare VSASL to traditional pulsed ASL (PASL) in patients with suspected cerebral cortical ischemia.
METHODS
Subject selection:
Forty-two patients with suspected cerebral cortical ischemia
scanned with an ASL protocol were considered for this IRB-approved study. Fifteen were excluded due to motion, leaving a
total of 27 patients (ages 7–90; 15M, 12F). Fifteen of these patients had subsequent
CT or MR neuroimaging.
Acquisition/image processing:
MR imaging included VSASL, PASL, and conventional DWI,
FLAIR, and susceptibility sequences. VSASL-specific parameters were VCUTOFF=2.1cm/s
and TI=1100ms6. PASL-Q2tips specific
parameters were TI1=800ms, TI1,stop=1600ms, TI2=2000ms, and label width=150mm.
PASL parameters were chosen based on ASL white paper recommendations for patients7.
Most scans were acquired with a 2D-EPI module: TE/TR=13/3000ms, 3.5x3.5x5.0 mm3
voxels, 16 slices, BW=2365 Hz/pixel, scan time=3.1m. A few scans were acquired with
a 3D-GRASE module: TE/TR=21/3000ms, 3.2x3.2x4.0 mm3 voxels, 24 slices, BW=2440 Hz/pixel,
scan time=3.3m. ASL perfusion maps were generated by performing pairwise
subtractions on tag-control image pairs, followed by averaging the resultant subtraction
series.
Data Analysis:
Two neuroradiologists (a second-year fellow and senior
attending) independently graded the ASL perfusion maps, considering five cortical
vascular territories per hemisphere: ACA, frontal MCA, temporal MCA, parietal
MCA, and PCA. A territory received a “0” for a perfusion deficit or “1”
for normal perfusion without deficit. A Kappa statistic was calculated to assess
inter-rater agreement. The territories were also evaluated for significant ischemia-related
abnormalities on 1) concurrently-performed conventional sequences and 2) subsequent
MR/CT imaging (if available) or by clinical assessment.
RESULTS
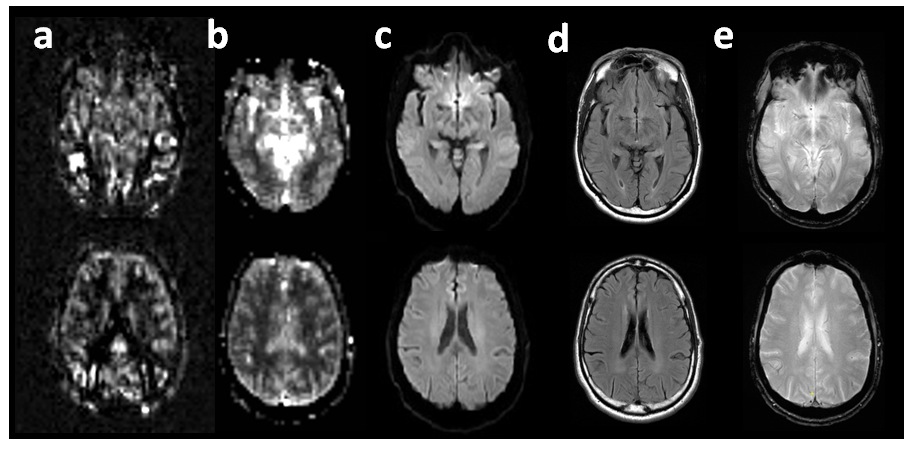
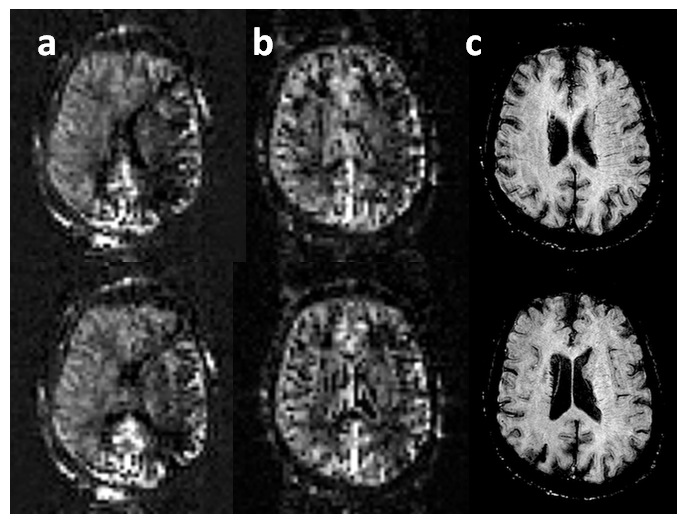
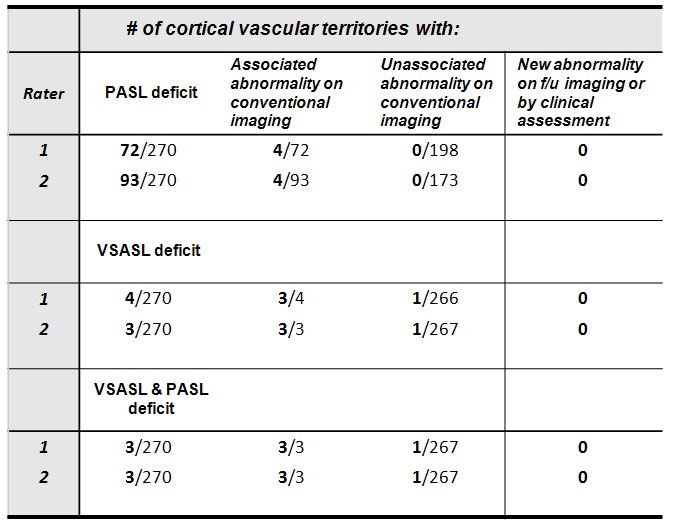
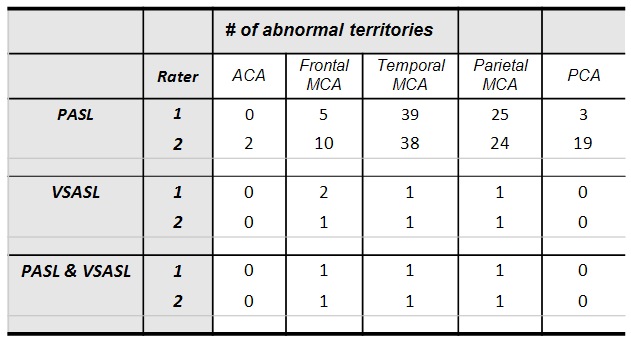
Table 1 summarizes ASL grading, abnormalities on concurrent conventional imaging, and new abnormalities by subsequent imaging and/or clinical assessment. Table 2 provides the distribution of “0” grades for PASL/VSASL across territories. Substantial agreement and almost perfect agreement was found between raters for PASL(K=0.68) and VSASL(K=0.86), respectively. Figure 2 provides a representative example of a patient with significant PASL abnormality, but with preserved VSASL and normal DWI, FLAIR, and susceptibility imaging. Figure 3 provides data from a patient with a matched VSASL/PASL deficit and associated susceptibility abnormalities.DISCUSSION
Normal PASL and VSASL cortical perfusion had nearly perfect negative predictive value for current or subsequent ischemic changes (by either conventional imaging or subsequent clinical assessment). Abnormal PASL perfusion, however, had a very high false positive rate (between 25 and 35%) for associated ischemic changes. Moreover, 100% of the PASL false positives had normal VSASL perfusion, suggesting that despite use of recommended PASL parameter values, ATD errors significantly impairs perfusion evaluation in this patient population. Conversely, VSASL demonstrated an exceptional ~0% false positive rate. Interestingly, the one case with a matched PASL/VSASL abnormality had positive susceptibility findings, with a matching clinical syndrome (Figure 3), and the one case with a conventional imaging abnormality without VSASL deficit seen prospectively, was retrospectively noted to have a deficit. While these findings suggest that VSASL may correlate with ischemic changes on conventional imaging, further investigation is required, because there were very few abnormal VSASL and conventional imaging findings in this study.CONCLUSION
Normal VSASL and PASL perfusion have a high negative predictive value for current and future ischemia in this small population with suspected cerebral cortical ischemia. PASL, however, has a very high false positive rate for ischemia, likely due to ATD errors. VSASL additionally demonstrates ~0% false positive rate for ischemia in this population.Acknowledgements
Supported in part by the NIH NIBIB (P41-EB015896, R01-EB023281, and R01-EB019437), by the BRAIN Initiative/NIH NIMH (R01-MH111419), and by the MGH/HST Athinoula A. Martinos Center for Biomedical Imaging. Div Bolar is supported by an RSNA Resident/Fellows Research Grant.References
1. Buxton RB, Frank LR, Wong EC, et al. A general kinetic model for quantitative perfusion imaging with arterial spin labeling. Magn Reson Med. 1998;40:383-396
2. Zaharchuk G. Arterial spin-labeled perfusion imaging in acute ischemic stroke. Stroke. 2014;45:1202-1207
3. Wong EC, Cronin M, Wu W-C, et al. Velocity-selective arterial spin labeling. Magn Reson Med. 2006;55:1334-1341
4. Bolar DS, Gagoski B, Robertson RL, et al. Comparison of cbf measured with velocity selective asl and pulsed asl in pediatric patients with prolonged arterial transit times due to moymoya disease. ISMRM 2015. Toronto, CA.
5. Qiu D, Straka M, Zun Z, et al. Cbf measurements using multidelay pseudocontinuous and velocity-selective arterial spin labeling in patients with long arterial transit delays: Comparison with xenon ct cbf. J Magn Reson Imaging. 2012;36:110-119
6. Wu W-C, Wong EC. Intravascular effect in velocity-selective arterial spin labeling: The choice of inflow time and cutoff velocity. Neuroimage. 2006;32:122-128
7. Alsop dC, Detre JA, Golay X, et al. Recommended implementation of arterial spin-labeled perfusion mri for clinical applications: A consensus of the ismrm perfusion study group and the european consortium for asl in dementia. Magn Reson Med. 2014
Figures