0860
Non-contrast fingerprinting perfusion imaging reveals hemodynamic deficits in cerebrovascular diseases1The Russell H. Morgan Department of Radiology & Radiological Science, Johns Hopkins University School of Medicine, Baltimore, MD, United States, 2Graduate School of Biomedical Sciences, University of Texas Southwestern Medical Center, Dallas, TX, United States, 3Department of Biomedical Engineering, Johns Hopkins University School of Medicine, Baltimore, MD, United States, 4Department of Neurology, Johns Hopkins University School of Medicine, Baltimore, MD, United States, 5Department of Neurosurgery, Johns Hopkins University School of Medicine, Baltimore, MD, United States, 6Physical Medicine and Rehabilitation, Johns Hopkins University School of Medicine, Baltimore, MD, United States, 7Cognitive Science, Johns Hopkins University, Baltimore, MD, United States
Synopsis
Perfusion imaging plays an important role in management decisions for a variety of cerebrovascular diseases. Most clinical perfusion MRI of stroke requires the use of contrast agent. However, contrast-agent perfusion cannot be used or fails to be used in 10-20% of patients. Therefore, an alternative technique to Gd-perfusion will benefit a substantial number of patients in clinical practice. Recently, a MR-Fingerprinting (MRF) ASL was developed for simultaneous estimations of CBF and bolus timing. In this study, we demonstrated the clinical utility of MRF-ASL in two types of cerebrovascular diseases, ischemic stroke and Moyamoya disease.
Purpose
Perfusion imaging plays an important role in management decisions for a variety of cerebrovascular diseases, such as ischemic stroke1 and chronic occlusive diseases, e.g. Moyamoya disease2. At present, most clinical perfusion MRI of stroke requires the use of contrast agent. However, contrast-agent perfusion cannot be used or fails to be used in 10-20% of patients. This is due to a variety of reasons, such as allergic reactions3, low glomerular filtration rate4, difficulties in placing an intravenous line that is suitable for a rapid injection rate (5 ml/s), or human errors in the timing of injection. Therefore, an alternative technique to Gd-perfusion will benefit a substantial number of patients in clinical practice. Conventional ASL is insufficient because it only provides an estimation of CBF but not the more widely used timing parameters such as time-to-peak (TTP) or Tmax. Recently, a MR-Fingerprinting (MRF) ASL5 was developed for simultaneous estimations of CBF and bolus timing. In this study, we demonstrated the clinical utility of MRF-ASL in two types of cerebrovascular diseases, ischemic stroke and Moyamoya disease.Methods
Participants:
18 subjects were studied, including 9 stroke patients (53±17yo, 5F), 4 Moyamoya patients (40±13yo, 4F) and 5 healthy normal controls (29±6yo, 3F).
MR Experiment:
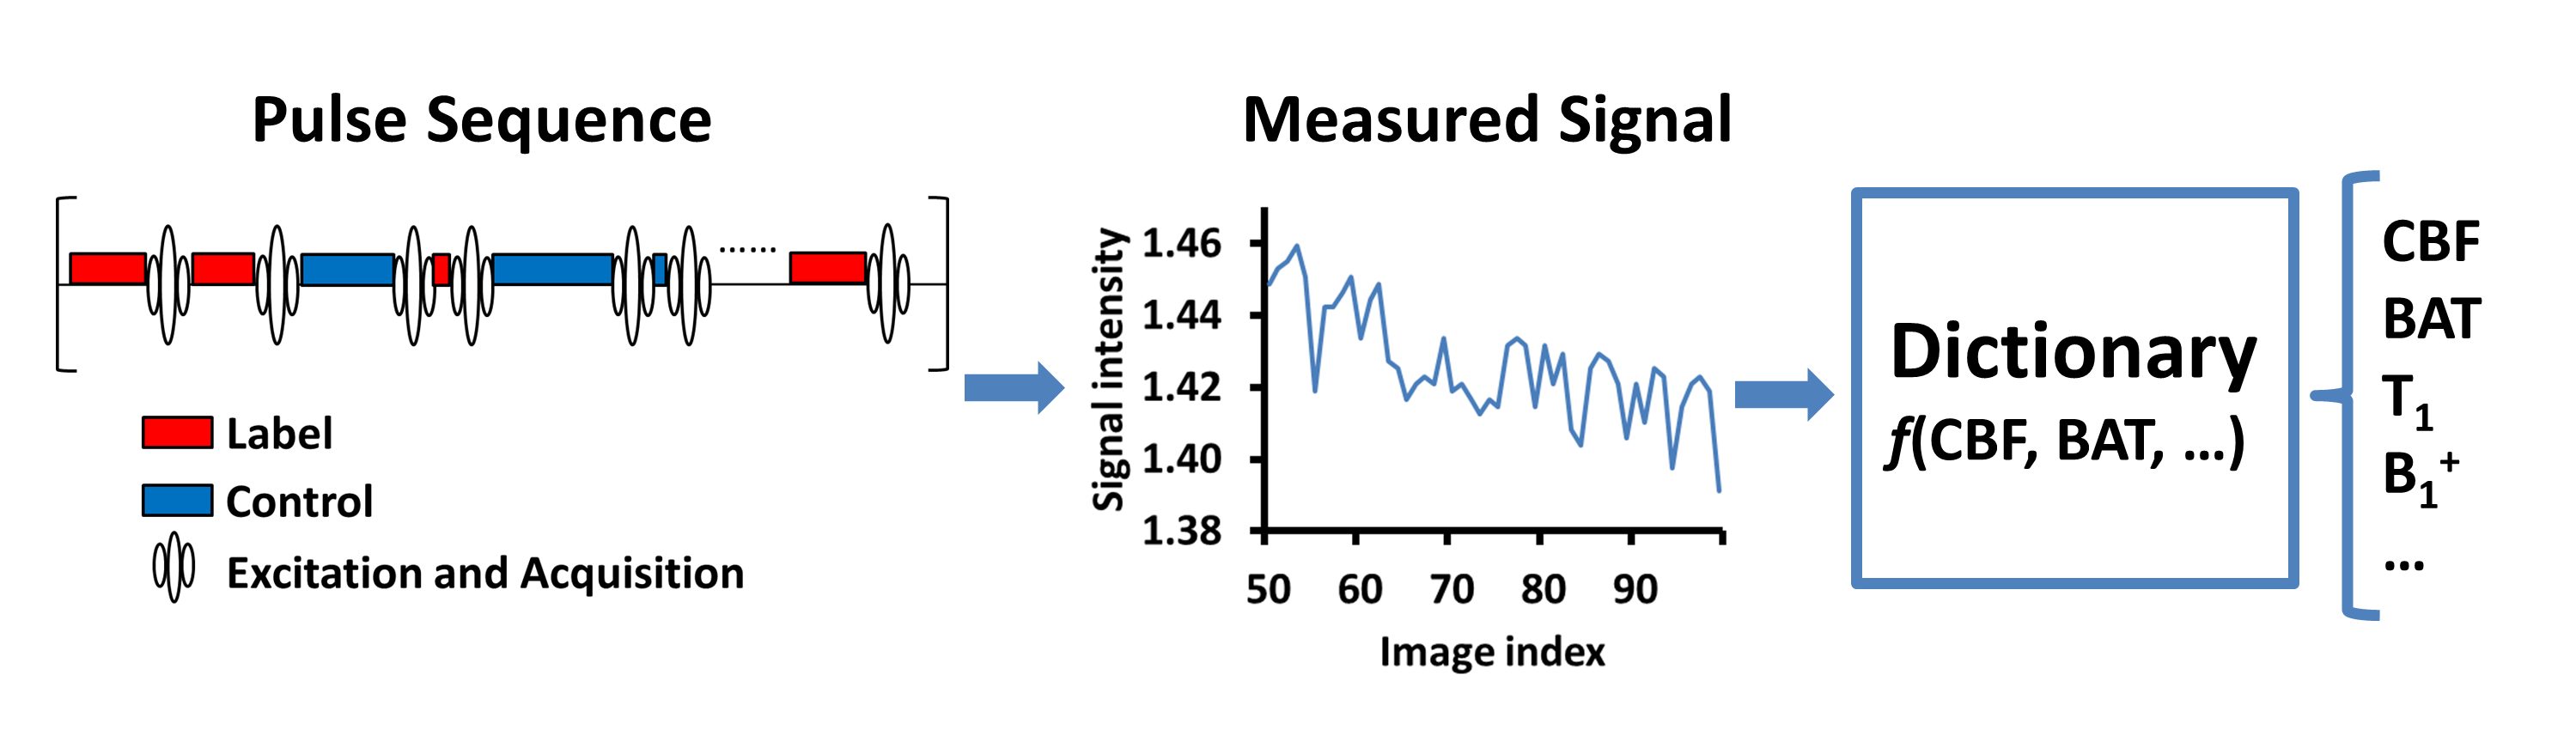
All studies were performed on a 3T MRI (Philips) with informed consent using an IRB-approved protocol. The MRF-ASL sequence has been described previously5 and is illustrated in Figure 1. This technique can simultaneously quantify 7 parameters in a single scan of less than 4min. Imaging parameters of MRF-ASL were: 2D multi-slice EPI; matrix size=64×64; resolution=2.81mm×2.81mm; 7 slices, thickness=10mm, 500 dynamics; scan duration=3min 43s. For the stroke patients, additional sequences included DWI and FLAIR for evaluations of lesion area. For the Moyamoya patients, a time-of-flight angiography (TOF) was acquired to visualize arterial stenosis.
Data Analysis:
Bolus arrival time (BAT) and CBF maps were generated by dictionary matching5. These maps were then normalized to the MNI template. Quantitative analyses were based on perfusion territories of MCA, ACA, and PCA, using the perfusion atlas of van Laar et al6.
In stroke patients, the region of stroke (based on DWI and FLAIR) was first labeled as MCA, ACA, PCA territories, or their combinations. Then, averaged BAT and CBF within that territory were calculated and used as values for the stroke region. The corresponding contralateral regions were also averaged to yield BAT and CBF of the healthy region. Paired t tests were used to compare the perfusion parameters between the stroke and contralateral side.
In Moyamoya patients, territories suffering from stenosis were first determined by examining the morphology of ICA using the angiography. BAT and CBF of stenotic perfusion territories were calculated. BAT and CBF of PCA territories (which do not have stenosis in Moyamoya) were also obtained and used as a reference region. The difference in perfusion parameters between stenotic and reference regions were calculated. Because ICA and PCA territories show variations even in healthy individuals, the ICA-vs-PCA difference was also calculated in a group of healthy participants.
Results and Discussion
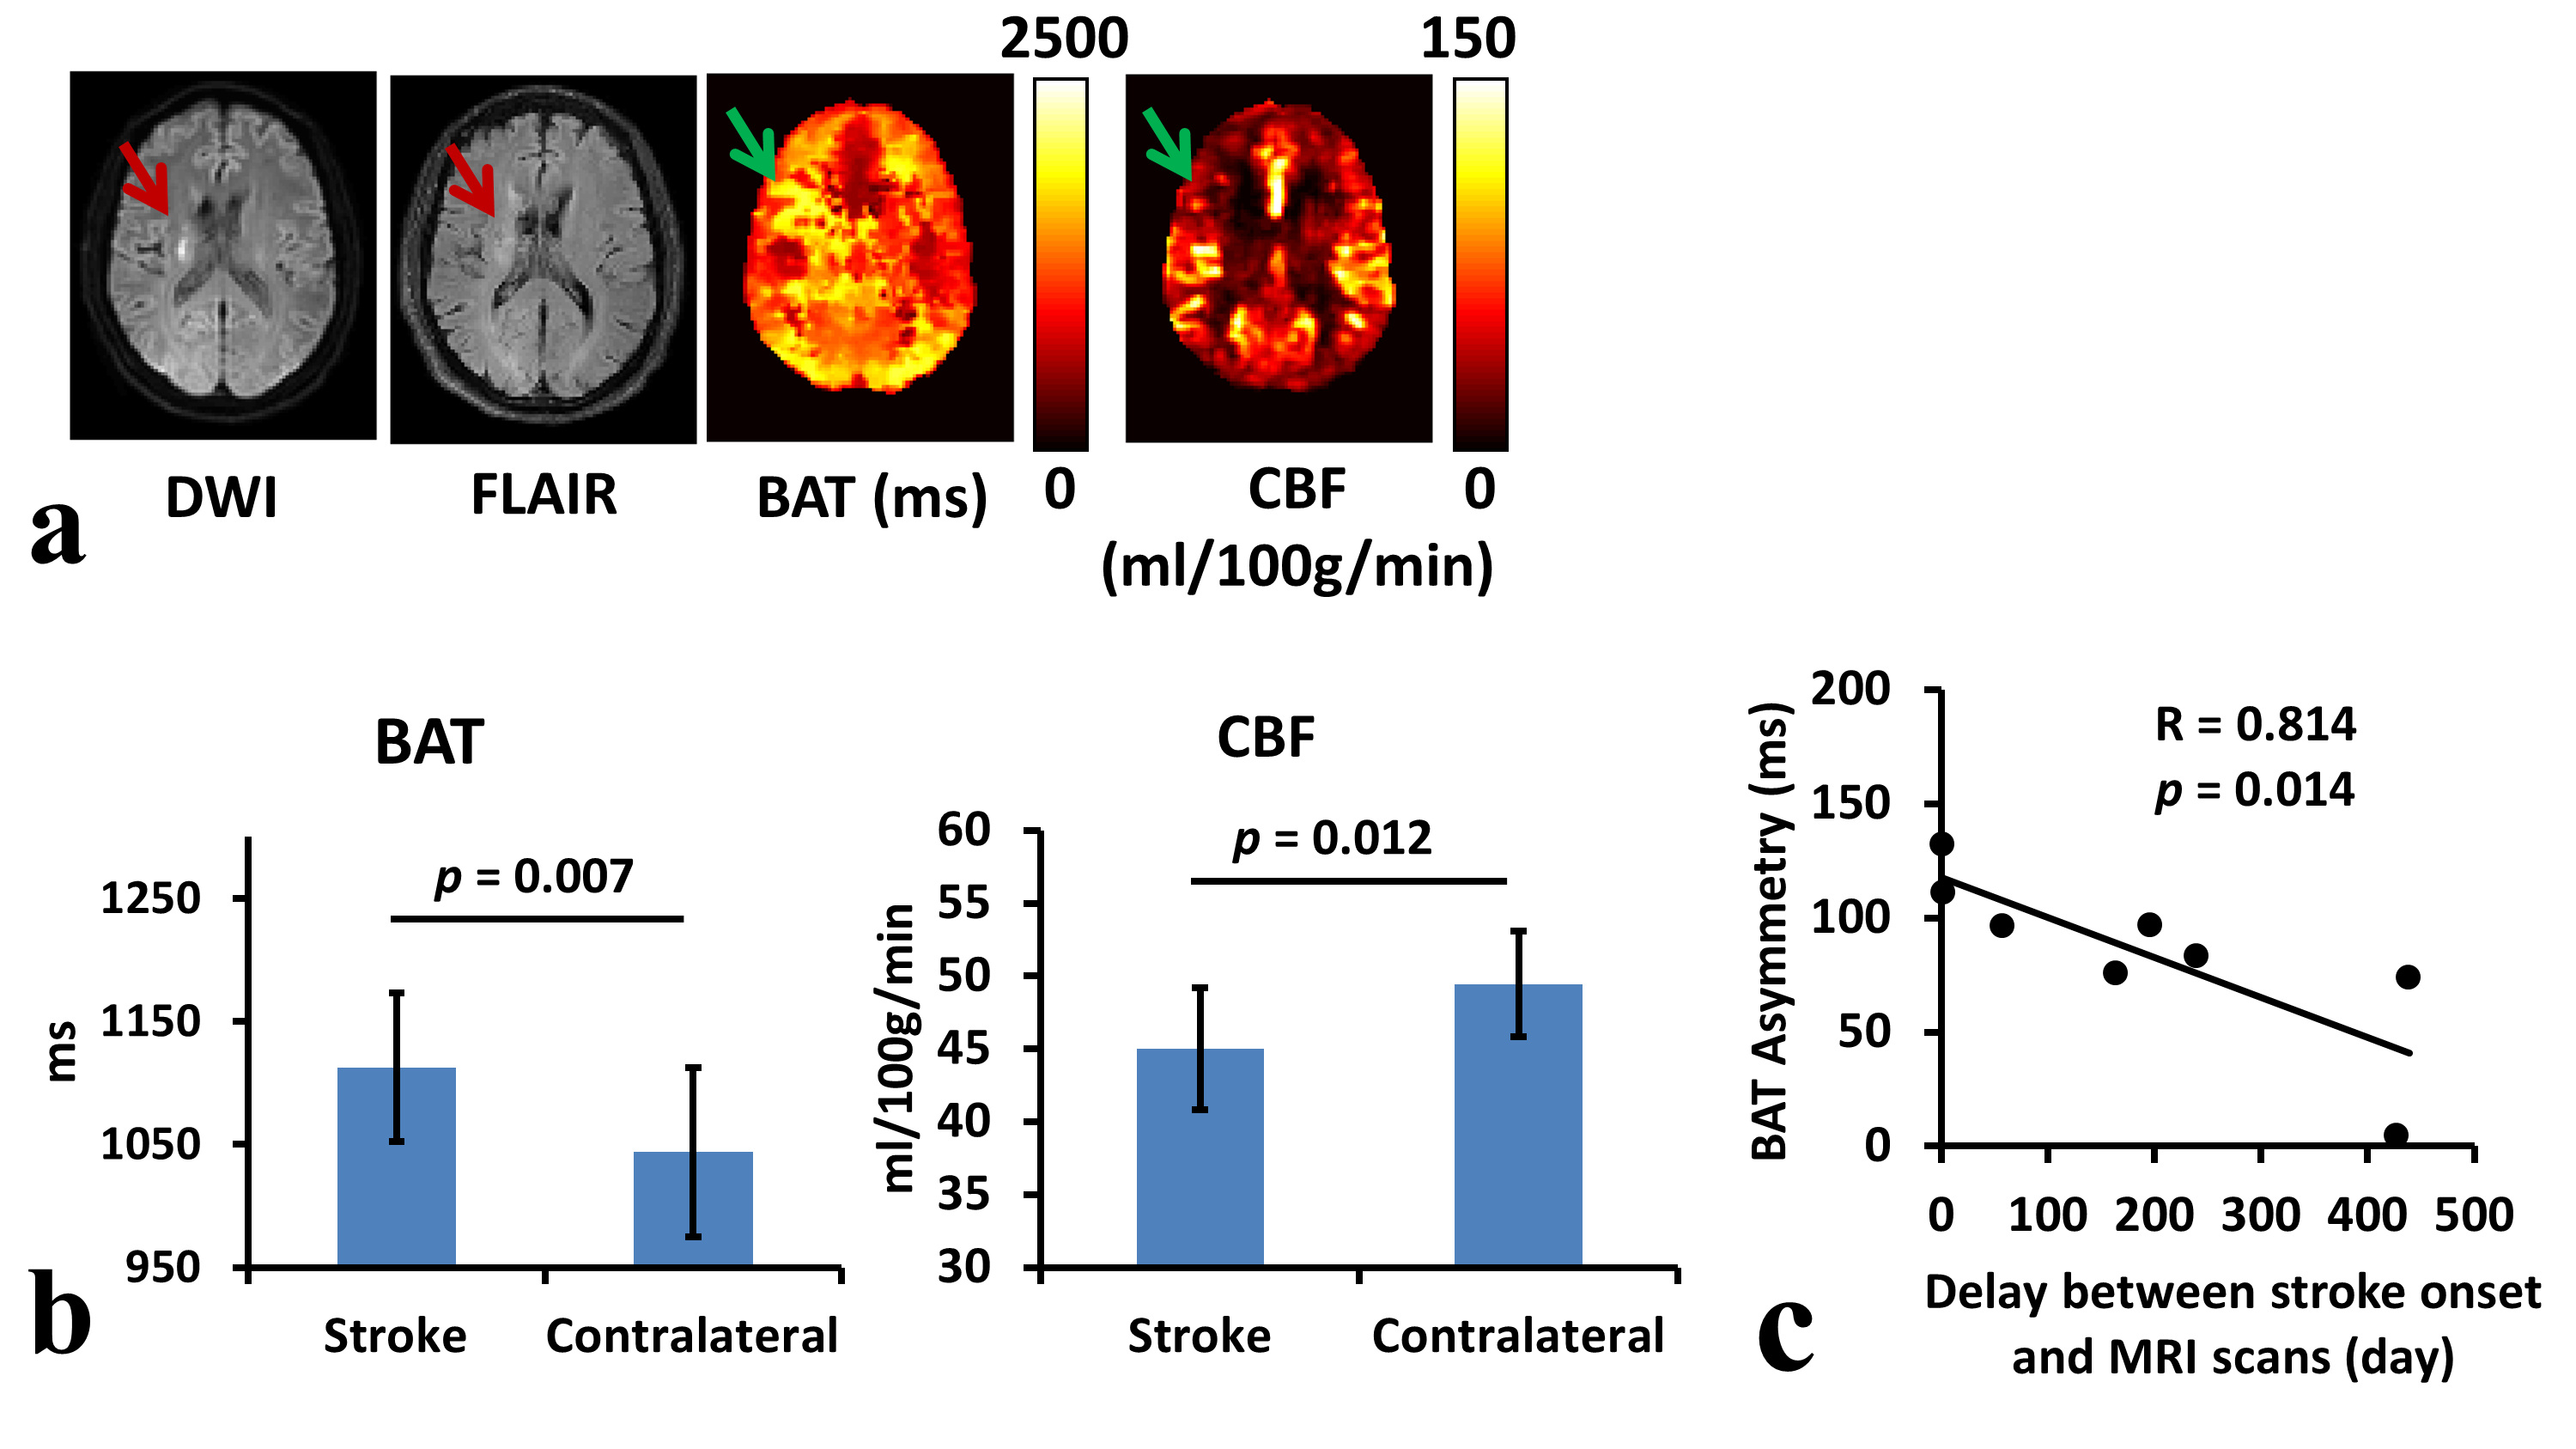
Stroke: Figure 2a shows MRI results of a representative patient who has right-sided ischemic stroke. Both DWI and FLAIR demonstrate infarction in right MCA territory (red arrows). Accordingly, prolonged bolus arrival and mild decreased CBF can be observed in the BAT and CBF maps (green arrows). Figure 2b summarizes BAT and CBF results from all patients (N=9). Stroke perfusion territories revealed a longer BAT (p=0.007) and a lower CBF (p=0.012) compared to the contralateral side. Figure 2c shows that the BAT difference between the stroke and contralateral region was inversely related to the time of MRI scans after stroke onset. This association was not observed when comparing CBF to MRI onset time (p=0.583).
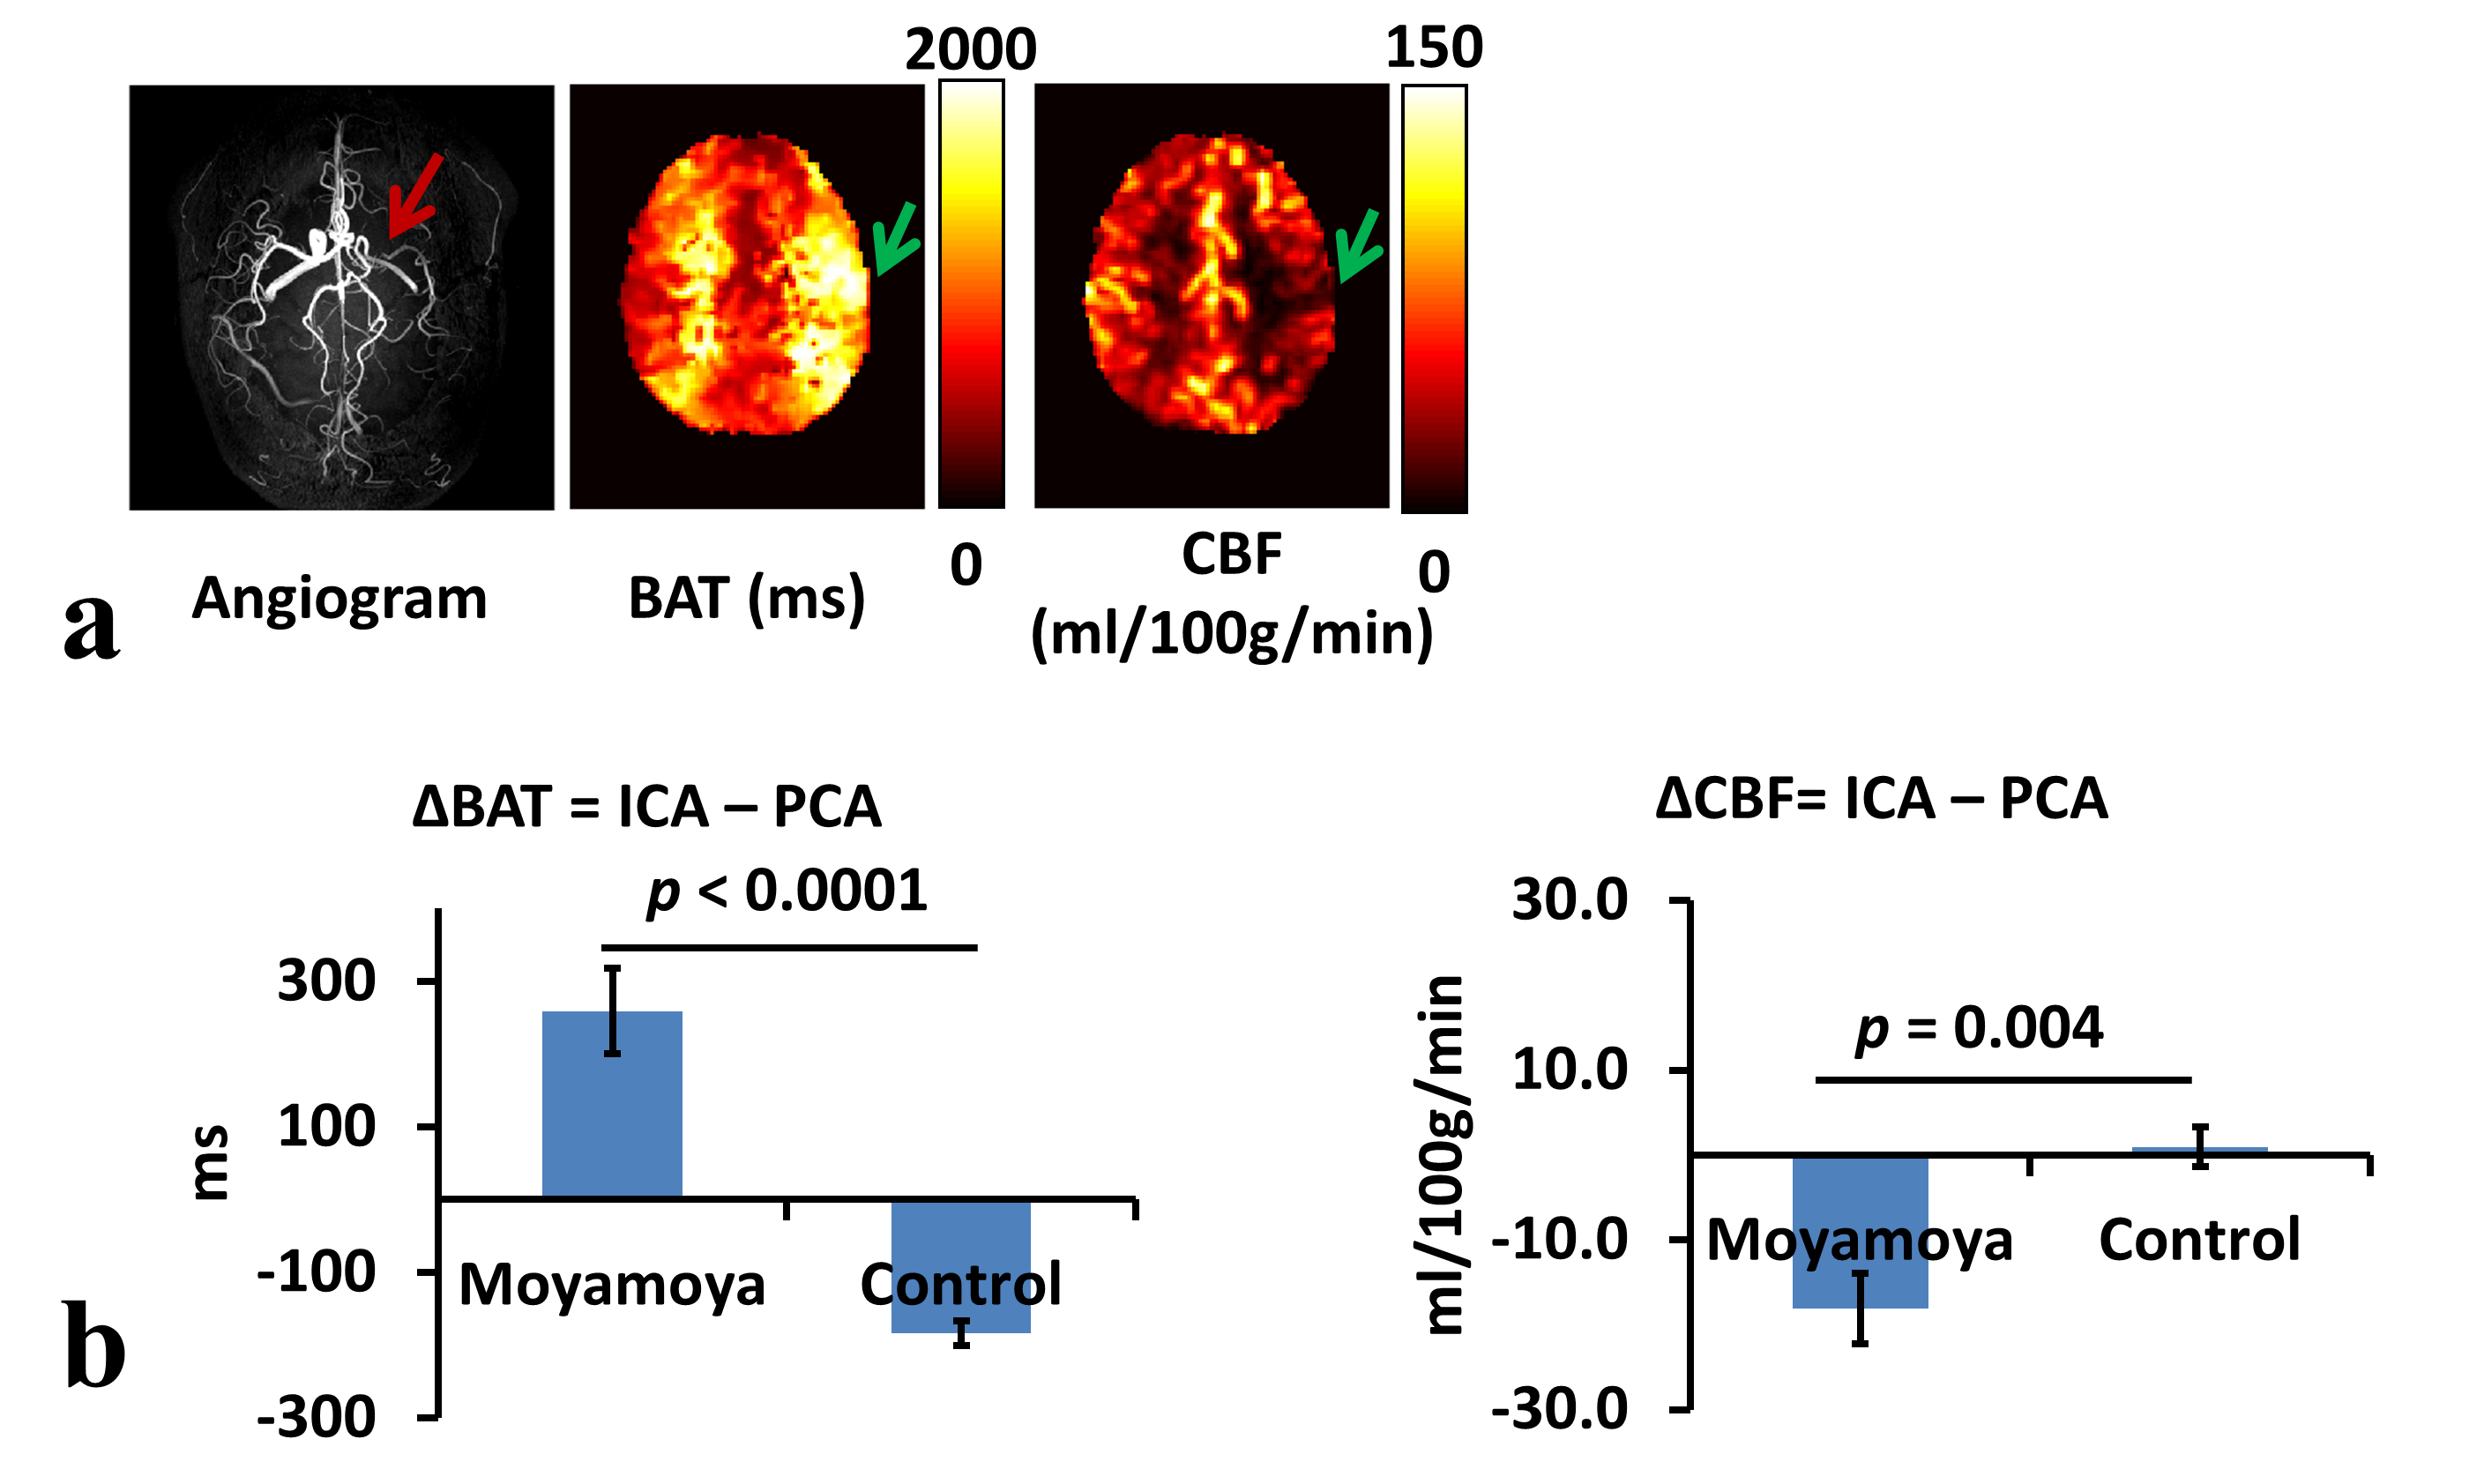
Moyamoya disease: Figure 3a shows MRI images of a representative patient. Left MCA occlusion can be observed on TOF angiography. Accordingly, BAT in the left hemisphere is considerably increased while CBF is reduced. Figure 3b summarizes BAT and CBF of all patients (N=4) relative to that of healthy control subjects (N=5). Note that PCA territories were used as a reference region, as some Moyamoya patients have bilateral stenosis thus a contralateral healthy region is not always available. It was found that ICA BAT of Moyamoya patients was significantly higher (p<0.0001) while CBF was significantly lower (p=0.004) compared to those of healthy subjects.
Conclusion
MRF-ASL is a promising alternative technique in cerebrovascular patients who cannot receive Gd-perfusion MRI. Prolonged bolus arrival and decreased CBF can be reliably detected in both ischemic stroke and Moyamoya disease. BAT appears to have a higher sensitivity than CBF in detecting deficits.Acknowledgements
No acknowledgement found.References
1. Schlaug G, Benfield A, Baird AE, Siewert B, Lovblad KO, Parker RA, Edelman RR, Warach S. The ischemic penumbra: operationally defined by diffusion and perfusion MRI. Neurology 1999; 53: 1528-1537.
2. Kuhn FP, Warnock G, Schweingruber T, Sommerauer M, Buck A, Khan N. Quantitative H2[(15)O]-PET in Pediatric Moyamoya Disease: Evaluating Perfusion before and after Cerebral Revascularization. J Stroke Cerebrovasc Dis 2015; 24: 965-971.
3. Dillman JR, Ellis JH, Cohan RH, Strouse PJ, Jan SC. Frequency and severity of acute allergic-like reactions to gadolinium-containing i.v. contrast media in children and adults. AJR Am J Roentgenol 2007; 189: 1533-1538.
4. Grobner T. Gadolinium--a specific trigger for the development of nephrogenic fibrosing dermopathy and nephrogenic systemic fibrosis? Nephrol Dial Transplant 2006; 21: 1104-1108.
5. Su P, Mao D, Liu P, Li Y, Pinho MC, Welch BG, Lu H. Multiparametric estimation of brain hemodynamics with MR fingerprinting ASL. Magn Reson Med 2017;78:1812-1823.
6. van Laar PJ, Hendrikse J, Golay X, Lu H, van Osch MJ, van der Grond J. In vivo flow territory mapping of major brain feeding arteries. Neuroimage. 2006;29(1):136-44.
Figures