0859
Identifying ischemic zone patterns and origins using multi-delay arterial spin labeling in vasospasm1University of Washington Medical Center, Seattle, WA, United States
Synopsis
Our goal was to evaluate a multi-delay, pseudocontinuous arterial spin labeling (ASL) approach to detect focal delayed cerebral ischemia in patients with vasospasm. We show that inferences on vascular origins based on ASL and standardized perfusion territories correlated well with expert reader reads that rely on an invasive catheter-based digital subtraction angiography (DSA) examination. Importantly, ASL identified possible ischemic zones due to distal vasospasm, which are nearly undetectable on conventional DSA. Thus, use of ASL may prevent unnecessary DSA examinations and improve patient prognosis.
PURPOSE
Cerebral vasospasm (VSP), traditionally defined as vessel narrowing on digital subtraction angiography (DSA), reportedly occurs within the first 2 weeks after hemorrhage in 30-70% of in-hospital patients with aneurysmal subarachnoid hemorrhage (aSAH)1-3. The feared complication of VSP is delayed cerebral ischemia (DCI), which is not reliably assessed by DSA, and may affect prognosis; an estimated 15–36% of aSAH patients suffer from infarction and associated neurological deficits3-5, and death secondary to DCI in 7–23%6,7. An additional 46% of survivors report long-term cognitive impairment affecting functional status and quality of life. Our goal was to evaluate a multi-delay, pseudocontinuous arterial spin labeling (MD-pCASL)8-based screening tool to detect focal DCI regions based on arterial arrival time (AAT) to region-specific brain parenchyma. Further, using standardized perfusion territory boundaries, we provide an automated evaluation of the origin of the VSP and compare it with a neurointerventionalists’ assessment of the DSA images.METHODS
Experiment: Seventeen patients (10F/7M) with clinically suspected VSP after aSAH (based on clinical and/or Transcranial Doppler exam) underwent MD-pCASL MRI and DSA. The pCASL protocol used a 12-channel head-coil on Siemens 3T Tim Trio scanner, background suppression, 3D GRASE readout with: matrix = 64×64×26, spatial resolution = 3×3×6 mm3, TE = 22 ms, TR = 4350 ms, label duration = 1500 ms, post labeling delay = 1500, 2000, 2500, 3000 ms, 12 control/null pairs and a M0 image without magnetization preparation8.
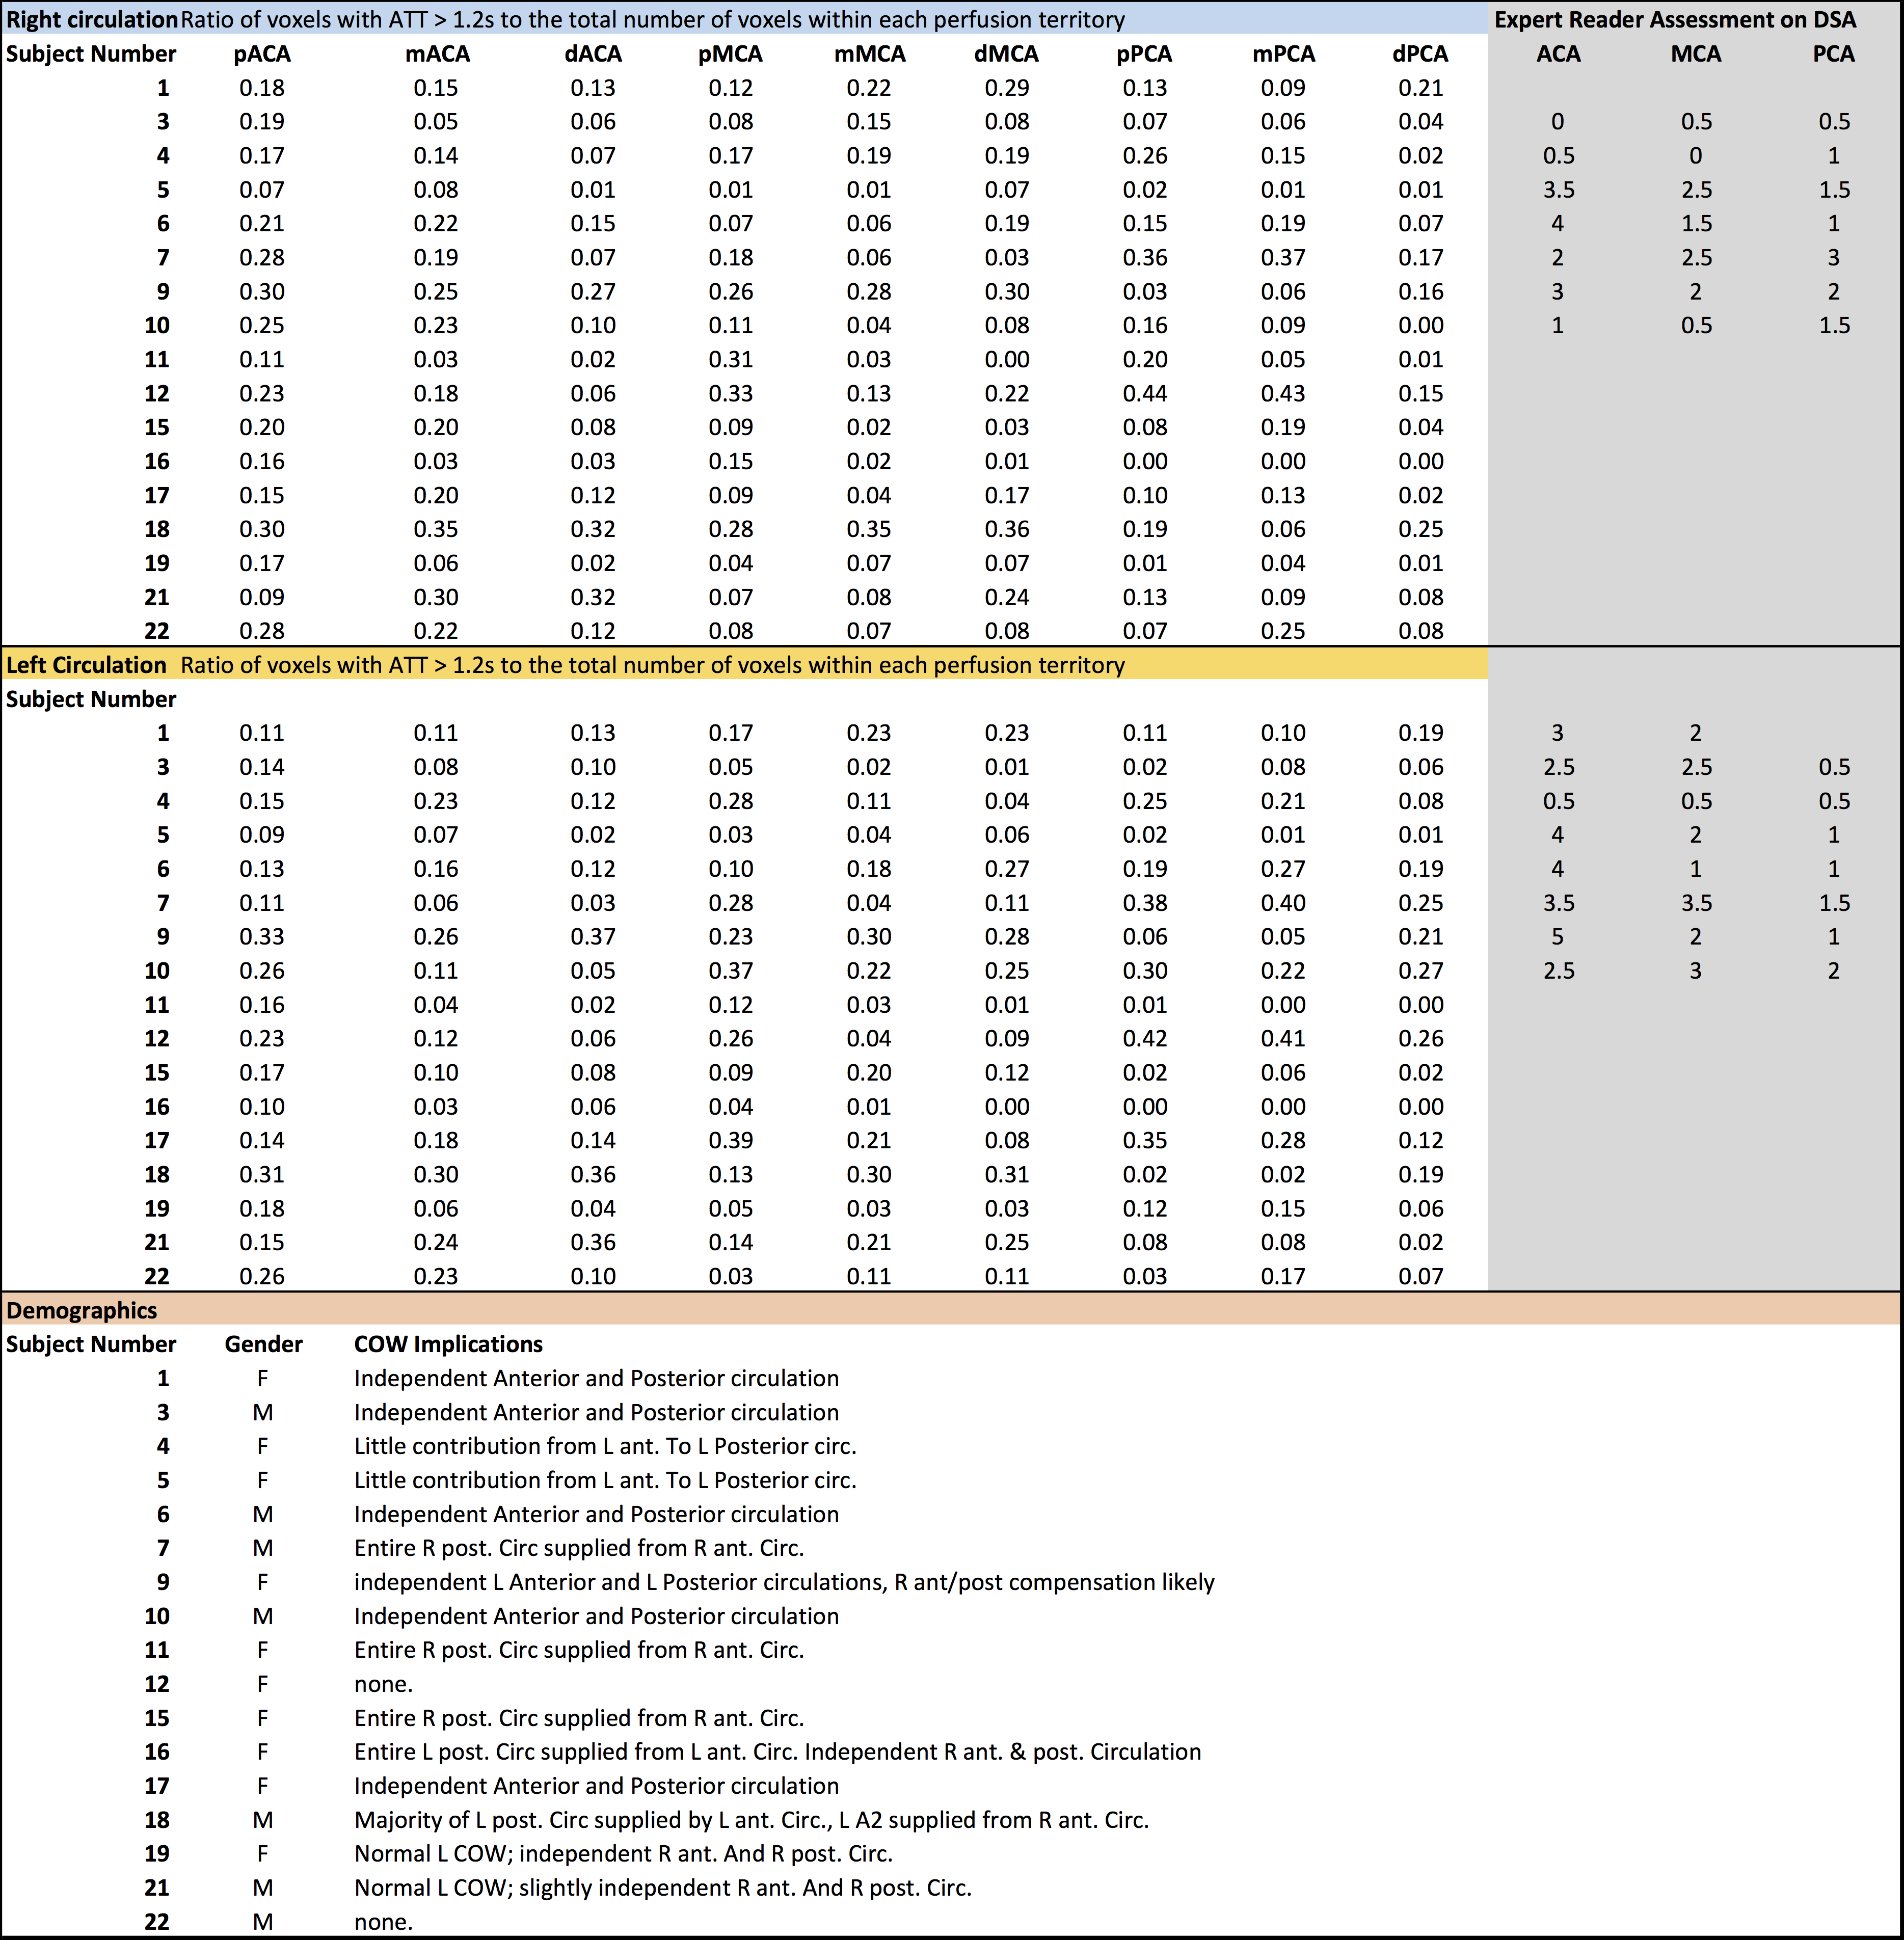
Analysis: All ASL images were motion-corrected and registered to M0 image. Cerebral blood flow (CBF), volume (CBV), and AAT maps were calculated using FSL (oxford_asl). Subsequently the M0 images were registered to MNI space and the transformation was applied to the CBF and AAT maps. The MNI-space lateralized vascular territory atlas, based on work by Tatu et al., and developed by Mutsaerts et al., for proximal, medial, and distal territories of the middle cerebral artery (MCA), anterior cerebral artery (ACA), and posterior cerebral artery (PCA), was applied to the AAT maps9,10. Voxels with AAT >1.2 s (typical AAT ~1 s)11 were considered to be affected by VSP and hence at risk for DCI. Percentage of voxels with AAT >1.2 s within each perfusion territory defined the “ischemic zone size”.
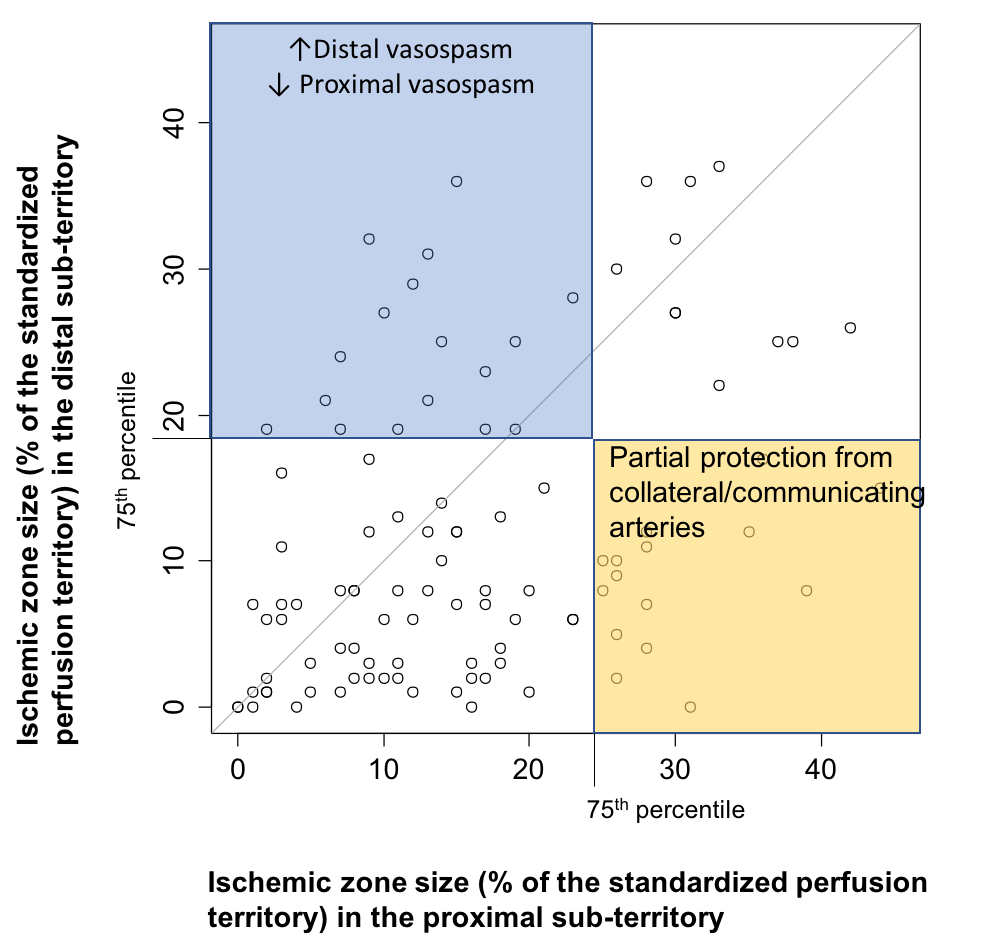
In order to evaluate the relation between proximal and distal VSP, ischemic zone sizes in the proximal and distal perfusion territories were compared. DSA images of 8 random patients were independently reviewed by a blinded, expert neurointerventional reader for the presence, location, and extent of VSP. Ischemic zone sizes identified with ASL were compared with expert reader assessment for these same arteries.
RESULTS
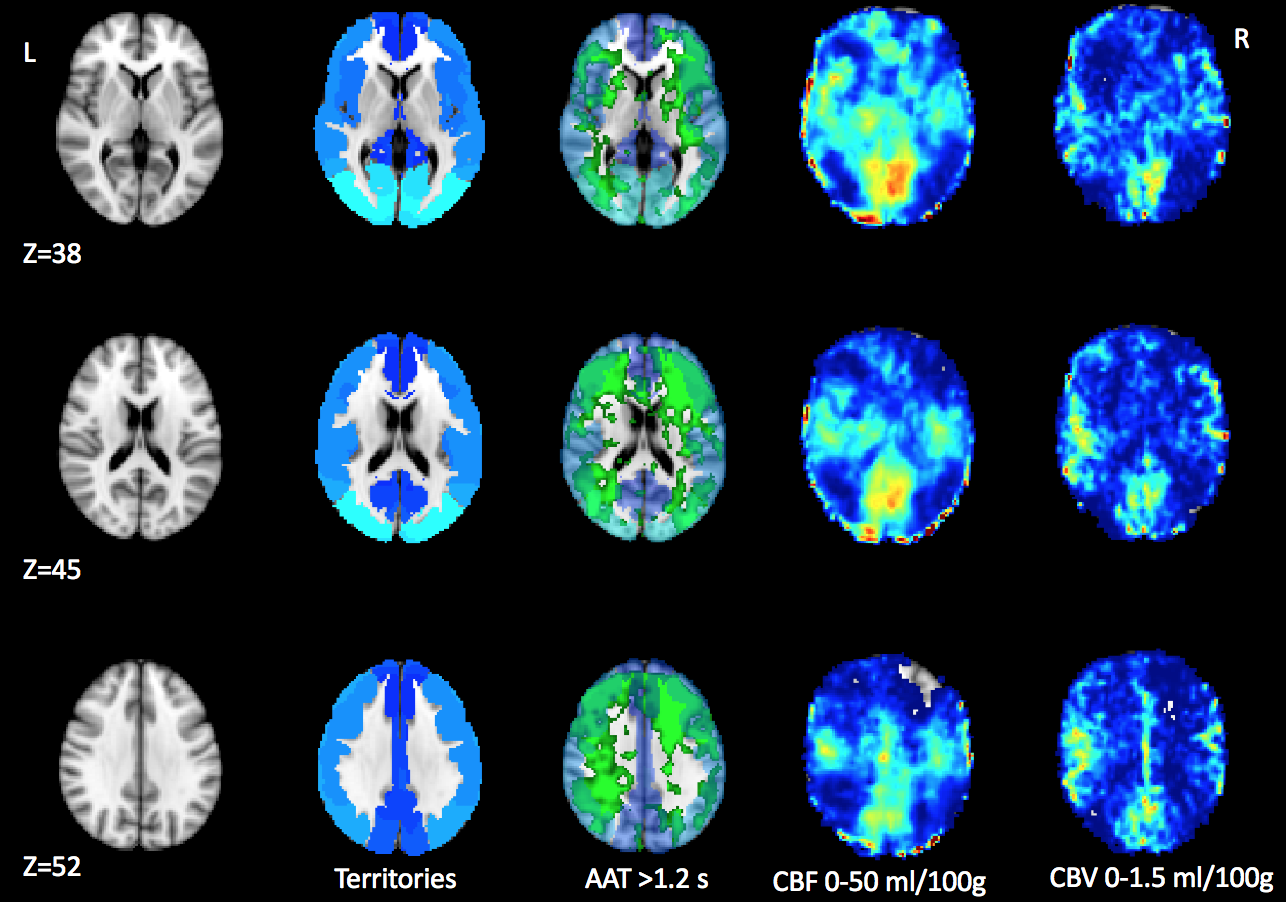
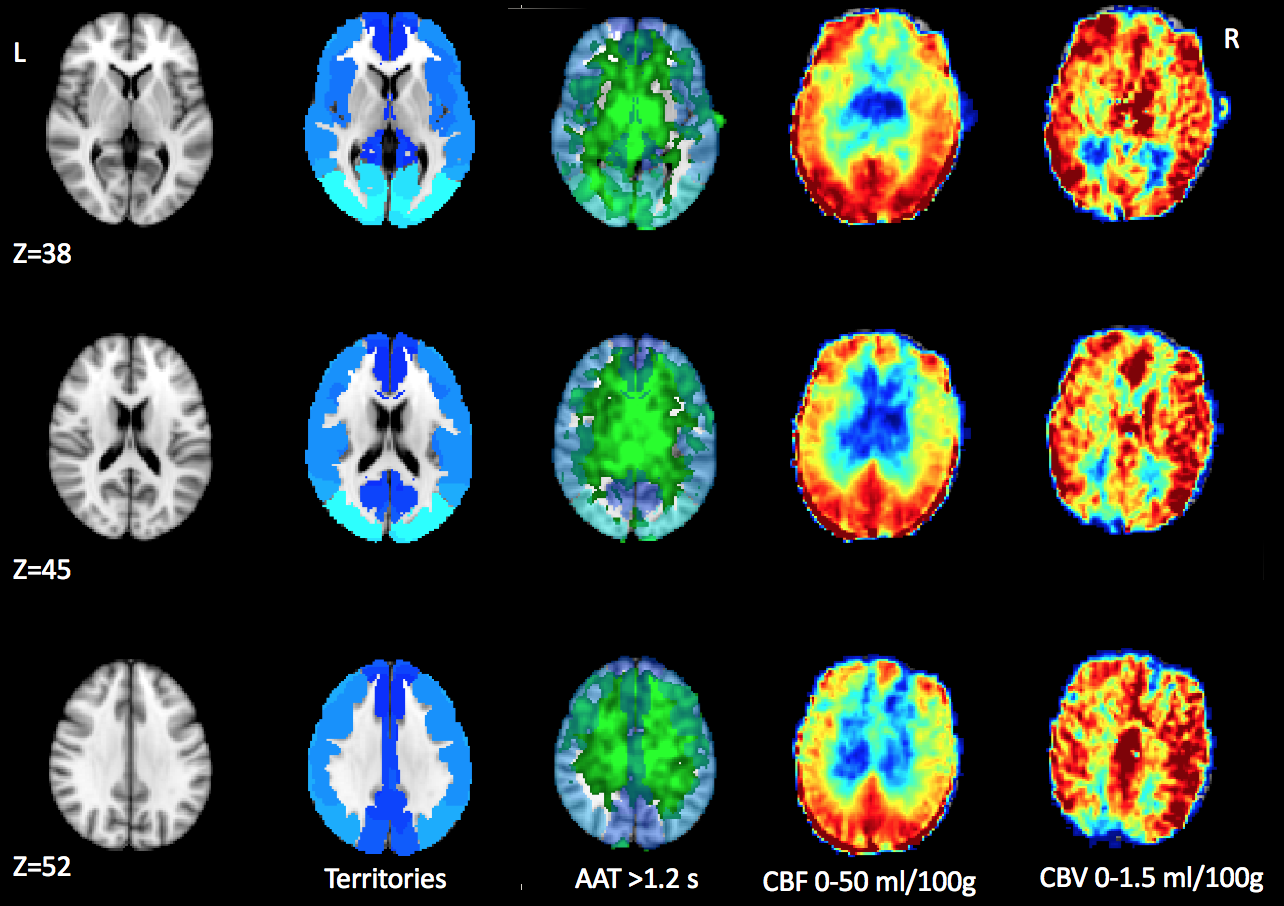
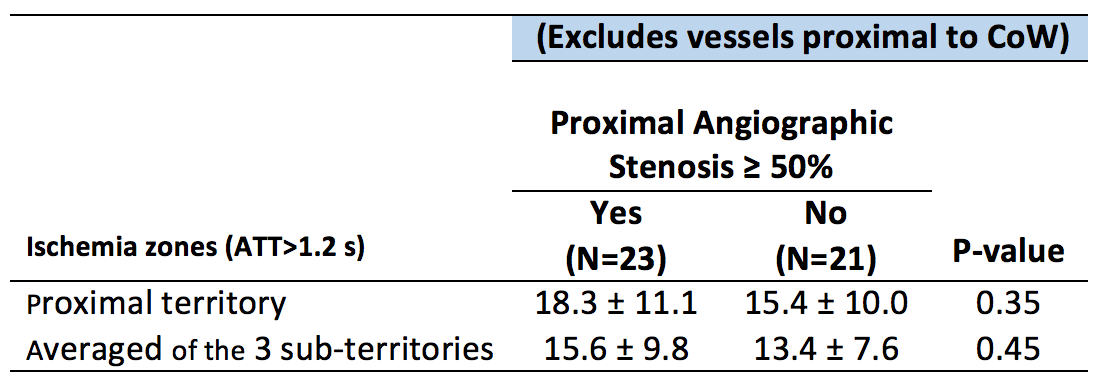
Table 1 shows the ischemic zone sizes due to VSP for all subjects. Figures 1 and 2 show CBF, CBV and AAT maps for 2 individuals, one with VSP in the MCA and PCA and one with VSP in the ACA. The AAT maps clearly identify brain regions with delayed perfusion, suggesting risk of ischemia. Figure 3 shows the relation between the ischemic zone sizes (AAT > 1.2 s) in proximal vs. distal territories of the three main arteries. While statistically significant (p<0.001), there is a weak correlation between proximal and distal VSP-related ischemic zone sizes (r = 0.38). This is expected since, distal VSP in the absence of proximal VSP (blue rectangle) and perfusion recovery from collateral circulation (yellow rectangle) will weaken the correlation. Table 2 depicts the relation between the DSA reader evaluation of proximal arterial branches and the ischemic zone sizes in the proximal perfusion territories of three arteries. Although not statistically significant (n = 8), subjects identified by expert reader with >50% VSP-related stenosis had numerically larger ischemic zone sizes than those with <50% stenosis.DISCUSSION
In this study, we demonstrate that non-invasive ASL provides unique information regarding the location and size of ischemic zone sizes in patients with VSP. Our identification of affected perfusion territories based on ASL correlated well with the expert reader assessment of corresponding DSA exams. Importantly, ASL identified possible distal VSP which is suboptimally detected on conventional DSA. While CBF maps could be used to identify ischemic zones, based on Figure 2, we believe that AAT may be as sensitive in detecting VSP pathology. Evaluation of ischemic zones based on CBF maps and those based on AAT will be compared in the future to quantitatively assess which parameter is more sensitive to VSP pathology.CONCLUSIONS
Perfusion information from MD-pCASL prior to DSA may reduce unnecessary DSA in select patients and modify therapy in others, possibly improving patient triage and management of VSP and DCI.Acknowledgements
No acknowledgement found.References
1. Hijdra A, Van Gijn J, Stefanko S, Van Dongen KJ, Vermeulen M, Van Crevel H. Delayed cerebral ischemia after aneurysmal subarachnoid hemorrhage: clinicoanatomic correlations. Neurology. 1986;36(3):329-333. 2. Roos YB, de Haan RJ, Beenen LF, Groen RJ, Albrecht KW, Vermeulen M. Complications and outcome in patients with aneurysmal subarachnoid haemorrhage: a prospective hospital based cohort study in the Netherlands. J Neurol Neurosurg Psychiatry. 2000;68(3):337-341. 3. Harrod CG, Bendok BR, Batjer HH. Prediction of cerebral vasospasm in patients presenting with aneurysmal subarachnoid hemorrhage: a review. Neurosurgery. 2005;56(4):633-654; discussion 633-654. 4. Biller J, Godersky JC, Adams HP, Jr. Management of aneurysmal subarachnoid hemorrhage. Stroke. 1988;19(10):1300-1305. 5. Aralasmak A, Akyuz M, Ozkaynak C, Sindel T, Tuncer R. CT angiography and perfusion imaging in patients with subarachnoid hemorrhage: correlation of vasospasm to perfusion abnormality. Neuroradiology. 2009;51(2):85-93. 6. Kassell NF, Sasaki T, Colohan AR, Nazar G. Cerebral vasospasm following aneurysmal subarachnoid hemorrhage. Stroke. 1985;16(4):562-572. 7. Solenski NJ, Haley EC, Jr., Kassell NF, et al. Medical complications of aneurysmal subarachnoid hemorrhage: a report of the multicenter, cooperative aneurysm study. Participants of the Multicenter Cooperative Aneurysm Study. Crit Care Med. 1995;23(6):1007-1017. 8. Wang DJ, Alger JR, Qiao JX, et al. Multi-delay multi-parametric arterial spin-labeled perfusion MRI in acute ischemic stroke - Comparison with dynamic susceptibility contrast enhanced perfusion imaging. Neuroimage Clin. 2013;3:1-7. 9. Tatau L, Moulin T, Bogousslavsky, et al., Arterial territories of the human brain: cerebral hemispheres. Neurology 1998;50:1699-1708 10. Mutsaerts HJMM, van Danlen JW, Heijtel DFR, et al., Cerebral perfusion measurements in Elderly with Hypertension using Arterial Spin Labeling. PLoS One. 2015;1-13 11. MacIntosh BJ, Fillipini N, Chappell M, et al., Assessment of arterial arrival times derived from multiple inversion time pulsed arterial spin labeling MRI.MRM, 2010;63:641-647Figures