0858
Relationship between the Degree of Unilateral Intracranial Artery Stenosis and Cerebral Perfusion: a High-resolution Intracranial Vessel Wall Imaging Study1First Clinical College,Tianjin Medical University, Tianjin, China, 2Department of Radiology,Tianjin First Central Hospital, Tianjin, China, 3Siemens Healthcare,MR Collaborations NE Asia, Beijing, China
Synopsis
High-resolution vessel wall imaging(HR-VWI) is an novel technique used to assess intracranial artery stenosis, and it has been useful in clinical practice. In addition, time-to-maximum (Tmax) maps, derived from PWI, are increasingly being used in studies of ischemic stroke, such as EPITHET and DEFUSE-2 . Our study aimed to investigate how the degree of stenosis of the MCA or ICA affects brain tissue perfusion. The results showed that the degree of MCA or ICA stenosis was positively correlated with the Tmax delay volume, and different degrees of ICA or MCA stenosis presented with different perfusion delay volumes.
Background and propose
The degree of stenosis of the intracranial arteries can affect the perfusion state of brain tissue. High-resolution vessel wall imaging(HR-VWI) is an novel technique used to assess intracranial artery stenosis, and it has been useful in clinical practice. Previous studies have proposed that the time-to-maximum (Tmax) delay obtained from dynamic susceptibility contrast MR exams (DSC-MR) can quantitatively reflect the perfusion state of cerebral tissue 1-2. The purpose of this study was to investigate the correlation between the degree of intracranial artery (internal carotid artery and middle cerebral artery) stenosis and the Tmax delay volume and to compare perfusion patterns of mild stenosis (< 50%), moderate stenosis (> 50%, < 70%), and severe stenosis (≥ 70%).Materials and Methods
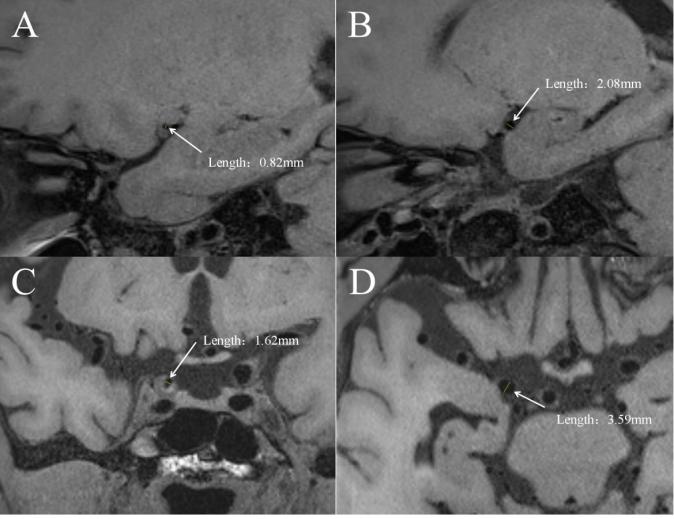
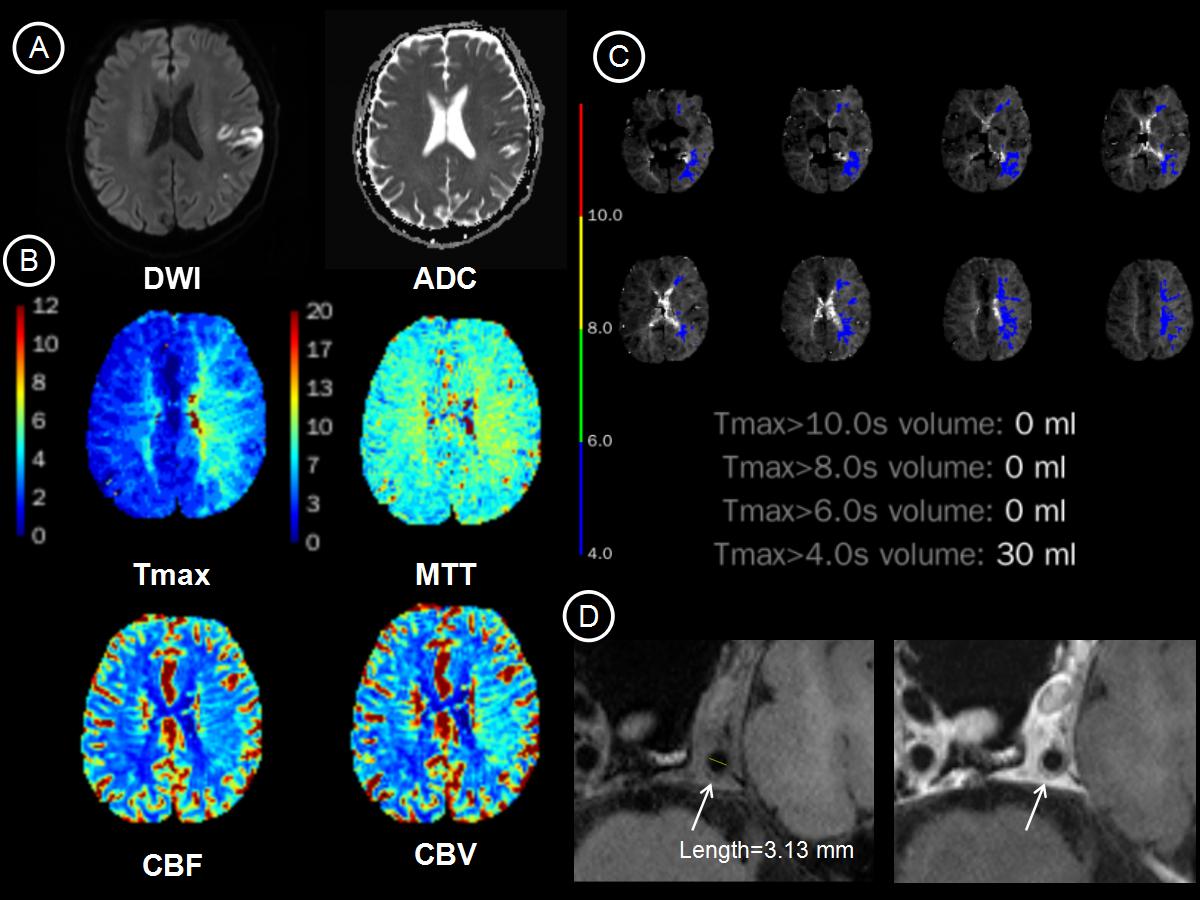
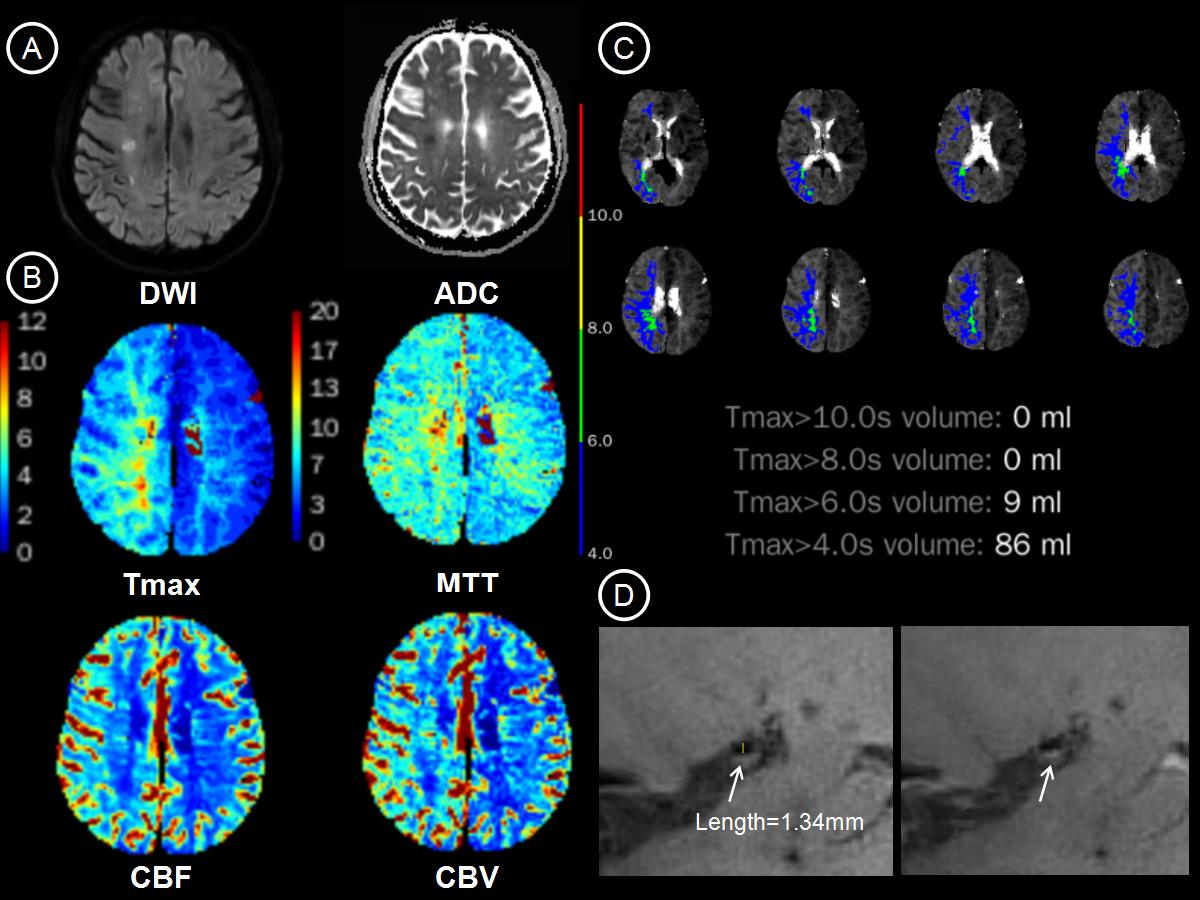
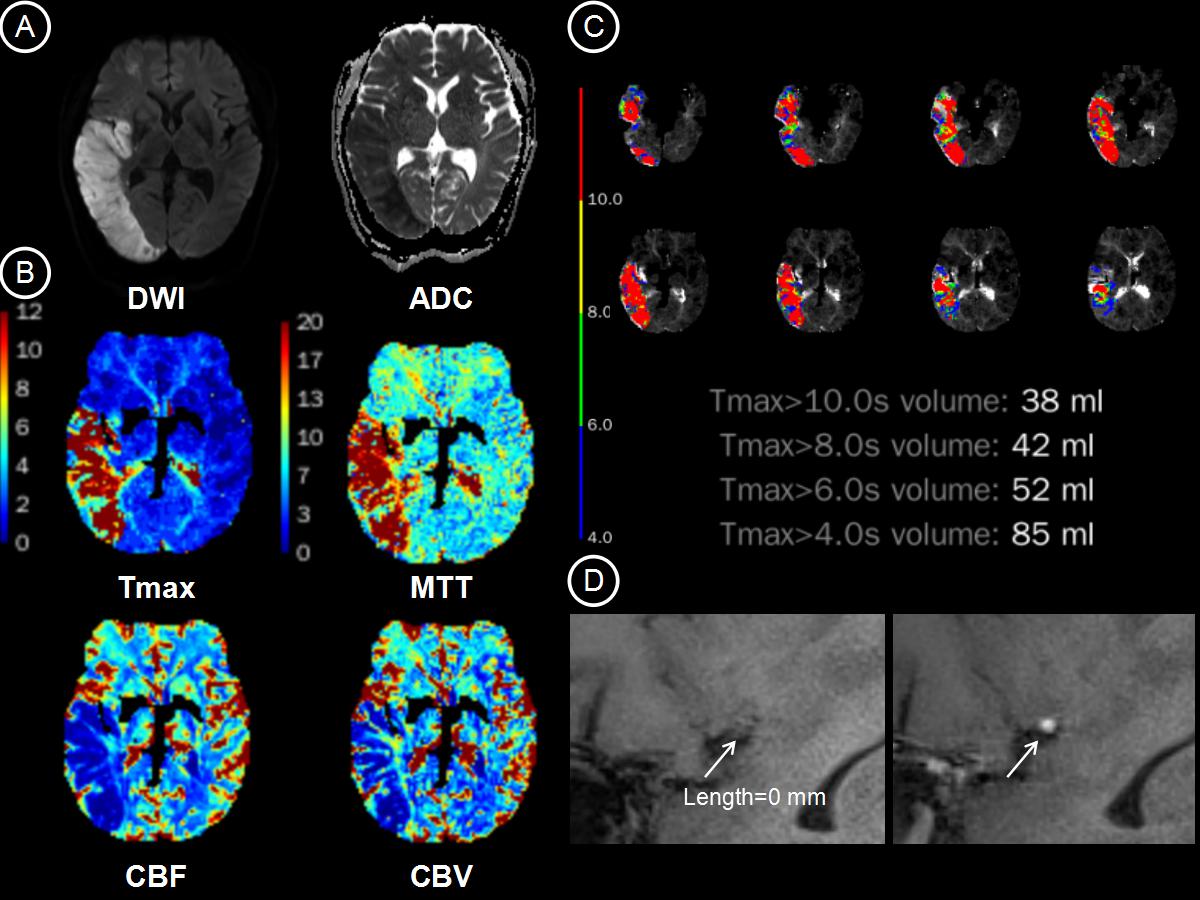
Forty-five patients (27 males; age, 58.2 ± 12.8 years) with stenosis in the unilateral internal carotid artery or middle cerebral artery, were enrolled in this study. MRI data were collected on a 3T MAGNETOM Trio a Tim System (Siemens Healthcare, Erlangen, Germany), including routine head scan, high-resolution T1-SPACE, and DSC-MR exam. The parameters of the high-resolution T1-SPACE images were as follows: TR/TE=900/14 ms; field of view = 210 × 78.1 mm2; matrix size = 384 × 300; and slice thickness = 0.55 mm. The HR-T1-SPACE images were acquired before and after contrast agent injection. The parameters of DSC-MR acquisition were as follows: TR/TE = 2210/32 ms; field of view = 230 × 100 mm2; matrix size = 128 × 128; and slice thickness = 3.0 mm. The severity of the stenotic lesions of the ICA and MCA was measured in the high-resolution T1-SPACE, according to the Warfarin-Aspirin Symptomatic Intracranial Disease (WASID) method 3. The percentage of stenosis was calculated as follows: degree of stenosis = [(1-(Dstenosis/Dnormal)] ×100, where Dstenosis is the diameter of the artery where the most severe stenosis can be visualized, and Dnormal is the diameter of the normal proximal artery. Different degrees of stenosis were defined based on different stenosis percentages: mild stenosis (< 50%), moderate stenosis (> 50%, < 70%), and severe stenosis (≥ 70%). The Tmax delay volume was acquired using the RApid processing of PerfusIon and Diffusion (RAPID) 4 software(Stanford University, USA). The relationship between the Tmax delay volume and degree of stenosis was calculated with Spearman’s correlation. The Kruskal-Wallis H test was applied to analyze the difference in perfusion patterns across different degrees of stenosis.Results
The results showed that there were ten patients with mild stenosis (< 50%), fourteen with moderate stenosis (> 50 %, < 70%), and nineteen with severe stenosis or occlusion (≥ 70%). The degree of stenosis of all the subjects was positively correlated with the volume of Tmax > 4.0 s (r = 0.536, p < 0.001), Tmax > 6.0 s (r = 0.565, p < 0.001), Tmax > 8.0 s (r = 0.444, p = 0.003), Tmax > 10 s (r = 0.335, p = 0.028), and the Tmax-ADC mismatch volume (r = 0.404, p = 0.007). In the ICA group, the degree of stenosis was correlated with a volume of Tmax > 4.0 s (r = 0.508, p = 0.026), Tmax > 6.0 s (r = 0.602, p = 0.006), Tmax > 8.0 s (r = 0.617, p = 0.005), and the Tmax-ADC mismatch volume (r = 0.647, p = 0.003). In the MCA group, the degree of stenosis was associated with a volume of Tmax > 4.0 s (r = 0.553, p = 0.003) and Tmax > 6.0 s (r = 0.554, p = 0.003). The perfusion delay volumes of Tmax > 6.0 s were considered to be optimal thresholds: mild stenosis = 0 ml, moderate stenosis = 1.33 ± 3.14 ml, and severe stenosis = 13.95 ± 20.07 ml. A significant difference was found in all the degrees of stenosis with both a Tmax > 6.0 s volume (H = 11.171, p = 0.004) and Tmax-ADC mismatch volume (H = 6.267, p = 0.044).Discussion and conclusion
Our results indicate that the degree of ICA and MCA stenosis measured in HR-VWI is positively correlated with the perfusion deficit pattern Tmax delay maps. The volumes measured under different thresholds, particularly the volume of Tmax > 6.0 s, were all correlated with the status of stenosis. Further, different degrees of ICA or MCA stenosis had different perfusion delay volumes. This study indicates that the degree of stenosis of the middle cerebral artery (MCA) or internal carotid artery (ICA) can affect on brain tissue perfusion.Acknowledgements
No acknowledgement found.References
1. Lansberg MG, Straka M, Kemp S, Mlynash M, Wechsler LR, Jovin TG, Wilder MJ, Lutsep HL, Czartoski TJ, Bernstein RA, Chang CW, Warach S, Fazekas F, Inoue M, Tipirneni A, Hamilton SA, Zaharchuk G, Marks MP, Bammer R, Albers GW; DEFUSE 2 study investigators. MRI profile and response to endovascular reperfusion after stroke (DEFUSE 2): a prospective cohort study. Lancet Neurol. 2012 Oct;11(10):860-7.
2. Wheeler HM, Mlynash M, Inoue M, Tipirneni A, Liggins J, Zaharchuk G, Straka M, Kemp S, Bammer R, Lansberg MG, Albers GW; DEFUSE 2 Investigators. Early diffusion-weighted imaging and perfusion-weighted imaging lesion volumes forecast final infarct size in DEFUSE 2. Stroke. 2013 Mar;44(3):681-5.
3. Samuels, O.B., et al., A standardized method for measuring intracranial arterial stenosis. AJNR Am J Neuroradiol, 2000. 21(4): p. 643-6.
4. Straka M, Albers GW, Bammer R. Real-time diffusion-perfusion mismatch analysis in acute stroke. J Magn Reson Imaging. 2010 Nov;32(5):1024-37.
Figures