0857
Noninvasive MRI measurements of oxygen extraction fraction reduction in response to blood transfusion in adults with sickle cell anemia1Radiology and Radiological Sciences, Vanderbilt University Medical Center, Nashville, TN, United States, 2Pediatrics - Division of Pediatric Neurology, Vanderbilt University Medical Center, Nashville, TN, United States
Synopsis
Blood transfusions are often administered for secondary stroke prevention in adults with sickle cell anemia (SCA). We utilized noninvasive MRI methods to evaluate how oxygen extraction fraction (OEF) and cerebral blood flow (CBF) adjust after transfusion in adults with SCA. OEF reduced on average, while CBF did not change significantly. The OEF reduction paralleled increases in hematocrit but was unrelated to the reduction in hemoglobin-S. This implies that most patients receiving transfusions operate near autoregulatory reserve capacity even after transfusion, and improving oxygen delivery by increasing hematocrit can be visualized noninvasively with OEF-MRI.
Introduction
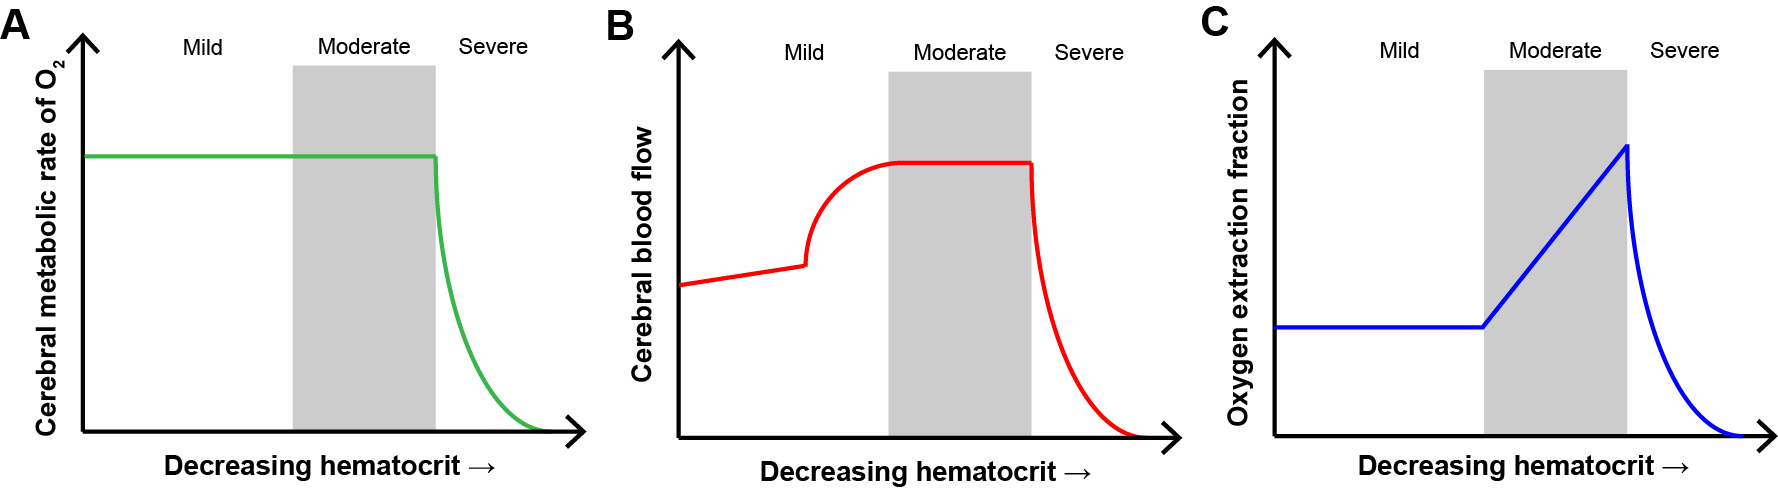
Sickle cell anemia (SCA) is a genetically-inherited disorder that results in the production of erythrocytes with hemoglobin-S (HbS)1, resulting in anemia2 and elevated risk of vasculopathy, silent cerebral infarction, and stroke3, 4. Unlike in children with SCA, no standard exists for stratifying adults with SCA to aggressive therapies, such as blood transfusions, for primary stroke prevention; instead, transfusions are often administered for secondary stroke prevention. Brain tissue oxygen extraction fraction (OEF) and cerebral blood flow (CBF) have been identified as potential markers of impairment in SCA. While PET methods for assessing these markers exist, they are not utilized for longitudinal monitoring due to technical challenges and the need for ionizing radiation. The purpose of this study was to utilize noninvasive T2-relaxation-under-spin-tagging (TRUST) MRI5, 6 and phase contrast MR to evaluate hemo-metabolic response to transfusion. We hypothesized that improving oxygen delivery through transfusion manifests as a reduction in OEF with moderate or negligible change in CBF, owing to SCA patients operating near autoregulatory reserve capacity (Figure 1).Methods
Study participants. Adults with SCA genotype hemoglobin SS or S-β0 thalassemia (n=17; age=25.8±6.7 years) receiving simple or modified-exchange transfusions and healthy controls without sickle trait (n=7; age=26.1±6.2 years) were scanned at 3.0T (Philips) at two time points. For SCA participants, this included one scan late in their transfusion cycle when blood hematocrit was near nadir and a second scan within 7 days of transfusion. All volunteers provided informed written consent.
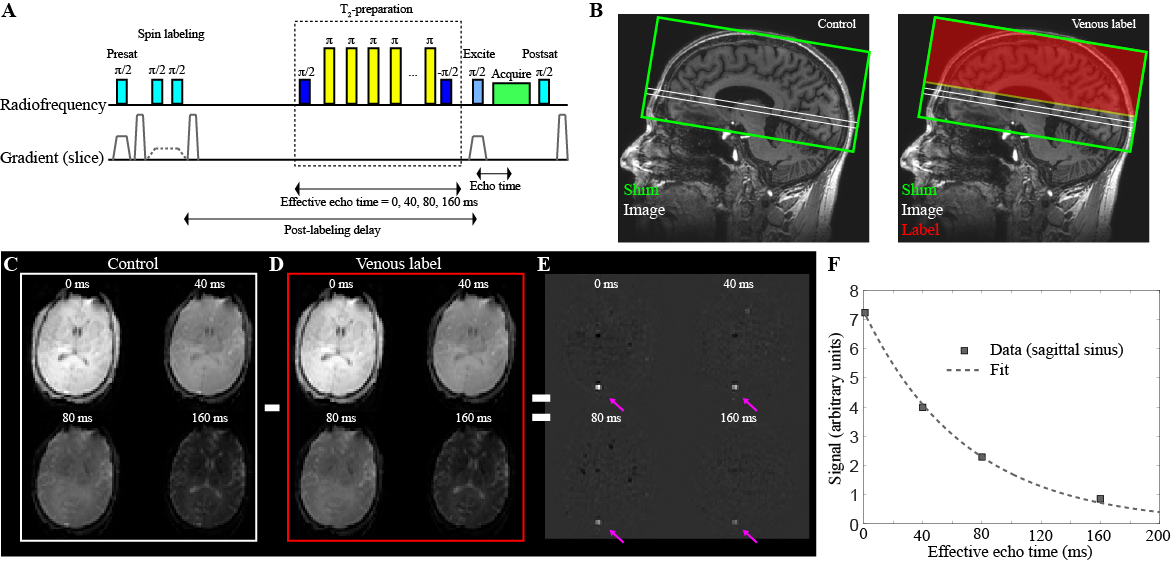
Experiment. T1-weighted imaging (MPRAGE; TR/TE=8.2/3.7ms; spatial resolution=1.0x1.0x1.0mm3), TRUST-MRI (repeats per session=2; TR/TE=1978/3.6 ms; spatial resolution=3.4x3.4x5 mm3; tCPMG=10ms; eTE=0, 40, 80, and 160ms)6, 7, and phase contrast MRA (spatial resolution=0.5x0.5 mm2; TR/TE = 20/7 ms; with velocity-encoding gradient=40 cm/s) were acquired for tissue volume, OEF, and CBF determination, respectively. Arterial oxygen saturation (Ya) was measured using peripheral pulse oximetry, and blood hematocrit and HbS% were measured through venipuncture on the day of imaging. Phase contrast data were acquired for each of the four primary vessels supplying the brain: left internal carotid artery (ICA), right ICA, left vertebral, and right vertebral
Analysis. T1-weighted images were segmented to quantify total tissue volume. Venous oxygenation (Yv) values in the superior sagittal sinus were quantified from TRUST MRI data as previously described5. Yv was then used, along with Ya, to compute OEF as (Ya-Yv)/Ya. Whole-brain CBF values were quantified from phase contrast data as the total blood flow to the brain (summation of the mean velocity in each vessel multiplied by the vessel area) normalized to the total tissue volume (gray and white matter). Nonparametric testing was applied to determine differences in study measurements (two-sided significance level=0.05).
Results
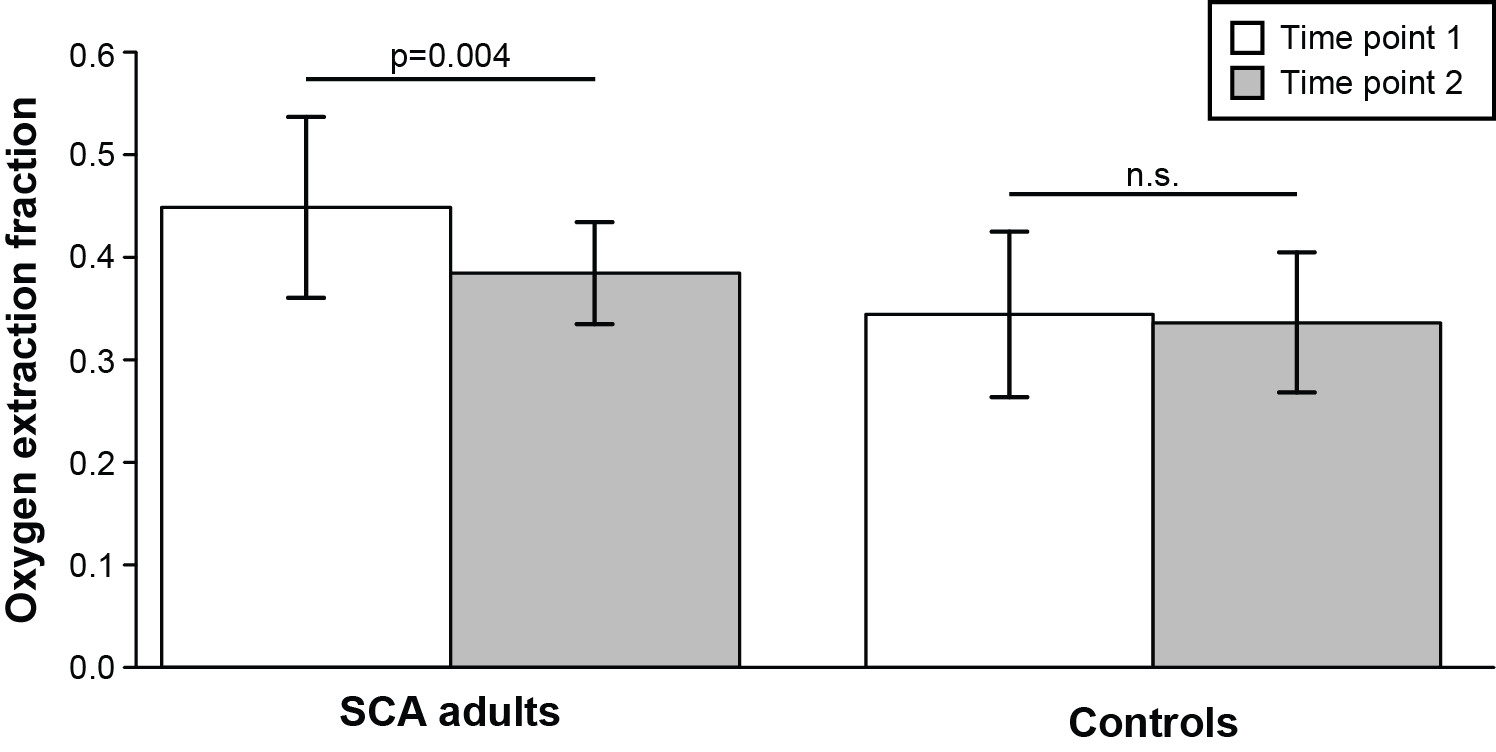
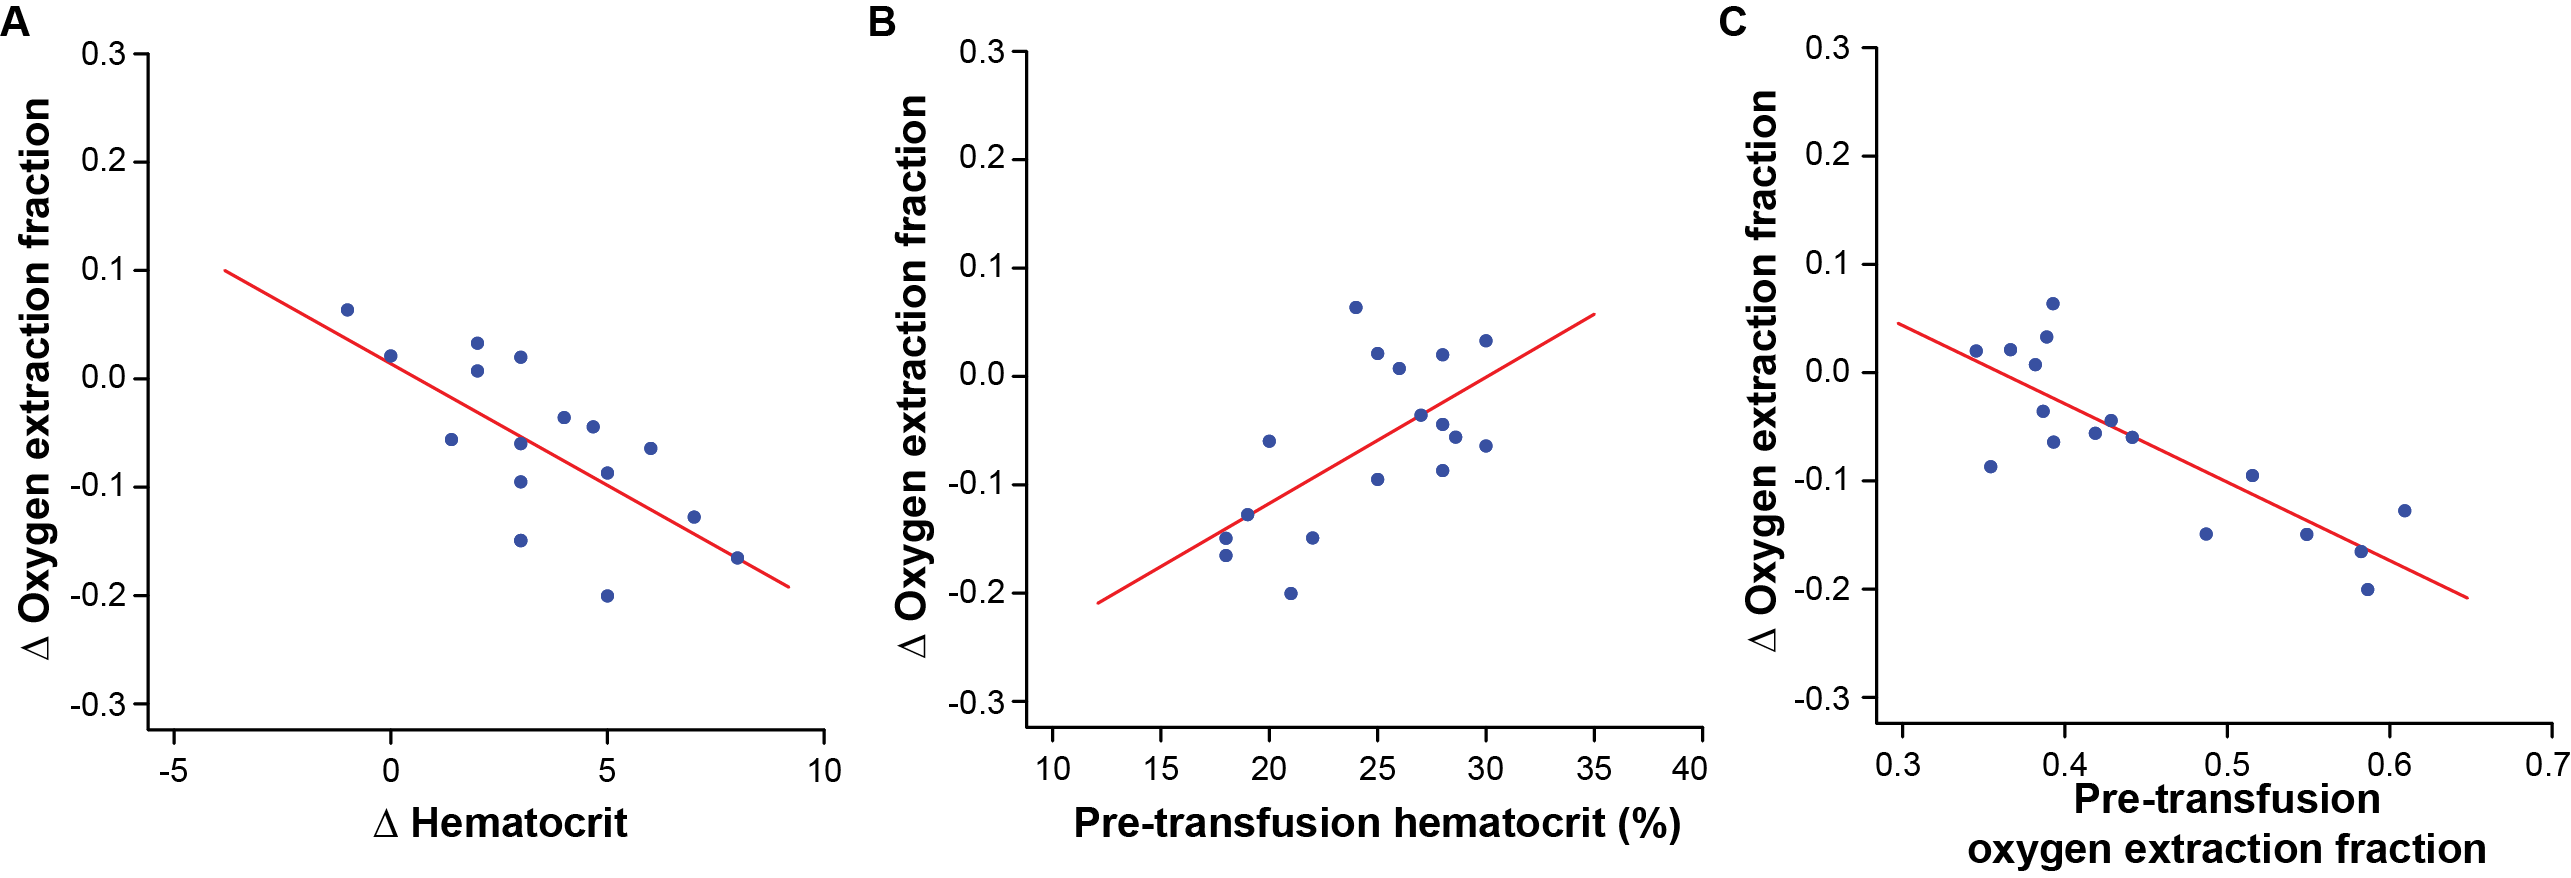
In participants receiving simple transfusions (n=8), pre-transfusion hematocrit / HbS=20.9±2.6% / 49.8±26.3% and post-transfusion hematocrit / HbS=24.8±2.3% / 37.5±14.2%. In participants receiving modified-exchange transfusions (n=9), pre-transfusion hematocrit/HbS=27.8±1.7% / 42.1±11.4% and post-transfusion hematocrit / HbS=31.0±3.1% / 26.9±15.8%. OEF values from within each scan session were significantly (p<0.001) and highly (Spearman’s-rho=0.98) correlated. Post-transfusion OEF=0.38±0.05 was significantly (p=0.004) lower than pre-transfusion OEF=0.45±0.09, while OEF measurements in controls were not different between the two scans (Figure 3). These changes in OEF were significantly correlated with transfusion-induced changes in blood hematocrit (p=0.002; rho=-0.69), with pre-transfusion hematocrit (p=0.02; rho=0.54), and with pre-transfusion OEF (p<0.001; rho=-0.76) (Figure 4). Finally, changes in OEF following transfusion were significantly (p=0.02) greater in those receiving simple transfusions (n=8) versus those receiving modified exchange transfusions (n=9) (Figure 5). In contrast, there were no significant differences between pre-transfusion CBF=86.5±29.4 ml/100g/min and post-transfusion CBF=82.1±24.5 ml/100g/min (p=0.28); no CBF differences were observed in those receiving simple versus modified-exchange transfusions (p=0.96).Discussion
OEF and CBF are potential imaging markers for stratifying adults with SCA to blood transfusion therapy7. While the effects of transfusions on cardiac and pulmonary systems have been studied8, 9, cerebral metabolic markers are less-well characterized. We utilized noninvasive MR methods to show that OEF reduces following transfusion in a hematocrit-dependent manner and is associated with pre-transfusion hematocrit and pre-transfusion OEF, while CBF does not change significantly on average with transfusions. This implies that these patients may have maximized their autoregulatory capacity, which has been shown in some children with SCA10, and that increases in cerebral oxygen availability are achieved through increases in OEF. Future work may utilize OEF as one biomarker to triage high-risk patients for aggressive therapies, such as surgical revascularization or stem cell transplant.Conclusion
Cerebral OEF significantly reduces following blood transfusion in adults with SCA, while CBF is unaffected on average by transfusion in the same patients.Acknowledgements
No acknowledgement found.References
1. Kassim AA, DeBaun MR. Sickle cell disease, vasculopathy, and therapeutics. Annu Rev Med. 2013;64:451-466
2. Seakins M, Gibbs WN, Milner PF, Bertles JF. Erythrocyte hb-s concentration. An important factor in the low oxygen affinity of blood in sickle cell anemia. J Clin Invest. 1973;52:422-432
3. Arkuszewski M, Krejza J, Chen R, Melhem ER. Sickle cell anemia: Reference values of cerebral blood flow determined by continuous arterial spin labeling mri. Neuroradiol J. 2013;26:191-200
4. Debaun MR, Derdeyn CP, McKinstry RC, 3rd. Etiology of strokes in children with sickle cell anemia. Ment Retard Dev Disabil Res Rev. 2006;12:192-199
5. Lu H, Ge Y. Quantitative evaluation of oxygenation in venous vessels using t2-relaxation-under-spin-tagging mri. Magn Reson Med. 2008;60:357-363
6. Lu H, Xu F, Grgac K, Liu P, Qin Q, van Zijl P. Calibration and validation of trust mri for the estimation of cerebral blood oxygenation. Magn Reson Med. 2012;67:42-49
7. Jordan LC, Gindville MC, Scott AO, Juttukonda MR, Strother MK, Kassim AA, et al. Non-invasive imaging of oxygen extraction fraction in adults with sickle cell anaemia. Brain. 2016;139:738-750
8. Detterich JA, Kato RM, Rabai M, Meiselman HJ, Coates TD, Wood JC. Chronic transfusion therapy improves but does not normalize systemic and pulmonary vasculopathy in sickle cell disease. Blood. 2015;126:703-710
9. Detterich JA, Sangkatumvong S, Kato R, Dongelyan A, Bush A, Khoo M, et al. Patients with sickle cell anemia on simple chronic transfusion protocol show sex differences for hemodynamic and hematologic responses to transfusion. Transfusion. 2013;53:1059-106
10. Kosinski PD, Croal PL, Leung J, Williams S, Odame I, Hare GM, et al. The severity of anaemia depletes cerebrovascular dilatory reserve in children with sickle cell disease: A quantitative magnetic resonance imaging study. Br J Haematol. 2017;176:280-287
Figures