0856
Adaptations in cerebral physiology due to chronic anaemia measured with Turbo-QUASAR ASL1Radiology & Nuclear Medicine, Academic Medical Center, Amsterdam, Netherlands, 2Institute of Biomedical Engineering, University of Oxford, Oxford, United Kingdom, 3Danish Research Centre for Magnetic Resonance, Centre for Functional and Diagnostic Imaging and Research, Copenhagen University Hospital Hvidovre, Copenhagen, Denmark, 4Cardiology and Radiology, Children's Hospital of Los Angeles, Los Angeles, CA, United States, 5Kate Gleason College of Engineering, Rochester Institute of Technology, Rochester, NY, United States, 6Department of Radiology, University Medical Center Utrecht, Utrecht, Netherlands, 7Department of Biomedical Engineering and Physics, Academic Medical Center, Amsterdam, Netherlands, 8Haematology, Internal Medicine, Academic Medical Center, Amsterdam, Netherlands
Synopsis
In this work, we applied a novel ASL method (Turbo-QUASAR) to evaluate the effects of life-long anaemia on cerebral physiology by comparing patients with Sickle Cell Disease to healthy controls. Turbo-QUASAR enables simultaneous assessment of cerebral blood flow (CBF), cerebral blood volume (aCBV) and arterial transit time (ATT) as well as tissue T1 and M0. We found normal ATT in the presence of elevated CBF in patients. In addition we found increased aCBV in patients. Acetazolamide administration shortened ATT with no change in aCBV suggesting maximal dilation and reserves being accessed by faster ATT. aCBV was inversely related to haemoglobin.
Background & Purpose
Cerebral blood flow (CBF), arterial cerebral blood volume (aCBV), and arterial transit times (ATT) offer relevant insight into the haemodynamics and associated changes in vasculature of adults with Sickle Cell Disease (SCD), who suffer from life-long anaemia. Homeostasis of oxygen is the primary purpose of brain perfusion, which leads to elevated blood flow in SCD. The extent to which this is changed by aCBV or ATT remains elusive. Chronic vascular inflammation in SCD1 warrants the use of contrast-free measurements to avoid aggravation of inflammation due to endothelial adhesion. Hence, we applied a novel pulsed ASL sequence (Turbo-QUASAR)2,3, whose main advantages include full brain coverage, short scan duration, and the opportunity to estimate multiple parameters: ATT, aCBV, CBF, M0 and T1. We investigated the extent to which SCD-related perfusion changes are accompanied by underlying vascular changes via aCBV and ATT.Methods
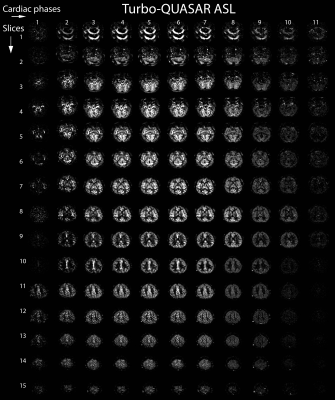
Imaging: Thirty-one adults with SCD and eleven healthy controls were included according to an IRB-approved study for MRI with intravenous acetazolamide (16 mg/kg ACZ) and blood withdrawal. Images were acquired at 3.0 Tesla (Ingenia, Philips Healthcare, Best, The Netherlands), with a 32-channel receive head-coil and body-coil transmission, at baseline and 15 minutes after ACZ. We applied Turbo-QUASAR multi-phase pulsed ASL2,3 with quantitative STAR labelling of arterial regions and FFE single-shot EPI Look-Locker read-outs between each labelling pulse. This produces an effectively infinite bolus duration since the bolus is additive with each pulse. Parameters were TR/TE/∆TI/TI1=6800/16/600/30ms, 11 phases, 15 slices (see Fig1), 14 dynamics, 7 boluses (4 crushed, 2 non-crushed, 1 low-flip angle), 64x64 matrix, FOV 240x240 mm, flip angle 35°/11.7°, 3.75x3.75x7mm voxels, SENSE 2.5, label thickness 150ms, vascular crushing directions RL/AP/FH, VENC of 4cm/s, and total acquisition time of 3:24mins. 3D FLAIR images were acquired to obtain high-resolution anatomical information for registration.
Post-processing: Data were processed in MATLAB (MathWorks, Natick, MA, US) using customised software, and a modified version of BASIL from FSL (FMRIB Software Library, Oxford, UK) to calculate parameter maps of CBF, aCBV, and ATT. The subtracted signal as a function of time (ΔM0) was split into crushed and non-crushed datasets. CBF and ATT were determined by applying a kinetic model4 assuming the following parameters: inversion efficiency 0.95, tissue T1 1.3s, and blood T1 1.65s. The aCBV was determined from the difference between crushed and non-crushed datasets, and subsequently from the time integral of the arterial input function divided by the bolus area corresponding to an initially labelled voxel with 100% blood volume. Parameter maps were transformed to 1.5x1.5x1.5 mm MNI space, using ExploreASL5.
Analyses: Regions-of-interest were defined per subject and masks created as follows: a threshold of >25% was applied to the grey matter probability map; the white matter probability maps were smoothed to the ASL resolution and a threshold of >90% was applied; arterial territories were defined from literature6. (Non)-parametric and paired tests were performed to test group-, region-, and ACZ-induced differences. P<0.05 was considered statistically significant.
Results
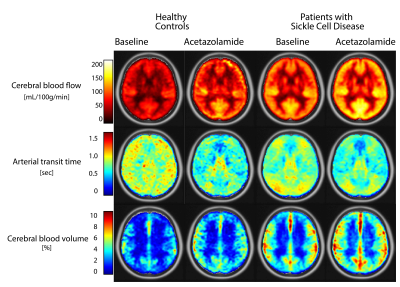
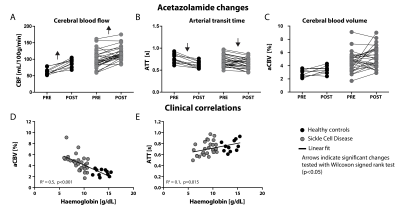
Table 1 provides subject characteristics and Turbo-QUASAR results for CBF, ATT, and aCBV in grey matter, white matter and acetazolamide-induced (ΔACZ) changes. CBF was significantly higher in SCD patients (99±26 mL/100g/min) compared to controls (61±10 mL/100g/min), and increased by 20 mL/100g/min in SCD patients (p<0.001) and 33 mL/100g/min in controls (p=0.003) after ACZ (Fig2). Fig3 indicates that group differences were distributed evenly across the vascular territories, except that Turbo-QUASAR CBF was higher in posterior regions. Fig4 shows that ATT was not different in SCD patients (0.71±0.12 s) compared to healthy controls (0.76±0.10 s), but decreased after ACZ (p<0.05), whereas aCBV was higher in SCD patients (4.6±1.5 %) compared to healthy controls (2.7±0.6 %) and did not change after ACZ. Haemoglobin (Hb) exhibited a strong negative relationship to aCBV (R2=0.5, p<0.001) and a weak but significant relationship to ATT (R2=0.1, p=0.015)(Fig4). 2=0.1, p=0.015)(Fig4).Discussion
We found that ATT was not different in SCD patients compared to healthy controls, despite elevated CBF, as shown previously7. Interestingly, using Turbo-QUASAR, we also found that aCBV was increased in patients, and that acetazolamide induced measureable reductions almost exclusively in ATT. This implies that aCBV of the macrovascular compartment in adult patients has undergone vascular outward remodelling to a point that vasodilation offers only limited reserves. Increased macrovascular aCBV may be an adaptation that is required to counteract anaemia. Maximal vasodilation in SCD at baseline means that increased CBF demands can only be met by reductions in ATT.Conclusion
In conclusion, Turbo-QUASAR ASL enables simultaneous assessment of CBF, aCBV and ATT, which has provided specific insight into this adult SCD cohort.Acknowledgements
This work was supported by Dutch foundation “Fonds Nuts Ohra” grant no. 1303-055. Clinical trials.gov identifier: NCT02824406.References
- Hebbel R, Osarogiagbon R, Kaul D. The Endothelial Biology of Sickle Cell Disease: Inflammation and a Chronic Vasculopathy. Microcirculation, 2004; 11:129-151.
- Petersen ET, Mouridsen K, Golay X. The QUASAR reproducibility study, Part II: Results from a multi-center Arterial Spin Labeling test-retest study. NeuroImage, 2010; 49:104-113.
- Petersen ET, De Vis JB, van den Berg CAT, Hendrikse J. Turbo-QUASAR: a signal-to-noise optimal arterial spin labeling and sampling strategy. ISMRM, 2013, 2146.
- Buxton RB, Frank LR, Wong EC, Siewert B, Warach S, Edelman RR. A general kinetic model for quantitative perfusion imaging with arterial spin labeling. MRM, 1998; 40:383–396.
- Mutsaerts H, Petr J, Lysvik E, Schrantee A, Shirzadi Z, Zelaya F, Groote I, O’Daly O, Kuijer J, De Bresser J, Richard E, Caan M, Van Osch M, Golay X, Reneman L, MacIntosh B, Masellis M, Hendrikse J, Barkhof F, Bjørnerud A, Nederveen A, Asllani I, Groot P ExploreASL: image processing toolbox for multi-center arterial spin labeling population analyses. Software exhibition ESMRMB, Barcelona, Spain 2017.
- Tatu L, Moulin T, Bogousslavsky J, Duvernoy H. Arterial territories of the human brain: cerebral hemispheres. Neurology, 1998; 50:1699–708.
- Xia Y, Chai Y, Bush A, Lepore N, Coates T, Wood J. FEAST based Arterial Transit Time Measurement using Pseudo Continuous Arterial Spin Labeling in Patients with Sickle Cell Disease. ISMRM, 2017, 4626.
Figures


