0855
Validation of Cerebrovascular Reactivity by Arterial Spin Labeling MRI in Moyamoya Disease with Simultaneously Measured 15O-PET and Phase-contrast MRI1Radiology, Stanford University, Stanford, CA, United States, 2Neurosurgery, Tokyo Medical and Dental University, Tokyo, Japan, 3Applied Science Lab, GE Healthcare, Menlo Park, CA, United States, 4Neurosurgery, Stanford University, Stanford, CA, United States
Synopsis
We validated cerebrovascular reactivity (CVR) in Moyamoya disease measured by arterial spin labeling (ASL) simultaneously with 15O-positron emission tomography (PET) using hybrid PET/MRI scanner. We compared the three types of ASL including standard-delay, multi-delay with extended post-label delay, and velocity selective ASL (VS-ASL). To quantify absolute PET cerebral blood flow (CBF) without arterial blood samples, we scaled the static PET maps using simultaneously collected phase-contrast (PC) MRI. Multi-delay ASL showed the strongest correlation with PC-PET on both baseline and post-ACZ CBF (R2 = 0.48 and 0.66 respectively). Multi-delay ASL and VS-ASL showed similar good correlations with PC-PET on CVR.
Introduction
Cerebrovascular reactivity (CVR) is an important index to evaluate the ability of brain vessels to respond to hemodynamic stress in cerebrovascular disease.1,2 CVR has been evaluated by measuring perfusion before and after administration of acetazolamide (ACZ), on single photon emission computed tomography, positron emission tomography (PET) or xenon CT.1-3 Recently, several studies demonstrated CVR can be reliably evaluated by arterial spin labeling (ASL) MRI.4-6 However, ASL is still challenging in regions with long transit delays through collateral pathways like Moyamoya disease, because the prescribed post-labeling delay (PLD) is too short relative to the arrival time of tagged spins, and ASL underestimates or fails to detect blood flow through the collateral vasculature.7,8 Therefore, CVR measured by ASL needs validation with a reference standard, but it has been challenging to measure truly the same hemodynamic response to ACZ with different modalities due to physiological fluctuations. The aim of this study is to validate CVR measured by ASL simultaneously with 15O-PET using hybrid PET/MRI scanner.Methods
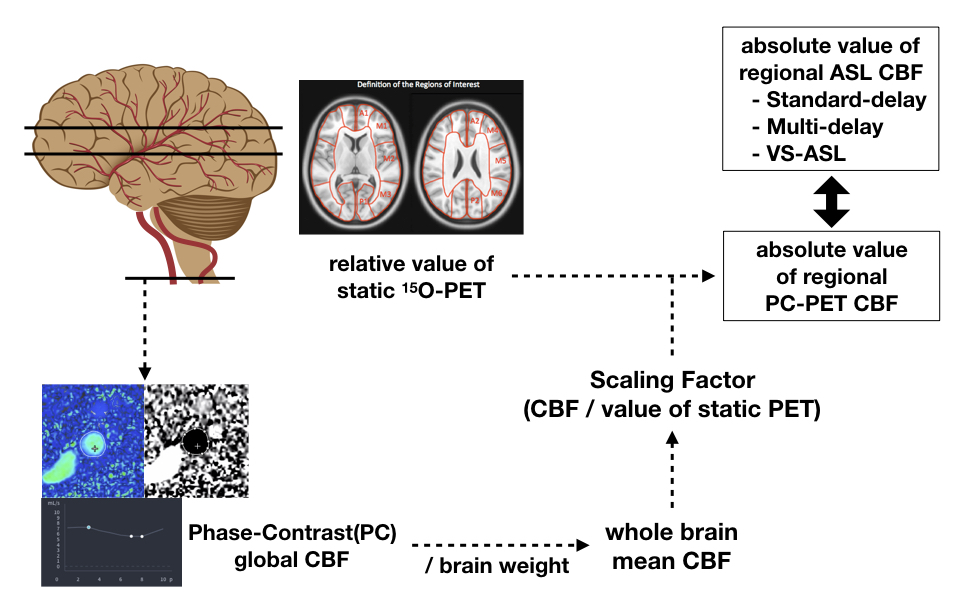
Data were acquired from 12 patients with Moyamoya disease (39.2±13 years) on a hybrid PET/MRI system (Signa, GE Healthcare, Waukesha, WI). Each patient was scanned three times; two baseline scans and one post–acetazolamide (ACZ) scan. The patients received an intravenous injection of [15O]-water (740–980 MBq). Three ASL sequences and gated phase-contrast (PC) MRI scans were performed simultaneously with the PET scans. The standard-delay (PLD: 2025 ms) and multi-delay (PLD: 300–3700 ms) ASL scans used pseudo-continuous labeling, and the multi-delay ASL enabled measurement of and correction for arterial transit time (ATT). The VS-ASL scan used velocity selective labeling (cutoff velocity: 2 cm/sec, inflow time: 1.6 sec). As a reference standard, static PET images were reconstructed from 2 minutes of detected counts after the tracer injection. To quantify absolute PET-CBF without arterial blood samples, we scaled the static PET maps using simultaneously collected PC MRI.9 First, total blood inflow through the internal carotids and vertebral arteries were measured with PC MRI (Arterys, San Francisco, CA), and normalized by total brain weight to estimate whole-brain mean CBF. Then the PET relative CBF map was multiplied by a scaling factor to create quantitative PC-PET maps that had the same mean CBF value as PC MRI (Figure 1). CBF and CVR, defined as percent change in CBF after ACZ administration, in 20 cortical regions from the ASPECTS scoring system10 were compared between each ASL scan and PC-PET.Results
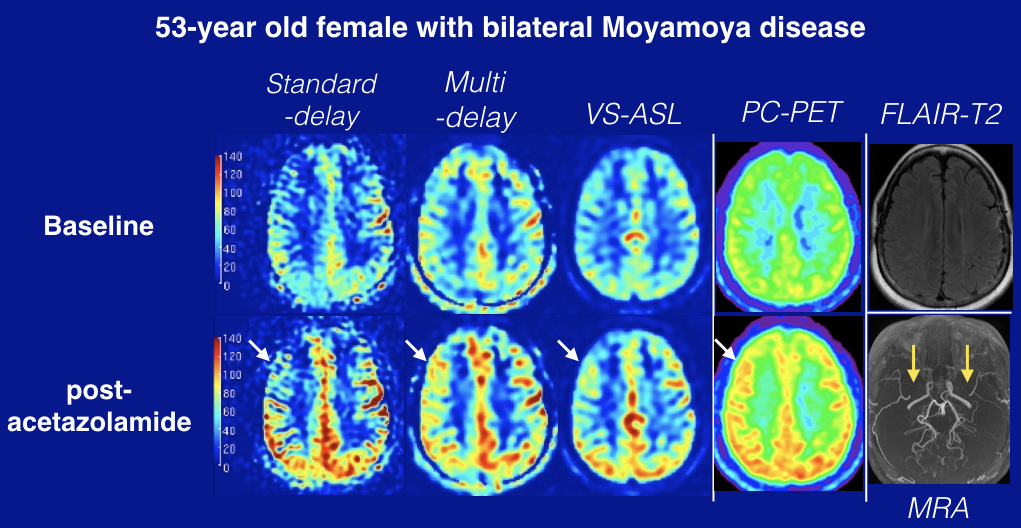
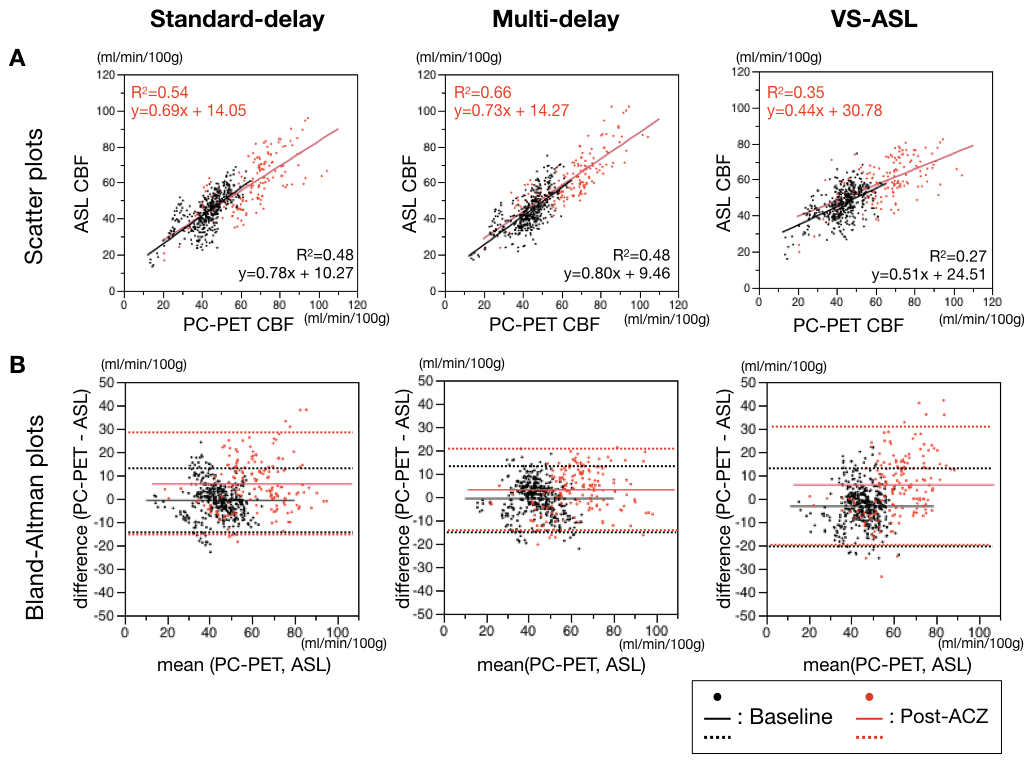
A representative Moyamoya case is shown in Figure 2. Linear regression and Bland-Altman plots between each ASL type and PC-PET are shown across the cortical regions of interest, including both baseline and post-ACZ CBF. Multi-delay ASL showed the strongest correlation with PC-PET, with R2 = 0.66 (p < 0.0001) (Figure 3). The slope of the regression line in the Bland–Altman plot was significantly different from zero for standard-delay ASL at baseline (p = 0.0014) and VS-ASL of post-ACZ (p < 0.001).
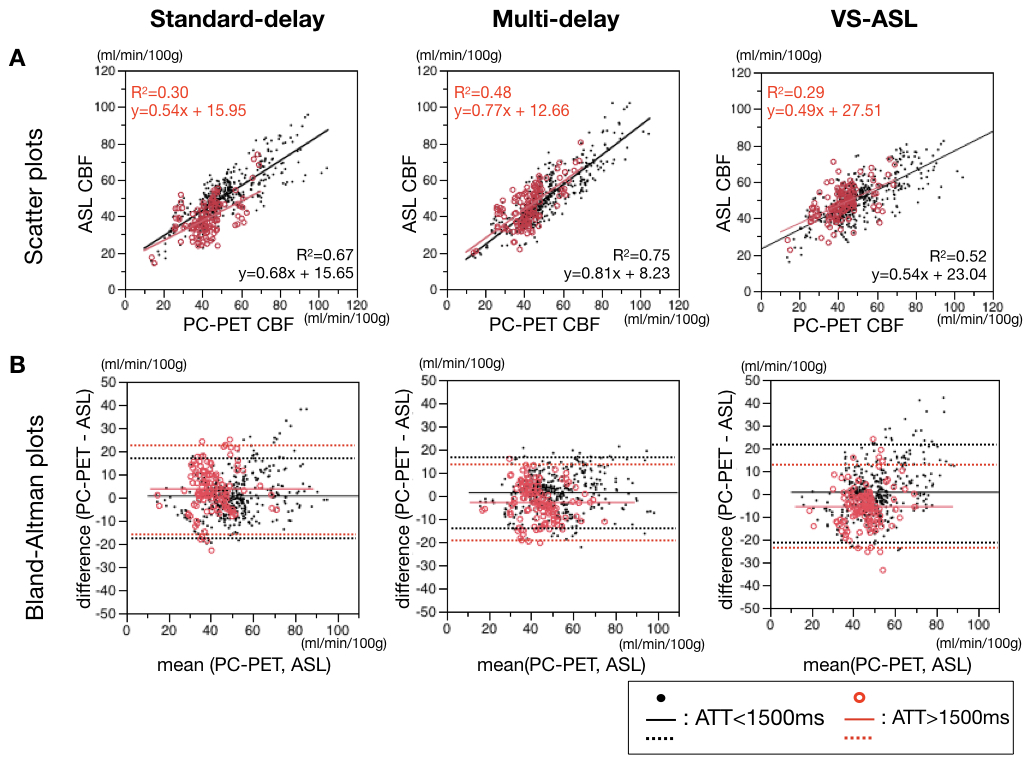
Next, all regions of interest were divided into two subgroups with ATT <= 1500ms and ATT > 1500ms, corresponding to more severe disease-related transit delays (Figure 4). Even in the longer ATT group, multi-delay ASL showed relatively good correlation (R2 = 0.48) with PC-PET.
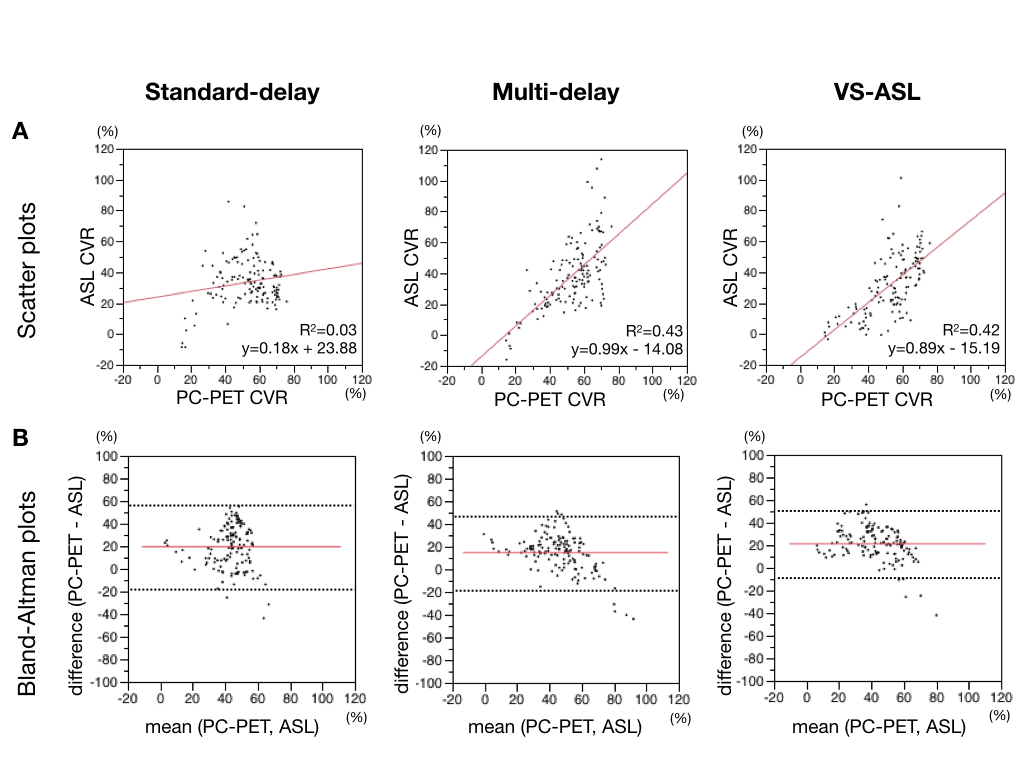
Finally, the correlation between the CVR of ASL and PC-PET was evaluated (Figure 5). Multi-delay ASL and VS-ASL showed similar good correlations with PC-PET. The negative slope of the regression line, however, in the Bland–Altman plot on the multi-delay ASL and VS-ASL was significantly different from zero (p<0.0001, p=0.0062) and suggested slight overestimation of CVR by ASL compared to PC-PET at higher CVR regions.
Discussion
Multi-delay ASL showed significant correlation with PC-PET CBF and CVR, outperforming other ASL sequences especially in regions with longer ATT. CBF in those regions tended to be underestimated on standard-delay ASL. This is consistent with the recent report showing that long PLD's are required to evaluate accurate CBF for ASL studies in cerebrovascular disease.11
In this study, PC-PET CBF utilizes simultaneous PET/MRI to scale relative PET CBF distribution to absolute values from PC MRI. Because this method inherently depends on the global CBF derived from PC MRI, we need to take this into consideration. Previous studies that compared CBF measured by PC MRI and by 15O-water PET with blood sampling showed the significant correlation of PC MRI for quantification of global CBF, but also that PC MRI systematically yields higher values relative to PET.12
Conclusion
In this validation study in Moyamoya disease, multi-delay ASL showed the best correlation with phase-contrast scaled PET CBF and CVR.Acknowledgements
No acknowledgement found.References
1. Yonas H, Smith HA, Durham SR, et al. Increased stroke risk predicted by compromised cerebral blood flow reactivity. Neurosurg. 1993;79(4):483-489.
2. Okazawa H, Tsuchida T, Kobayashi M, et al. Can the detection of misery perfusion in chronic cerebrovascular disease be based on reductions in baseline CBF and vasoreactivity? Eur J Nucl Med Mol Imaging. 2007;34(1):121-129.
3: Nariai T, Suzuki R, Hirakawa K, et al. Vascular reserve in chronic cerebral ischemia measured by the acetazolamide challenge test: comparison with positron emission tomography. AJNR Am J Neuroradiol. 1995;16(3):563-570.
4. Noguchi T, Kawashima M, Nishihara M, et al. Noninvasive method for mapping CVR in moyamoya disease using ASL-MRI. Eur J Radiol. 2015;84:1137–1143.
5. Yun TJ, Paeng JC, Sohn CH, et al. Monitoring Cerebrovascular Reactivity through the Use of Arterial Spin Labeling in Patients with Moyamoya Disease. Radiology. 2016;278(1):205-213.
6. Federau C, Christensen S, Zun Z, et al. Cerebral blood flow, transit time, and apparent diffusion coefficient in moyamoya disease before and after acetazolamide. Neuroradiology. 2017;59(1):5-12.
7. Yun TJ, Sohn CH, Han MH, et al. Effect of delayed transit time on arterial spin labeling: correlation with dynamic susceptibility contrast perfusion magnetic resonance in moyamoya disease. Invest Radiol. 2013;48(11):795-802.
8. Kimura H, Kado H, Koshimoto Y, et al. Multislice continuous arterial spin-labeled perfusion MRI in patients with chronic occlusive cerebrovascular disease: a correlative study with CO2 PET validation. J Magn Reson Imaging. 2005;22(2):189-198.
9. Ssali T, Anazodo U, Thiessen J, et al. A Non-invasive Method for Quantifying Cerebral Blood Flow by Hybrid PET/MR. 2017. ISMRM abstract (1338).
10. Barber PA, Demchuk AM, Zhang J, et al. Validity and reliability of a quantitative computed tomography score in predicting outcome of hyperacute stroke before thrombolytic therapy. ASPECTS Study Group. Alberta Stroke Programme Early CT Score. Lancet. 2000;355(9216):1670-1674.
11. Fan AP, Guo J, Khalighi MM, et al. Long-Delay Arterial Spin Labeling Provides More Accurate Cerebral Blood Flow Measurements in Moyamoya Patients: A Simultaneous Positron Emission Tomography/MRI Study. Stroke. 2017;48(9):2441-2449.
12. Vestergaard MB, Lindberg U, Aachmann-Andersen NJ, et al. Comparison of global cerebral blood flow measured by phase-contrast mapping MRI with 15O-H2O positron emission tomography. J Magn Reson Imaging. 2017;45(3):692-699.
Figures