0854
Advanced lesion symptom mapping analyses and implementation as BCBtoolkit1BCBlab, Paris, France, 2Frontlab, Institut du Cerveau et de la Moelle épinière, Paris, France, 3Centre de Neuroimagerie de Recherche CENIR, Paris, France
Synopsis
Even when focal, brain lesions have local and remote effects that impact functionally and structurally connected circuits. We developed a free open-source software (BCBtoolkit) that gathers different methods to estimate these effects on structural (using healthy controls tractography) and functional networks, using T1-images and fMRI data, and relate them to behavioral impairment. We applied these methods to 37 patients with a chronic focal brain lesion and 54 healthy controls in the context of category fluency. Our methods revealed a large set of directly and indirectly disconnected brain regions that had significantly impacted the performance.
Introduction
Patients with brain lesions provide a unique opportunity to understand the functioning of the human mind. However, even with the recent advances in neuroimaging techniques, relating symptom with brain damage remains a challenge. Indeed, disconnections and diaschisis can have an impact upon distant regions in several respects through maladaptive responses and pathological spread 1. Non-local effects of lesions have previously been explored using various forms of atlas-based analyses of tract damage 2-11, lesion-driven tractography 11-13, disconnectome-mapping 14-18 and lesion-driven resting state fMRI (rs-fMRI) connectivity 13,19. However, determining what these methods actually measure and identifying how to properly combine them are not always fully clear to the scientific community. Furthermore, there is an extremely limited availability of free, open-source software that applies methods to measure the non-local effects of lesions. These resources and scientific tools remain very much inaccessible and present a potential threat to reproducible science 19.Methods
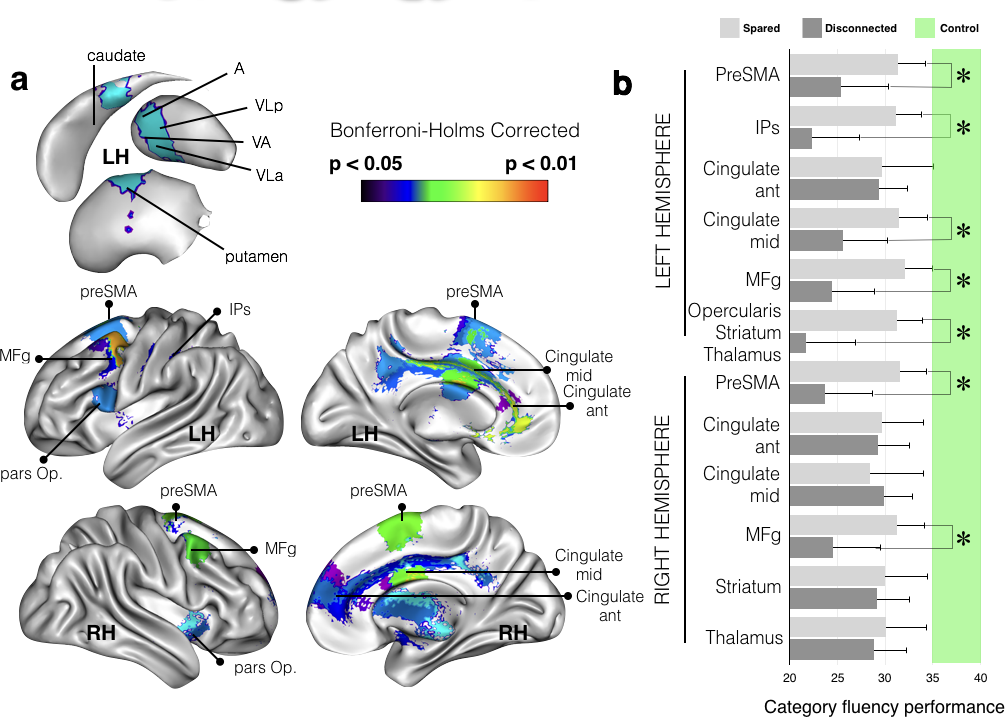
In response to this need, we provide a set of complementary solutions to measure both the circuit and the subsequent change within the circuit that is caused by a lesion. We applied these methods to 37 patients with a focal brain lesion following a stroke or a surgical resection and compared their performance in the category fluency task with 54 healthy controls. We first assessed the risk of disconnection in well-known white matter tracts and tested their relationship with category fluency performance. We then used tractography of healthy controls in order to produce maps (Disconnectome maps) of the areas that are directly disconnected and we used a cluster-based disconnection-symptom analysis (AnaCOM2) in order to relate the disconnected clusters with a significant decrease of performance. We additionally calculated the rs-fMRI connectivity of these clusters to reveal the whole network of directly and indirectly connected regions that participate in category fluency. Finally, we explored potential microstructural changes in the disconnected clusters and networks, by estimating the neuronal loss or local connectivity degeneration derived from MR-based measures of cortical thickness and Shannon entropy of the BOLD signal.Results
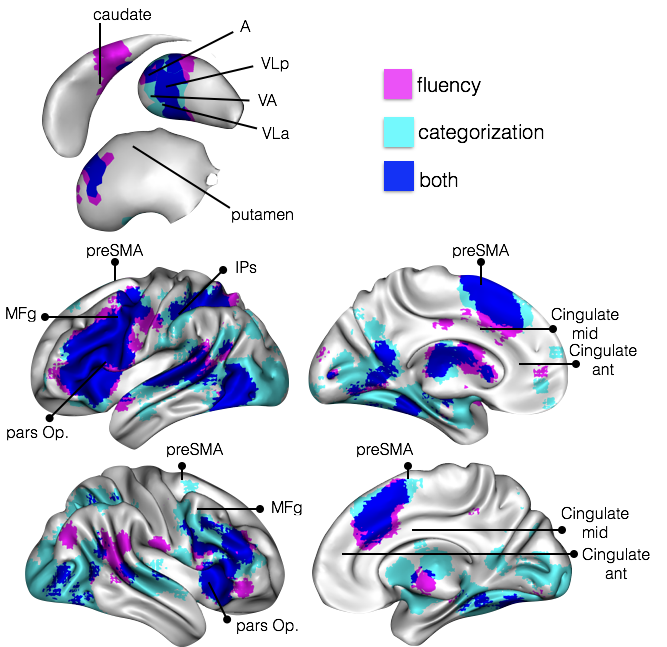
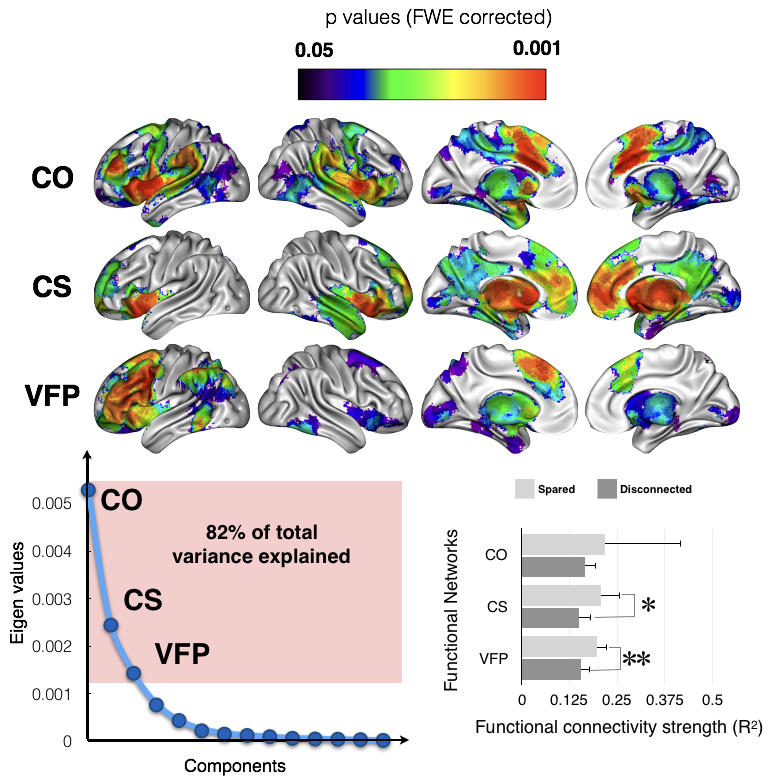
These methods applied to 37 patients with brain lesion revealed a large network of brain areas (Fig. 1) contributing significantly to the production of words of the same category. We confirmed that the deafferented areas significantly affecting the category fluency performance are classically considered as functionally engaged in tasks related to verbal fluency and categorization (Fig. 2). These deafferented areas also belonged to larger functional networks: a cingulo-opercular, a cortico-striatal and a left ventral frontoparietal network. The two latter networks showed a significantly lower functional connectivity in patients with a disconnection (Fig. 3). A decrease of cortical thickness in clusters of disconnections and disrupted networks was also significantly associated with a poorer performance. Finally, when compared to controls all patients showed a clear decrease of entropy in the whole brain.Discussion
A large set of complementary methods can capture the impact of lesions on distant regions and expose the subsequent consequences upon patients’ neuropsychological performance. Several of these methods are built directly into our freely available software package BCBtoolkit. This package can be employed to measure the pathophysiological mechanisms that cause cognitive deficits and assess the relationship between these mechanisms and their consequential effect. Here we evaluated the risk of disconnection of classically defined white matter tracts and tested their relationship with category fluency performance. We then employed a tractography-based approach in order to reveal regions that were structurally disconnected by the lesion and assess their relationship with category fluency performance as compared to controls and other patients. Functional connectivity from the disconnected regions revealed large networks of interconnected areas. Within these regions/networks, measures of cortical thickness and of entropy of the rs-fMRI images were correlated to fluency performance, suggesting that some structural changes that occurred within these networks were due to the remote effect of a lesion that led to cognitive impairments.Conclusion
Overall, using BCBtoolkit, researchers and clinicians can measure distant effects of brain lesions and associate these effects with neuropsychological outcomes. Taken together, these neuroimaging measures help discern the natural history of events occurring in the brain after a lesion, as well as assist in the localization of functions. These methods, gathered in theBCBtoolkit, are freely available as supplementary software at http://toolkit.bcblab.comAcknowledgements
No acknowledgement found.References
1. Munafo, M., Metascience: Reproducibility blues. Nature, 2017. 543(7647): p. 619-620.
2. Thiebaut de Schotten, M., et al., Damage to white matter pathways in subacute and chronic spatial neglect: a group study and 2 single-case studies with complete virtual "in vivo" tractography dissection. Cereb Cortex, 2014. 24(3): p. 691-706.
3. Thiebaut de Schotten, M., et al., Visualization of disconnection syndromes in humans. Cortex, 2008. 44(8): p. 1097-103.
4. Urbanski, M., et al., Reasoning by analogy requires the left frontal pole: lesion-deficit mapping and clinical implications. Brain, 2016. 139(Pt 6): p. 1783-1799.
5. Cazzoli, D., et al., The influence of naturalistic, directionally non-specific motion on the spatial deployment of visual attention in right-hemispheric stroke. Neuropsychologia, 2016. 92: p. 181-189.
6. Piai, V., et al., Neuroplasticity of language in lefthemisphere stroke: evidence linking subsecond electrophysiology and structural connections. Human Brain Mapping, 2017.
7. Rudrauf, D., S. Mehta, and T.J. Grabowski, Disconnection's renaissance takes shape: Formal incorporation in group-level lesion studies. Cortex, 2008. 44(8): p. 1084-96.
8. Fridriksson, J., et al., Damage to the anterior arcuate fasciculus predicts non-fluent speech production in aphasia. Brain, 2013. 136(Pt 11): p. 3451-60.
9. Hope, T.M., et al., Distinguishing the effect of lesion load from tract disconnection in the arcuate and uncinate fasciculi. Neuroimage, 2016. 125: p. 1169-73.
10. Corbetta, M., et al., Common behavioral clusters and subcortical anatomy in stroke. Neuron, 2015. 85(5): p. 927-41.
11. Griffis, J.C., et al., Damage to white matter bottlenecks contributes to language impairments after left hemispheric stroke. Neuroimage Clin, 2017. 14: p. 552-565.
12. He, B.J., et al., Breakdown of functional connectivity in frontoparietal networks underlies behavioral deficits in spatial neglect. Neuron, 2007. 53(6): p. 905-18.
13. Turken, A.U. and N.F. Dronkers, The neural architecture of the language comprehension network: converging evidence from lesion and connectivity analyses. Front Syst Neurosci, 2011. 5: p. 1.
14. Bonilha, L., et al., The brain connectome as a personalized biomarker of seizure outcomes after temporal lobectomy. Neurology, 2015. 84(18): p. 1846-53.
15. Thiebaut de Schotten, M., et al., From Phineas Gage and Monsieur Leborgne to H.M.: Revisiting Disconnection Syndromes. Cereb Cortex, 2015. 25(12): p. 4812-27.
16. Kuceyeski, A., et al., Structural connectome disruption at baseline predicts 6-months post-stroke outcome. Hum Brain Mapp, 2016. 37(7): p. 2587-601.
17. Yourganov, G., et al., Multivariate Connectome-Based Symptom Mapping in Post-Stroke Patients: Networks Supporting Language and Speech. J Neurosci, 2016. 36(25): p. 6668-79.
18. Kuceyeski, A., et al., The Network Modification (NeMo) Tool: elucidating the effect of white matter integrity changes on cortical and subcortical structural connectivity. Brain Connect, 2013. 3(5): p. 451-63.
19. Boes, A.D., et al., Network localization of neurological symptoms from focal brain lesions. Brain, 2015. 138(Pt 10): p. 3061-75.
Figures