0851
Thalamic Lac/NAA threshold of 0.39 on proton MRS predicts outcome following therapeutic hypothermia in neonatal hypoxic ischemic encephalopathy1University College Hospital, London, United Kingdom, 2University College London, London, United Kingdom
Synopsis
Perinatal hypoxic ischemic brain injury remains a significant cause of neonatal morbidity and mortality. Accurate prediction of neurodevelopmental outcome following HIE is important for parental counselling and directing care towards optimised treatments. Proton MRS derived thalamic Lactate/N-acetylaspartate (Lac/NAA) peak area ratio at 1.5T was a robust MR outcome biomarker in the pre-cooling era; a cut off Lac/NAA of 0.29 accurately predicted outcome. The aim of this work is to identify the cut off threshold of thalamic Lac/NAA at 3T in the cooling era for outcome prediction.
Introduction
Perinatal hypoxic ischemic brain injury remains a significant cause of neonatal morbidity and mortality. Accurate prediction of neurodevelopmental outcome following HIE is important for parental counselling and directing care towards optimised treatments. Proton MRS derived thalamic Lactate/N-acetylaspartate (Lac/NAA) peak area ratio at 1.5T was a robust MR outcome biomarker(1) in the pre-cooling era; a cut off Lac/NAA of 0.29 accurately predicted outcome.
The aim of this work is to assess the predictive accuracy of thalamic Lac/NAA at 3T in the cooling era, using two spectrum fitting methods: AMARES(2) implemented in the jMRUi and TARQUIN(3) software packages and identify the cut off threshold of thalamic Lac/NAA at 3T in the cooling era for outcome prediction. Additional aim is tocompare thalamic Lac/NAA with other MR imaging biomarkers for outcome prediction.
Methods
Subjects and protocol: 55 term infants admitted to our institution with moderate to severe NE, who fulfilled criteria for therapeutic hypothermia, were included in the study. All infants underwent MRI and thalamic 1H MRS at 3T (PRESS, 64 averages, TR/TE = 2288ms/288ms, voxel size 15x15x15mm, scan time ∼7 min) between day 2-14 (median day 5).
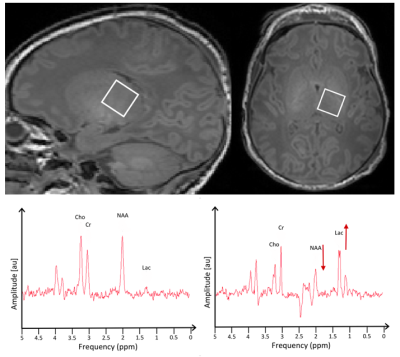
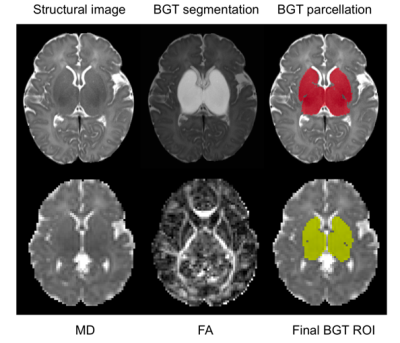
MRS analysis: Acquired spectra (figure 1) were processed using both jMRUi and TARQUIN independently and Lac/NAA peak-area ratios were computed. With both fitting methods NAA and N-acetyl aspartylglutamate (NAAG) are fitted and combined for total NAA; for jMRUi a doublet is fitted for lactate and for TARQUIN both lactate and threonine are fitted at 1.3 ppm. For the final analysis, log10Lac/NAA was calculated as the data were skewed.MRI analysis: Diffusion tensor imaging (DTI) data was acquired in all neonates (SE-EPI, TR/TE 8000/49, FOV:224x220, 2x2x2mm b=750 s/mm2, 32 directions). All datasets were corrected for eddy current distortions(4). Next, mean diffusivity (MD) and fractional anisotropy (FA) maps were generated(5). Next, regional MD and FA values were computed in regions of interest (ROI) generated automatically in the basal ganglia thalamic region (BGT) (figure 2). MR images were scored using modified Okereafor(9) and NICHD(10) scoring systems. Bayley III assessments were performed at 2 years; neurodevelopment outcomes were classified as normal with a composite score of 85 and above. Poor outcome was defined as death or a composite score <85.
Results
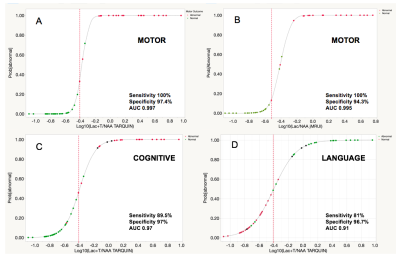
Lac/NAA cut off threshold of 0.39 on TARQUIN predicted motor outcome with 100% sensitivity and 97.4% specificity (AUC 0.997) (figure 3A), cognitive outcome with sensitivity 89.5% & specificity 97% (AUC 0.97) (figure 3C), language outcome with sensitivity 81% & specificity 96.7% (AUC 0.91) (figure 3D). Lac/NAA on jMRUi predicted motor outcome with similar sensitivity (100%) & specificity (94.3%) with a cut off threshold Lac/NAA of 0.3 (AUC 0.995) (figure 3B). BGT MD predicted motor outcome with a sensitivity 65% and specificity 100% (AUC 0.77). MRI scores correlated with log10Lac/NAA (figure 5A & 5B).
In summary, thalamic Lac/NAA at 3T is a robust predictor of outcome after HT following HIE. A cut off threshold of 0.39 for TARQUIN predicted outcome in all domains with high sensitivity and specificity at 2 yrs of age. Move over, thalamic Lac/NAA performed better than other MR biomarkers.
Acknowledgements
No acknowledgement found.References
1.Thayyil et al., Pediatrics. 2010
2.Vanhamme et al., J Magn Reson. 1997
3.Wilson et al., Magn Reson Med. 2011
4.Andersson et al., Neuroimage. 2016
5. Basser et al., J Magn Reson B. 1994
6. http://cmictig.cs.ucl.ac.uk/wiki/index.php/Main_Page
7. http://brain-development.org/brain-atlases/
8. Cardoso et al., Neuroimage. 2013
9. Okereafor et al., Pediatrics. 2008
10. Shankaran et al., J Pediatr. 2015
Figures


Figure 4. log10Lac/NAA was significantly different between the normal and poor outcome groups in all three domains of outcome. Comparison of mean was performed using 1-way analysis of variance, presented with 95% confidence intervals (p<0.0001).
