0846
Cortical microstructures at birth predict neurodevelopmental outcome at 2 years of ageMinhui Ouyang1, Qinmu Peng1,2, Michelle Slinger1, and Hao Huang1,2
1Radiology, Children's Hospital of Philadelphia, Philadelphia, PA, United States, 2Radiology, Perelman School of Medicine, University of Pennsylvania, Philadelphia, PA, United States
Synopsis
Cortical microstructural architecture in preterm brain, quantitatively delineated with DTI fractional anisotropy (FA), is characterized by various levels of dendritic arborization. With cortical FA an important indicator of
Purpose
Cortical microstructural architecture in preterm brain, quantitatively delineated with DTI fractional anisotropy (FA), is characterized by various levels of dendritic arborization [1-4]. Unlike the adult human brain where cortical FA is at the noise level, cortical FA in the preterm brain is an effective indicator of the regional maturation of cerebral cortex. We hypothesized that cortical FA at birth would be an effective predictor of neurodevelopmental outcome at 2 years of age. In this study, high-resolution diffusion MRI (dMRI) was acquired from 46 preterm neonates without any radiological indication of neural abnormality. Bayley-III evaluation was conducted in a follow-up study when participants are at 2 years of age. We aimed to establish a predictive model by using FA across cortical regions of the preterm brains at birth to predict their Bayley scores at 2 years of age with machine learning algorithms.Methods
Participants, high-resolution diffusion MRI and Bayley tests: 46 normal preterm and term neonates (32 Male and 14 Female) were recruited. Around birth (scan ages of 36.6±2.8 postmenstrual week), MR scans were performed for all participants on a 3T Philips Achieva MR system. High resolution diffusion MRI (dMRI) data were acquired with following parameters: single shot EPI with SENSE factor 2.5, TR/TE=6850/78ms, FOV=168x168mm2, imaging resolution=1.5x1.5x1.6mm3, 60 slices, 30 independent diffusion-weighted directions, b-value=1000sec/mm2, repetition=2. FA maps were calculated for all subjects using DTIStudio (mristudio.org). In a follow-up study, all 46 infants at their 2 years of age (corrected for prematurity) underwent a Bayley test (Bayley-III) [5] to assess their cognitive, language and motor development. Bayley test was conducted by a board-certified developmental psychologist. Measurement of FA at the cortical skeleton: Cortical “skeleton” was generated to measure the FA at the core of cerebral cortical mantle (Fig 1a) and alleviate partial volume effects. The details of measuring cortical FA at the cortical skeleton by using a custom-made protocol can be found in the literature [4]. A Penn-CHOP neonate brain atlas was used to identify the cortical gyri [5]. Feature extraction based on cortical skeleton FA measurements: The template’s cortex was randomly subdivided into 1024 regions with equal size [6]. Super-voxel cortical FA was calculated by averaging the cortical FA values in each region for all subjects. Cognitive score prediction with cortical FA: Pattern analysis was performed using the support vector regression (SVR) algorithm implemented in LIBSVM (http://www.csie.ntu.edu.tw/~cjlin/libsvm) [7]. Cognitive score from Bayley-III was used as the training measure. Super-voxel cortical FA values formed the feature vector and were used as the SVR predictor (Fig.1b). Leave-one-out cross-validation (LOOCV) was adopted to evaluate the performance of the SVR model (Fig.1c). In this procedure, the cognitive score of each infant was predicted from an independent training sample, without being used to build the prediction model. Pearson correlation coefficient between the actual and predicted cognitive score was computed to assess the prediction accuracy.Results
With cortical FA values at birth as features, the predicted cognitive score obtained from SVR models is significantly correlated (r=0.5, p=0.0004) with the actual cognitive score from Barley-III, shown in Fig 2a. In the SVR model, the training data is defined as a weighted combination of all features, where this weight vector indicates the relative contribution of each feature. A heterogeneous feature weight or feature contribution pattern across cortex can be appreciated in Fig 2b, with red-color cortical areas more important in prediction. Fig 3a shows the top ten cortical regions (including precuneus and inferior, middle and superior frontal gyri) that contribute most with highest 20% feature weights in the SVR model. As an example, FA values from a representative cortical region, middle frontal gyrus (MFG), is significantly correlated (r=-0.3, p=0.04) with the actual cognitive score at 2 years of age (Fig 3b).Discussion and conclusion
The prediction results suggest cortical microstructure at birth is highly associated with neurodevelopmental outcome at 2 years of age. Preterm brain cortical FA, as an effective indicator of cortical microstructural architecture, may serve as a biomarker for cognitive score prediction. With lower regional cortical FA indicative higher level of cortical maturation [1-4] and more extensive local dendritical arborization, the significant correlation between cortical FA at birth with the cognitive score at 2 years of age suggests that higher maturational level of cortical regions at birth predicts higher cognitive scores at 2 years of age. Measurement of cortical FA at the “skeleton” effectively alleviate the partial volume effects [3,4]. Analysis of language and motor scores prediction with cortical FA is under way.Acknowledgements
This study is funded by NIH MH092535, MH092535-S1 and HD086984.References
[1] McKinstry et al (2002) Cereb Cortex 12:1237. [2] Huang et al (2013) Cereb Cortex 23:2620. [3] Ball et al (2013) PNAS 110: 9541. [4] Yu et al (2016) Cereb Cortex 26:4381. [5] Beyley (2006) San Antonio TX: Harcourt Assessment. [5] Feng et al. (2016) OHBM. [6] Zalesky et al (2010). Neuroimage 50: 970. [7] Chang and Lin (2011) ACM TIST 2:27Figures
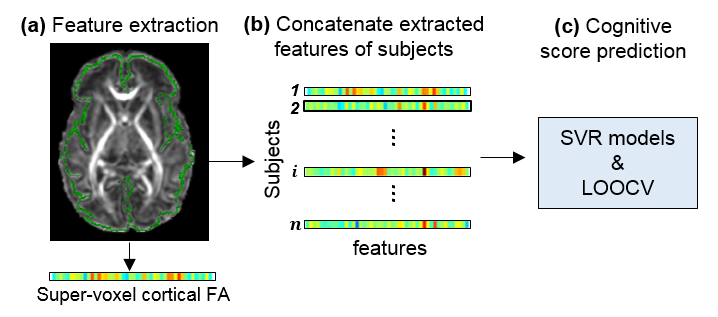
Fig 1: Overview of feature extraction and predictive analysis. (a) Cortical skeleton (green) is overlaid on fractional anisotropy (FA) map of a representative subject. For each subject, feature vectors are from super-voxel cortical FA measurements. (b) Super-voxel cortical FA measurements for all subjects are concatenated to obtain the input data for prediction models. (c) Cognitive score prediction was performed using the support vector regression (SVR) models and estimated by leave-one-out cross-validation (LOOCV).
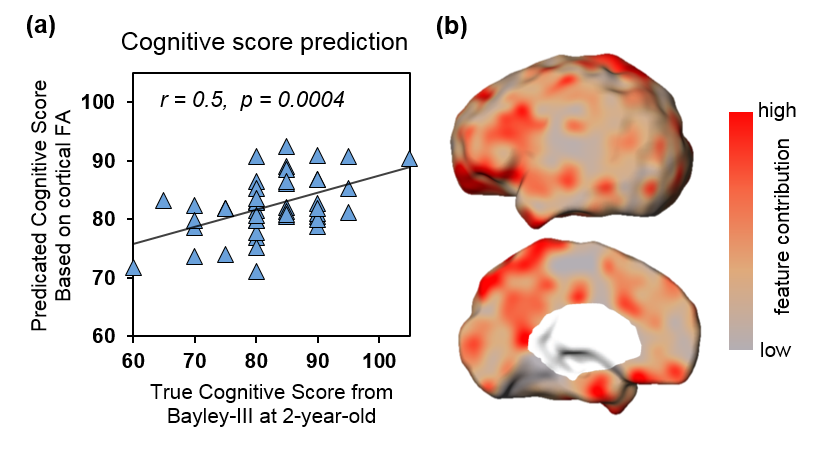
Fig 2: Significant prediction of cognitive score with cortical FA at birth as features. (a) Significant correlation (p<0.001) between predicted and true cognitive scores. (b) Visualization of feature contributions across different cortical regions.
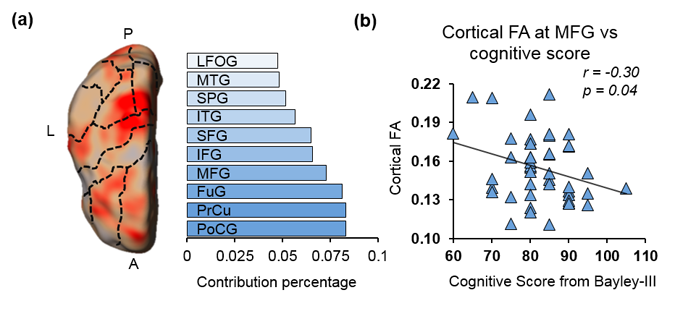
Fig 3: (a) Top ten cortical regions that contribute most with highest 20% feature weights in the SVR model. Dashed-lines overlaid on the feature contribution map are contours of different cortical gyri mapped from Penn-CHOP neonate brain atlas. Abbreviations: A: anterior. P: posterior. L: left hemisphere. PoCG: postcentral gyrus. PrCu: precuneus gyrus. FuG: fusiform gyrus. MFG: middle frontal gyrus. IFG: inferior frontal gyrus. SFG: superior frontal gyrus. ITG: inferior temporal gyrus. SPG: superior parietal gyrus. MTG: middle temporal gyrus. LFOG: lateral frontal-orbital gyus. (b) Significant correlation (p=0.04) between cognitive score and cortical FA of a representative cortical region (MFG).