0844
Caffeine and brain development in preterm children1Victorian Infant Brain Studies, Murdoch Children's Research Institute, Melbourne, Australia, 2Developmental Imaging, Murdoch Children's Research Institute, Melbourne, Australia, 3Department of Neurosurgery, The Royal Children's Hospital, Melbourne, Australia, 4Neuroscience research, Murdoch Children's Research Institute, Melbourne, Australia, 5Department of Medicine, Monash Medical Centre, Monash University, Melbourne, Australia, 6Clinical Epidemiology and Biostatistics Unit, Murdoch Children's Research Institute, Melbourne, Australia, 7Department of Paediatrics, The University of Melbourne, Melbourne, Australia, 8Newborn research, The Royal Women's Hospital, Melbourne, Australia, 9Department of Obstetrics and Gynaecology, The University of Melbourne, Melbourne, Australia, 10Monash Institute of Cognitive and Clinical Neurosciences, Monash University, Melbourne, Australia, 11Florey Institute of Neuroscience and Mental Health, Melbourne, Australia
Synopsis
We investigated effects of neonatal caffeine treatment on brain structure and longitudinal development in a subset of preterm children from a randomized, placebo-controlled trial. Children had MRI at age 11 years (n=118; 64 received caffeine, 54 received placebo), of whom 43 (21 caffeine, 22 placebo) had MRI at term-equivalent age. Global and regional brain volumes, cortical morphometry and white matter microstructure were similar between treatment groups at age 11 years, as was brain development from term-equivalent age to 11 years of age. Any benefits of caffeine on brain structure weaken over time and were not apparent at age 11 years.
Introduction
Caffeine treatment, widely used for apnea of prematurity, has been associated with short- and long-term benefits to health and development for infants born preterm and low birthweight (500-1250 g).1-5 Whether these benefits are related to improved brain development is unclear. We previously reported that caffeine treatment was associated with improved white matter microstructural development at term-equivalent age, specifically lower axial (AD), radial (RD) and mean (MD) diffusivities in superior frontal, central and posterior white matter regions.6 The aim of this study was to investigate whether neonatal caffeine treatment has longer-term effects on brain structure at 11 years of age, including global measures of brain structure, and measures from specific brain regions involved in motor function, given the particular benefit of caffeine treatment on motor function.3, 5 Our second aim was to investigate the relationship between neonatal caffeine treatment and longitudinal brain development from term to 11 years of age.Methods
Participants were from one site of the larger Caffeine for Apnea of Prematurity (CAP) randomized, placebo-controlled trial.1, 2, 4-6 Participants were eligible if they were born ≤1250 g. Of the 199 participants in the trial from this site, 118 had MRI at 11 years of age, of whom 64 received caffeine treatment and 54 received placebo. Of these, 43 participants (21 caffeine, 22 placebo) also had MRI at term. From the 11-year images, we segmented global brain tissue volumes,7 calculated surface-based measures of cortical grey matter morphometry for vertex-wise statistical analysis,8, 9 and generated diffusion tensor images for voxel-wise statistical analysis.10 To analyze specific regions involved in motor function, we used specialized atlases to calculate volumes of the cerebellum,11 thalamus and basal ganglia,12 and motor cortices.13 We also calculated thickness at 100 points along the corpus callosum, and area and thickness from corpus callosum sub-regions, including the rostral body and midbody, which connect motor and sensory cortices.14-16 We delineated the corticospinal, somatosensory, cerebellar-thalamo-cortical, cortico-ponto-cerebellar and corpus callosum tracts using probabilistic constrained spherical deconvolution tractography,17 and extracted average diffusion tensor values from tracts. We compared data from motor regions and tracts between treatment groups using separate linear regressions, fitted with generalized estimating equations to allow for correlations between data from twins. For our longitudinal analysis, we could obtain the following equivalent measures from neonatal and 11-year images: global brain tissue volumes,18 corpus callosum area,16 and diffusion values from manually drawn regions of interest6 and from corpus callosum tracts.16 We compared the change from term to 11 years in these measures between treatment groups using mixed effects models, with fixed effects for time point and group, and a random effect to allow for repeated measures from individuals.Results
At age 11 years there was little evidence that global brain volumes differed between treatment groups (Figure 1), or that vertex-wise cortical thickness, area and volume, and voxel-wise diffusion tensor values differed between groups (data not shown). There was also little evidence that cerebellar, deep nuclear and motor cortex volumes, and diffusion values from motor tracts, differed between groups (Figure 2). There was some evidence that corpus callosum thickness and area were higher in the placebo group compared with the caffeine group, particularly in the rostral body, although this weakened after multiple comparison correction (Figure 3). Overall, longitudinal changes in brain structure from term to 11 years were similar between groups. There was a trend for greater increases in corpus callosum area over time in the placebo group compared with the caffeine group (Table 1). Additionally, there was some evidence that diffusivities in regions of interest, particularly RD and MD in the superior-posterior region, reduced more from term to 11 years in the placebo group than caffeine group (Table 2).Discussion
Overall, the results suggest that global and regional brain volumes and microstructure are similar between children treated with caffeine and placebo at 11 years. The lack of differences in brain volumes is not surprising, given these also did not differ between treatment groups at term.6 However, the lack of differences in microstructure was surprising, given caffeine benefitted microstructure at term.6 The longitudinal analysis provided greater insight into these results. While in general longitudinal brain development was similar between groups, results suggested there was slightly faster development of white matter microstructure and the corpus callosum in the placebo group. Thus, the results suggest that the effect of caffeine on brain structure weakens over time, such that by 11 years, benefits of caffeine are less apparent.Conclusion
Any benefits of caffeine on brain structure in preterm infants have weakened by 11 years of age.Acknowledgements
No acknowledgement found.References
1. Schmidt B, Roberts RS, Davis P, et al. Caffeine therapy for apnea of prematurity. N Engl J Med. 2006;354(20):2112-2121.
2. Schmidt B, Roberts RS, Davis P, et al. Long-term effects of caffeine therapy for apnea of prematurity. N Engl J Med. 2007;357(19):1893-1902.
3. Doyle LW, Schmidt B, Anderson PJ, et al. Reduction in developmental coordination disorder with neonatal caffeine therapy. J Pediatr. 2014;165(2):356-359 e352.
4. Schmidt B, Anderson PJ, Doyle LW, et al. Survival without disability to age 5 years after neonatal caffeine therapy for apnea of prematurity. JAMA. 2012;307(3):275-282.
5. Schmidt B, Roberts RS, Anderson PJ, et al. Academic Performance, Motor Function, and Behavior 11 Years After Neonatal Caffeine Citrate Therapy for Apnea of Prematurity: An 11-Year Follow-up of the CAP Randomized Clinical Trial. JAMA Pediatr. 2017;171(6):564-572.
6. Doyle LW, Cheong J, Hunt RW, et al. Caffeine and brain development in very preterm infants. Ann Neurol. 2010;68(5):734-742.
7. Ashburner J and Friston KJ. Unified segmentation. Neuroimage. 2005;26(3):839-851.
8. Dale AM, Fischl B, and Sereno MI. Cortical surface-based analysis. I. Segmentation and surface reconstruction. Neuroimage. 1999;9(2):179-194.
9. Fischl B, Sereno MI, and Dale AM. Cortical surface-based analysis. II: Inflation, flattening, and a surface-based coordinate system. Neuroimage. 1999;9(2):195-207.
10. Smith SM, Jenkinson M, Johansen-Berg H, et al. Tract-based spatial statistics: voxelwise analysis of multi-subject diffusion data. Neuroimage. 2006;31(4):1487-1505.
11. Diedrichsen J, Balsters JH, Flavell J, et al. A probabilistic MR atlas of the human cerebellum. Neuroimage. 2009;46(1):39-46.
12. Patenaude B, Smith SM, Kennedy DN, et al. A Bayesian model of shape and appearance for subcortical brain segmentation. Neuroimage. 2011;56(3):907-922.
13. Desikan RS, Segonne F, Fischl B, et al. An automated labeling system for subdividing the human cerebral cortex on MRI scans into gyral based regions of interest. Neuroimage. 2006;31(3):968-980.
14. Adamson C, Beare R, Walterfang M, et al. Software pipeline for midsagittal corpus callosum thickness profile processing : automated segmentation, manual editor, thickness profile generator, group-wise statistical comparison and results display. Neuroinformatics. 2014;12(4):595-614.
15. Adamson CL, Wood AG, Chen J, et al. Thickness profile generation for the corpus callosum using Laplace's equation. Hum Brain Mapp. 2011;32(12):2131-2140.
16. Thompson DK, Inder TE, Faggian N, et al. Characterization of the corpus callosum in very preterm and full-term infants utilizing MRI. Neuroimage. 2011;55(2):479-490.
17. Tournier JD, Calamante F, and Connelly A. Improved probabilistic streamlines tractography by 2nd order integration over fibre orientation distributions. International Society for Magnetic Resonance in Medicine (ISMRM). 2010.
18. Beare RJ, Chen J, Kelly CE, et al. Neonatal Brain Tissue Classification with Morphological Adaptation and Unified Segmentation. Front Neuroinform. 2016;10:12.
Figures
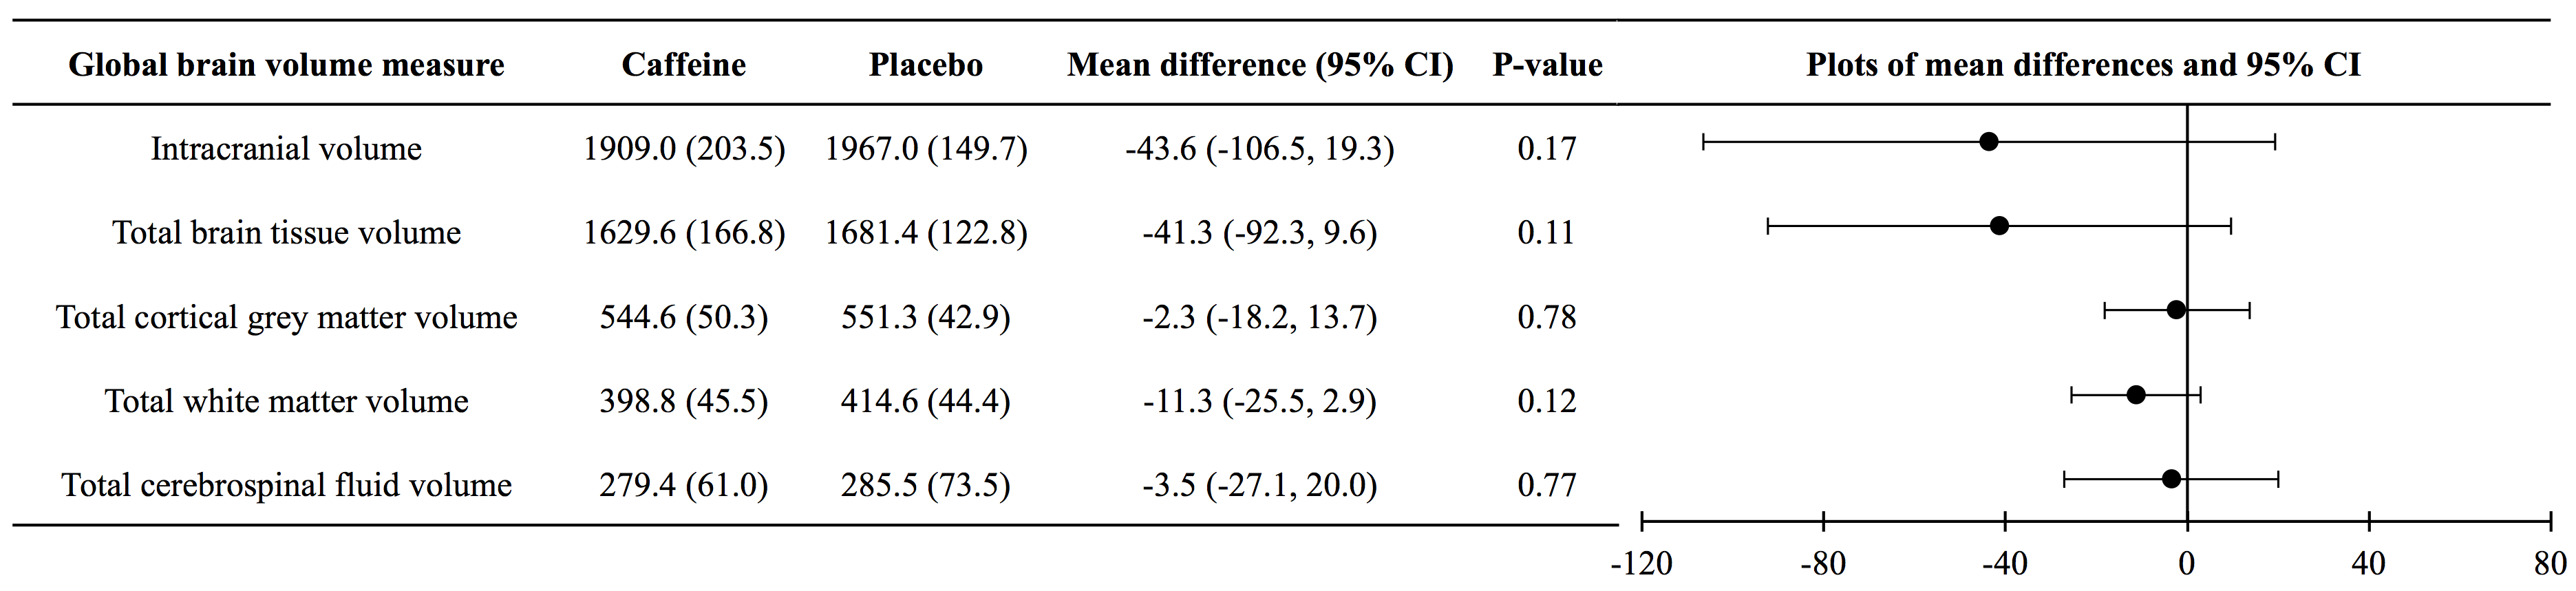
Figure 1. Global brain volumes at 11 years of age, contrasted between treatment groups.
Data for caffeine and placebo groups are means (standard deviations). Mean differences and P-values are from separate linear regressions adjusted for age at MRI and sex of the child. The plots are visual representations of the mean differences and confidence intervals (CI). Volume units are cm3.
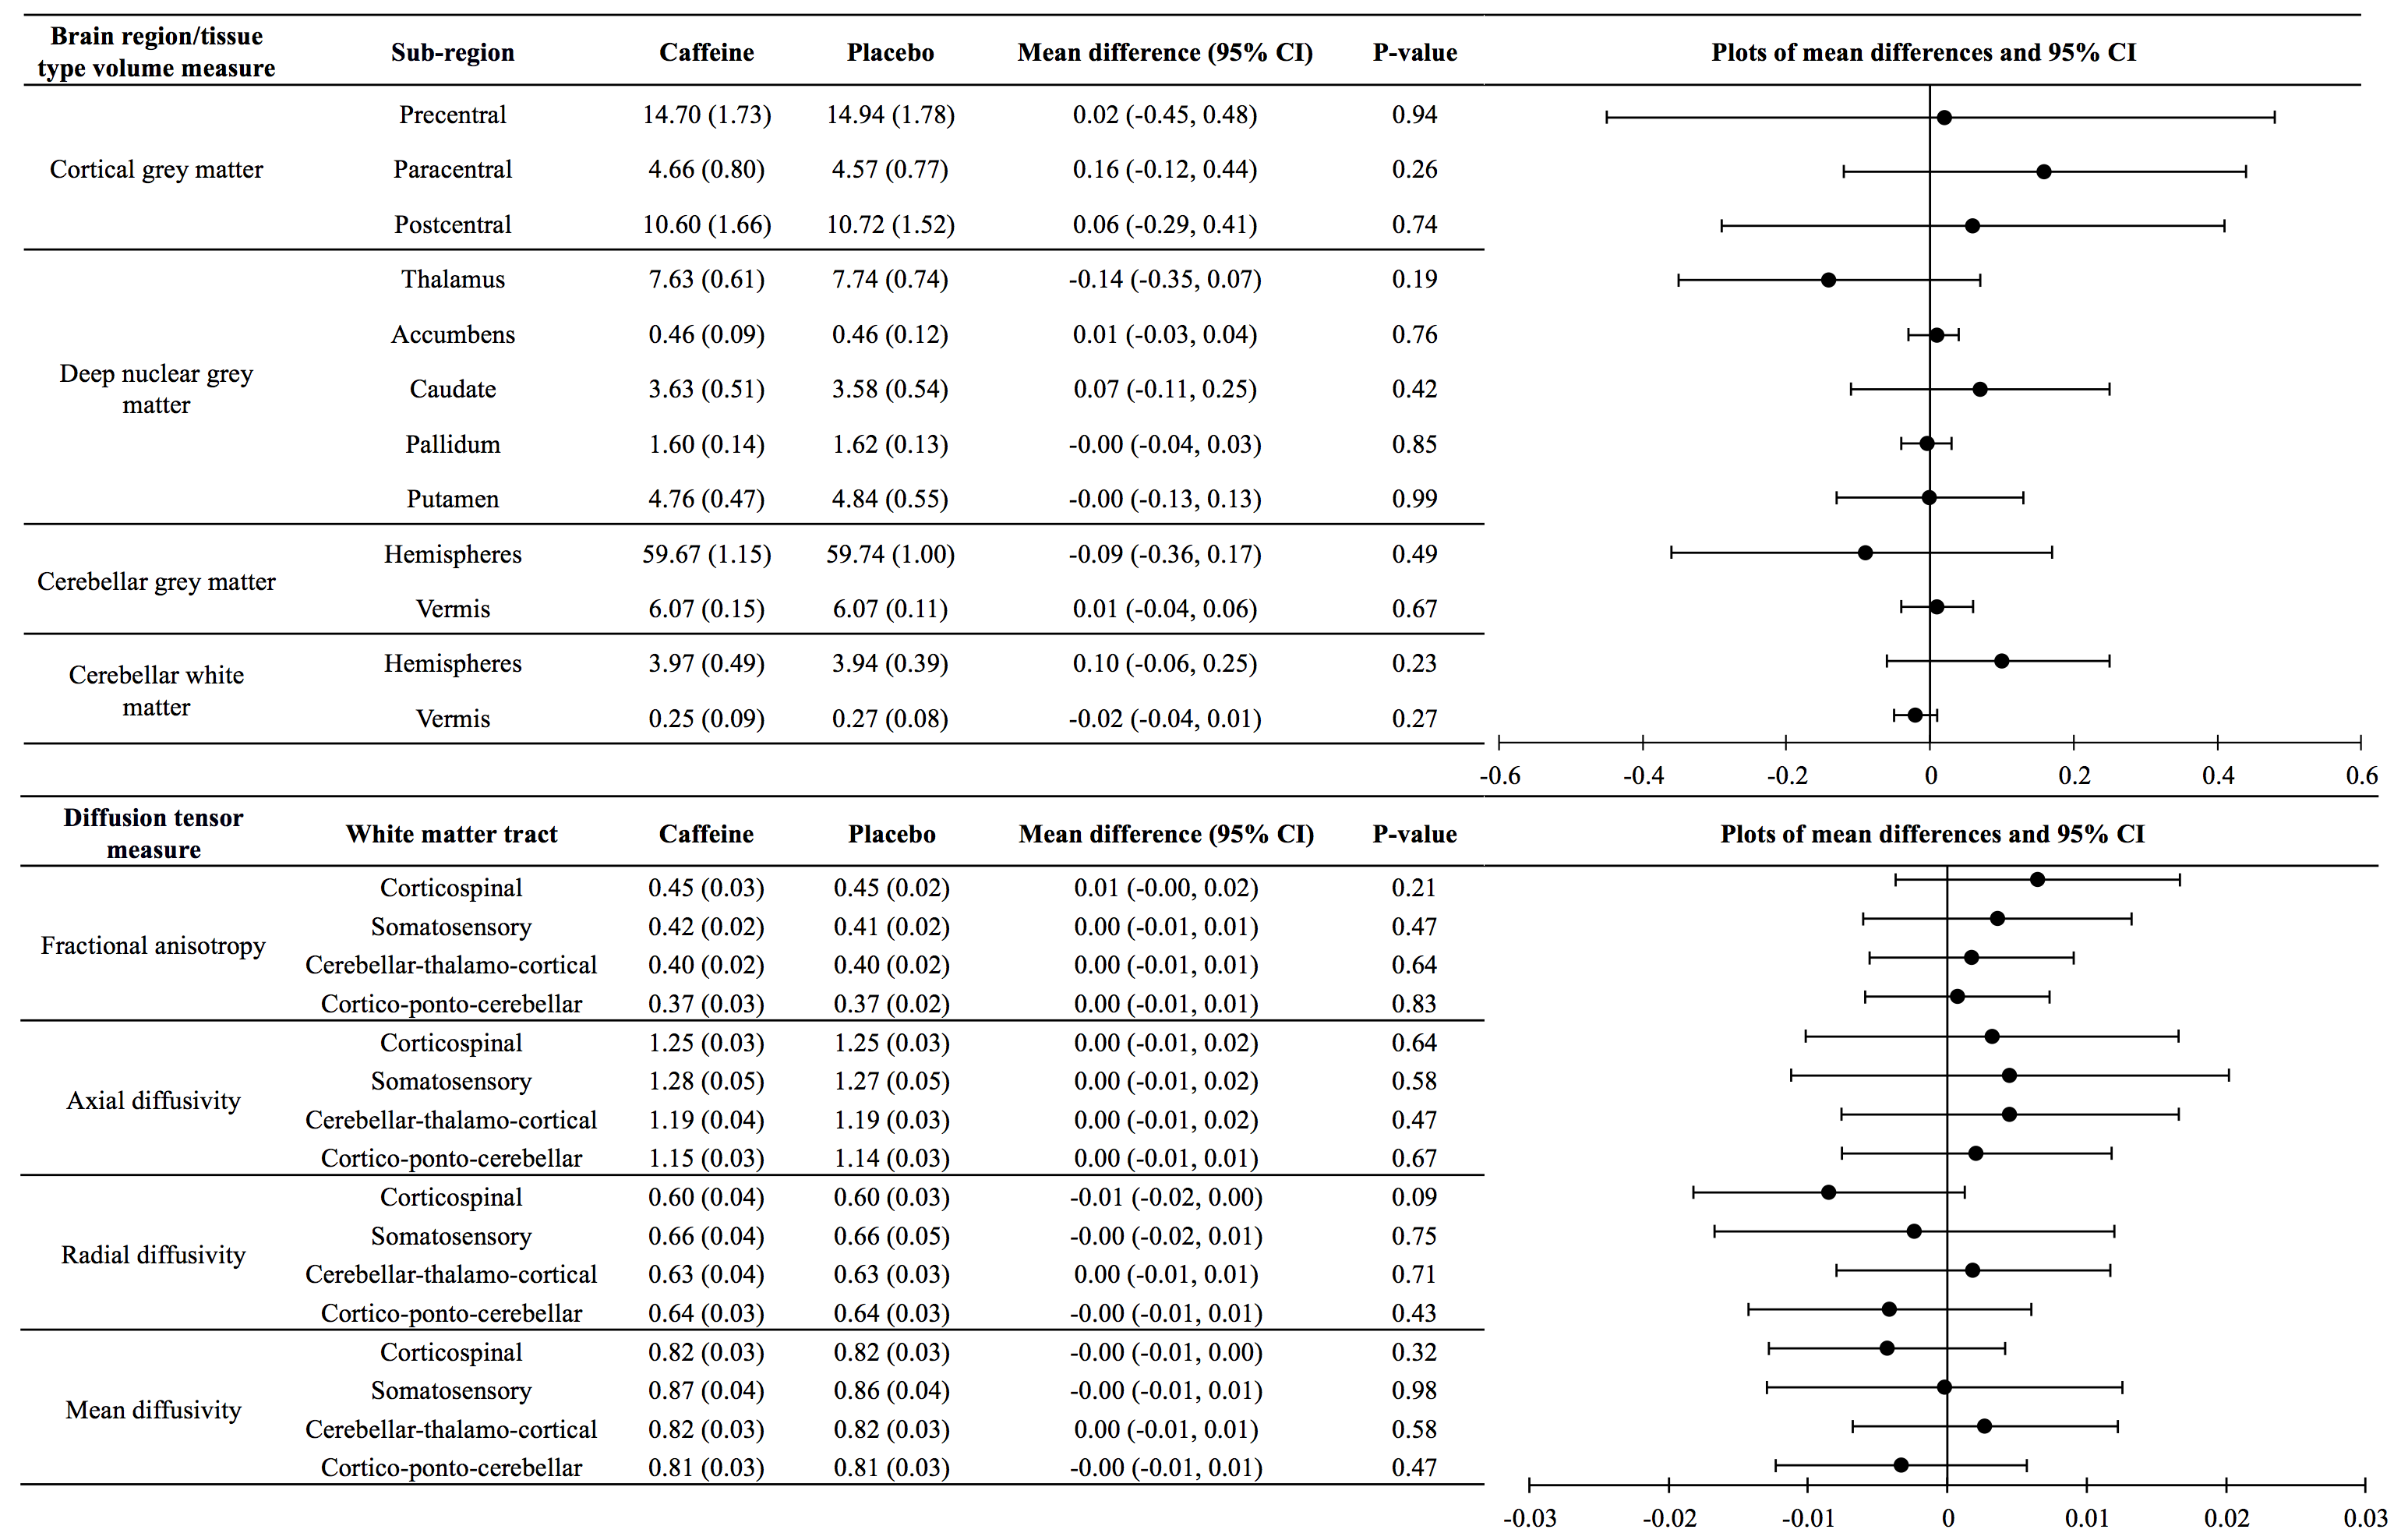
Figure 2. Brain regions and white matter tracts involved in motor function, at 11 years of age, contrasted between treatment groups.
Data for caffeine and placebo groups are means (standard deviations). Mean differences and P-values are from separate linear regressions adjusted for age at MRI and sex of the child, as well as for total intracranial volume for models with volumes. The plots are visual representations of the mean differences and confidence intervals (CI). Units are for volumes cm3 and for diffusivities x10-3 mm2/s. Data are combined across brain hemispheres as there was negligible evidence of group by hemisphere interactions.
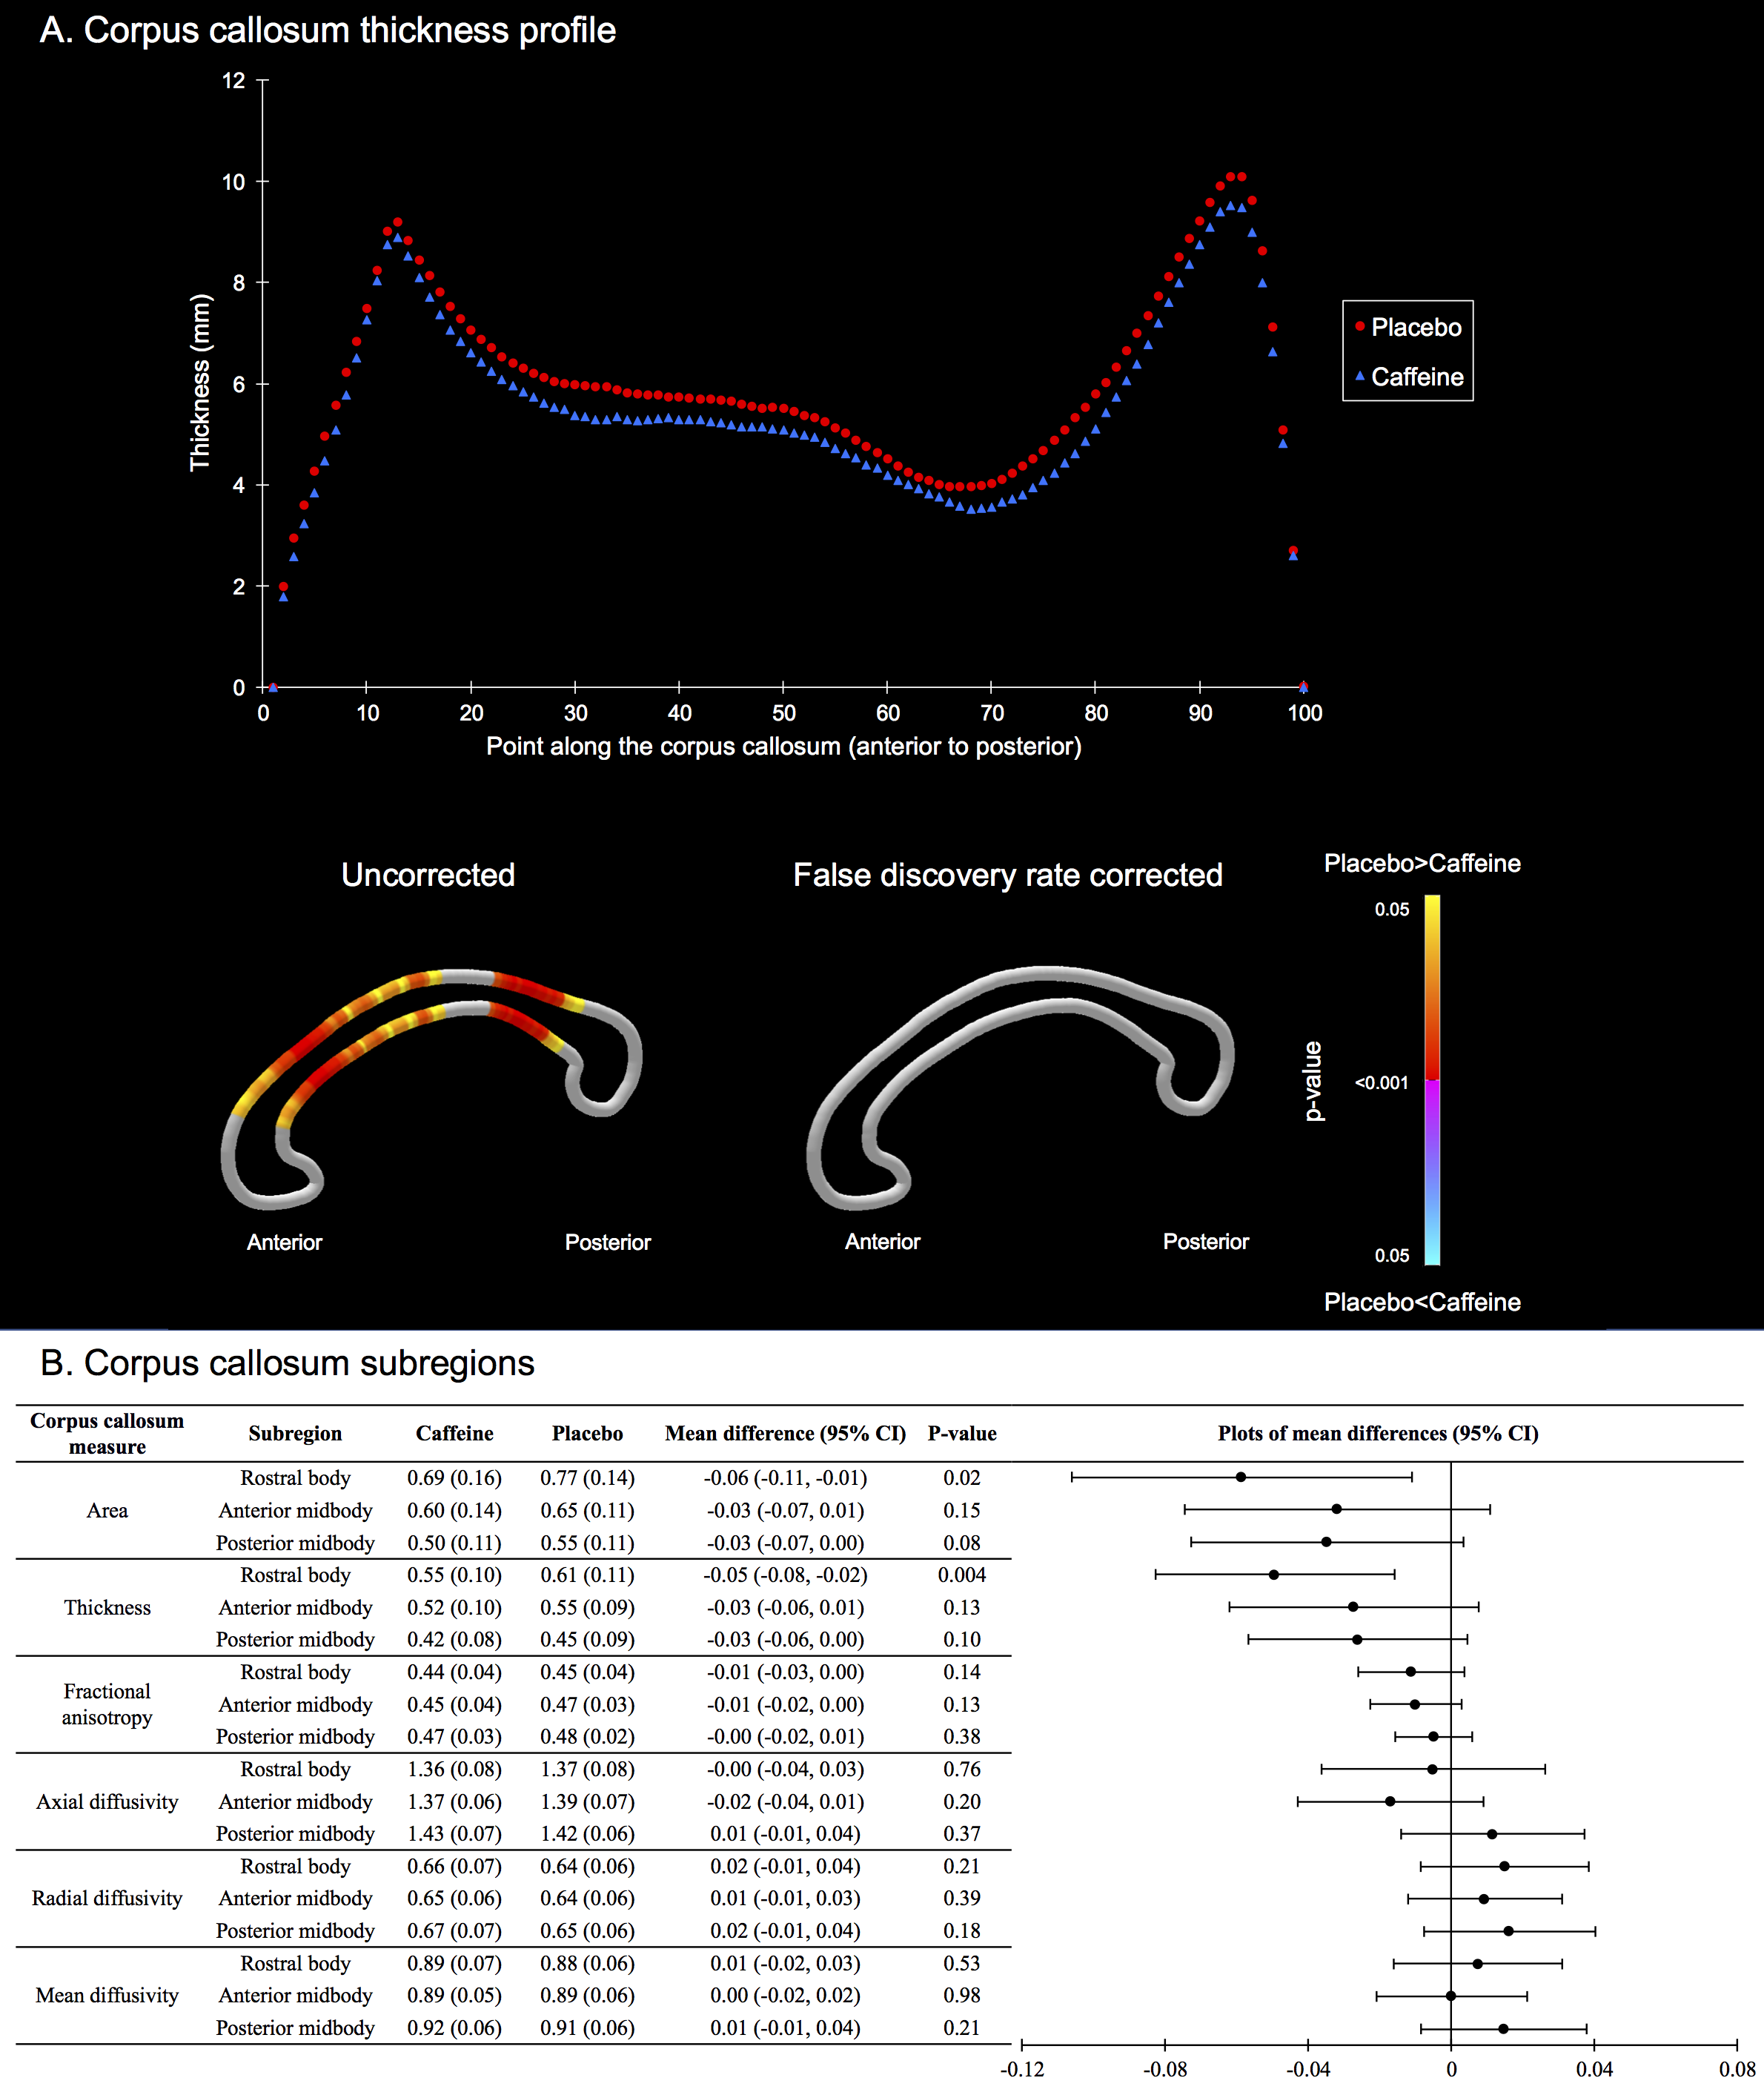
Figure 3. The corpus callosum at 11 years, contrasted between treatment groups.
A. Top: Thickness at 100 points along the corpus callosum; bottom: results of t-tests comparing thickness at each point between groups, with colors indicating p-values.
B. Data from subregions. Data for groups are means and standard deviations. Mean differences are from separate linear regressions adjusted for age and sex of the child, as well as for intracranial volume for models with area and thickness. The plots are visual representations of the mean differences and confidence intervals (CI). Units are for areas cm2, thickness cm, and diffusivities x10-3 mm2/s.
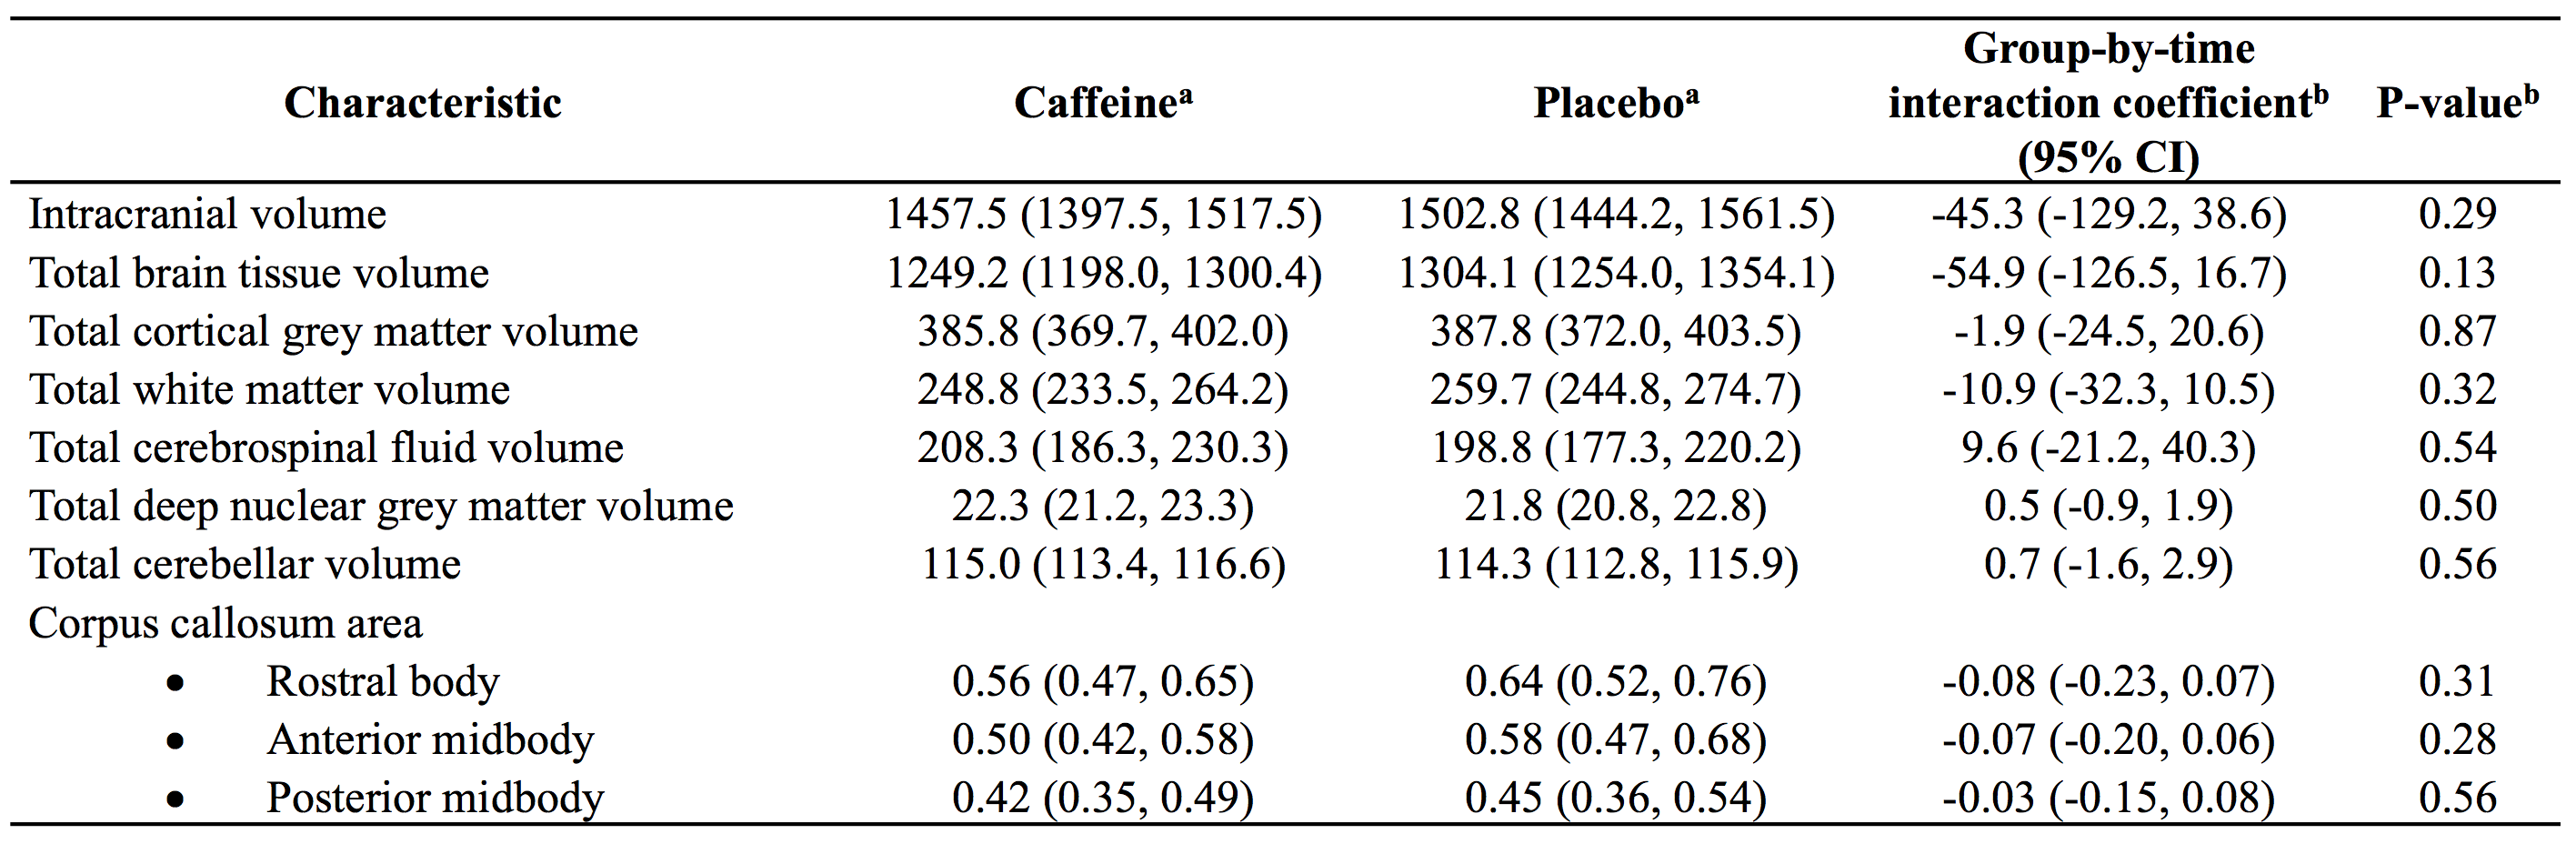
Table 1. Longitudinal changes in brain structures, contrasted between treatment groups.
All data are from separate mixed effects models for each MRI measure.
aData for caffeine and placebo groups are regression coefficients (95% confidence intervals (CIs)), indicating the total change in volume between term and 11 years of age.
bThe interaction coefficients (and p-values) are the difference in the longitudinal volume or area change between treatment groups, adjusted for the age difference between scans, and sex. Units are cm3 for volumes and cm2 for areas.
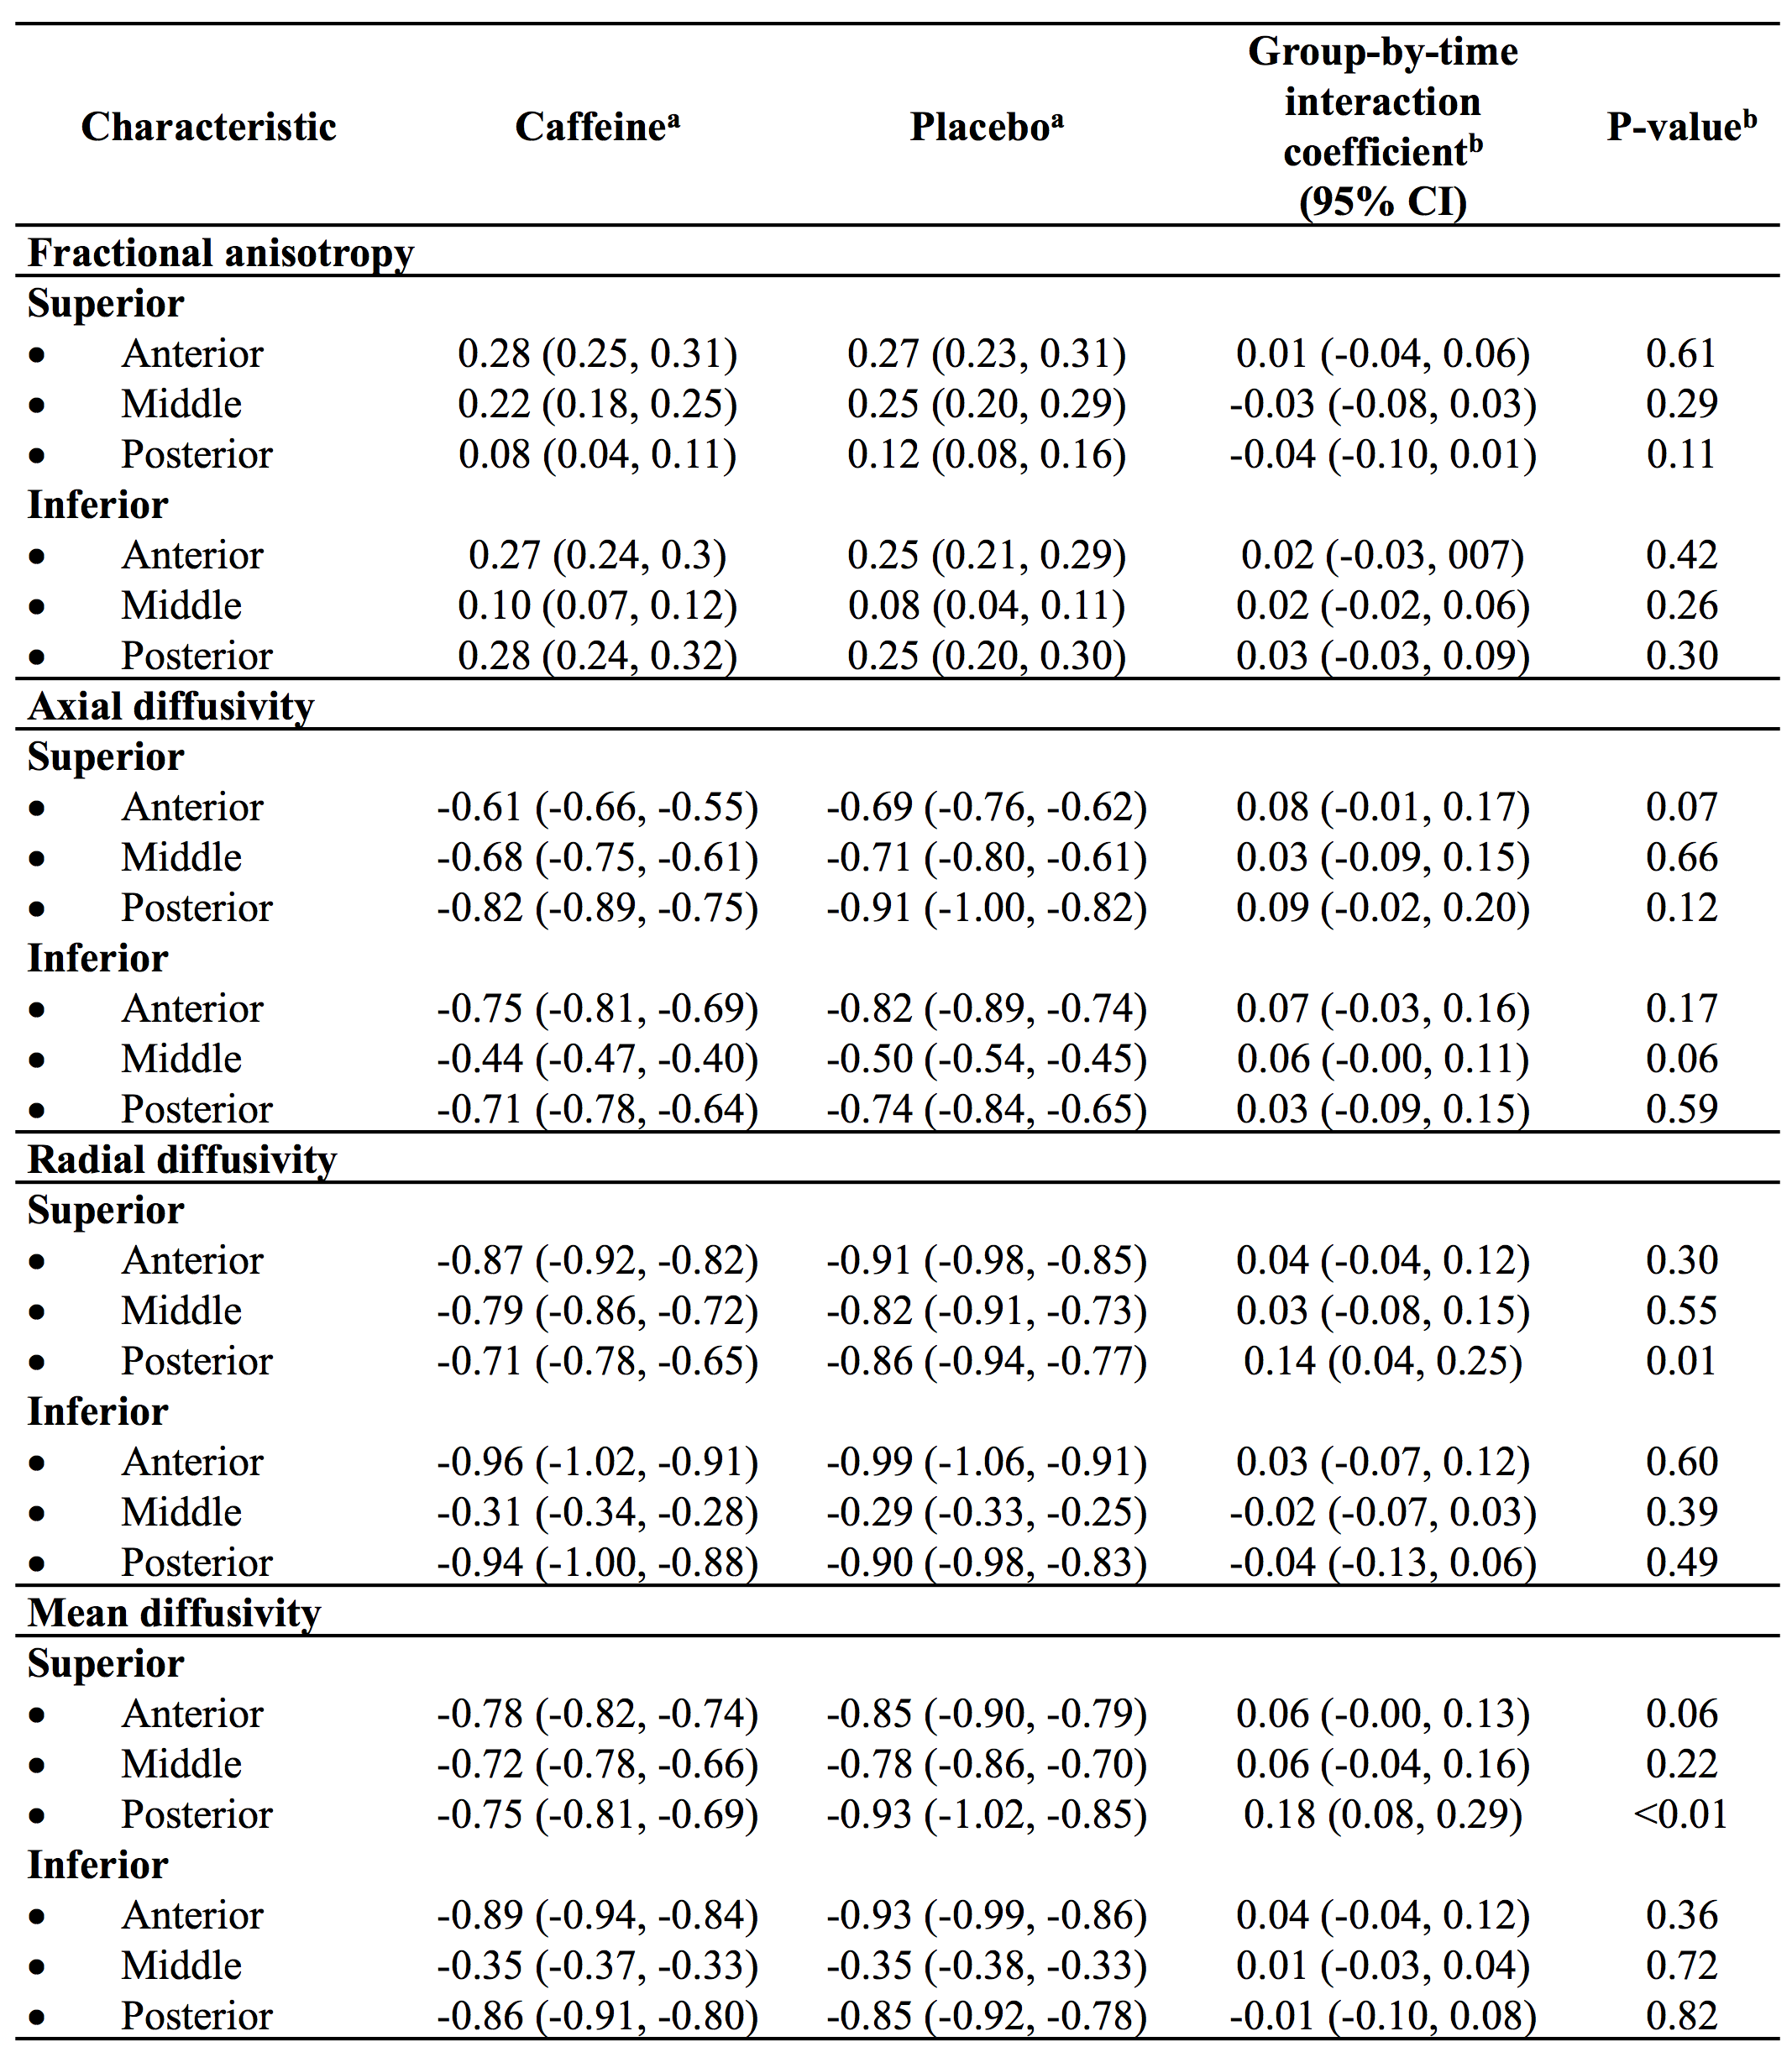
Table 2. Longitudinal changes in diffusion tensor values from white matter regions of interest, contrasted between treatment groups.
All data are from separate mixed effects models for each region and each diffusion measure.
aData are regression coefficients (95% confidence intervals (CIs)), indicating the total change in diffusion values between term and 11.
bThe interaction coefficients (and p-values) are the differences in the longitudinal diffusion change between treatment groups, adjusted for the age difference between scans, and sex. Results are combined across hemispheres as there was negligible evidence of group by hemisphere interactions.
Units are x10-3 mm2/s for diffusivities.