0829
Machine Learning for Prediction of Chemoradiation Therapy Response in Patients with Locally-Advanced Rectal Cancer (LARC) Using Pre- and Early-Treatment Follow-up Multiparametric MRIYang Zhang1, Liming Shi2, Xiaonan Sun2, Tianye Niu2, Ning Yue3, Tiffany Kwong1,3, Peter Chang4, Melissa Khy1, Daniel Chow1, Min-Ying Su1, and Ke Nie3
1Department of Radiological Sciences, University of California, Irvine, CA, United States, 2Department of Radiation Oncology, Sir Run Run Shaw Hospital, Zhejiang University School of Medicine, Hangzhou, China, 3Department of Radiation Oncology, Rutgers-The State University of New Jersey, New Brunswick, NJ, United States, 4Department of Radiology, University of California, San Francisco, CA, United States
Synopsis
A convolutional neural network (CNN) was implemented to predict the response of LARC patients receiving neoadjuvant chemoradiation therapy. The pre-treatment MRI, and the early-treatment follow-up MRI done at 2-3 weeks after the initiation of radiation were used. The MRI protocol included T2, DWI and DCE. A total of 41 patients were studied, with 8 pCR, 27 Tumor Regression Grade 1, and 9 TRG 2+3. The prediction accuracy was 0.71-0.89 for pCR vs. non-pCR; 0.70-0.77 for TRG(0+1) vs. TRG(2+3), not very good due to the limitations of a relatively small dataset. Using manually extracted tumor features in conjunction with neural network classifiers may achieve a higher accuracy.
Introduction:
For patients diagnosed with locally-advanced rectal cancer (LARC), neoadjuvant chemoradiation therapy (CRT) followed by total mesorectal excision (TME) is the standard-of-care treatment procedure. With improved treatment regimens now available, approximately 15% to 27% of patients achieve a pathologic complete response (pCR) [1-2]. This raises a question about the need of performing aggressive TME. An alternative surgical treatment such as sphincter-saving local excision is now accepted for patients who achieve a very good response after CRT and have a low risk of local recurrence [3]. Multi-parametric MRI can provide valuable information to evaluate, as well as predict patient’s response, which can help in choosing the most appropriate surgical procedures. In our previous study, we have shown that the prediction accuracy based on radiomics feature extracted from the pre-treatment MRI can reach 0.8-0.9 [4]. Very recently, another group used similar approach but combined the pre- and post-treatment MRI radiomics information to predict the pCR with an accuracy of 0.97 [5]. Current prognosis studies rely on “-omics” as radiomics, which firstly extracts hundreds or thousands image features and then uses sophisticated statistical analysis to classify the result. Instead, the deep machine learning method such as the convolutional neural network (CNN) can be applied to thoroughly evaluate all information contained in multi-parametric MRI. We applied CNN to both pre-treatment and early-treatment follow-up MRIs for prediction of CRT response by differentiating between patients with pathologic complete responders (pCR) and non-pCR, and between Good Response (GR) and non-GR.Methods:
A total of 41 patients (mean age 59, 29 male and 12 female) with stage T3 and T4 rectal cancer were studied. The chemoradiation treatment protocol included 50 Gy delivered for 25 fractions using IMRT technique and concurrently with capecitabine and oxaliplatin. All patients received MRI 1 to 2 weeks before treatment, and an early-treatment follow-up MRI done at 2-3 weeks after the initiation of the radiation treatment. The MRI was done on a 3.0 Tesla scanner (GE Signa HDxt) using a phased-array body coil. The imaging protocol included T2w, T1w DCE-MRI acquired using a spoiled gradient echo sequence (LAVA), and DWI acquired using a single-shot echo planar imaging sequence (SSEPI). The surgical specimen was examined to decide the pathological response based on the tumor regression grade (TRG): TRG-0 (pCR, no viable cancer cells, N=8, Figure 1), TRG1 (only a small cluster or isolated cancer cells remaining, N=19, Figure 2), and TRG 2 & 3 (with extensive residual cancer, N=14, Figure 3). The GR group is defined as TRG0 + TRG1. A tumor ROI was manually drawn on the DCE images acquired 60 seconds after injection of gadolinium (Gd), and then used to find the smallest bounding box as input into the CNN. All tissues outside the tumor boundary were set to have zero intensity. In order to take the tumor size change into consideration, for each case, the same bounding box size was used both for the pre-treatment study and the post-treatment study. In order to take the signal intensity change into consideration, the DWI and DCE images were both normalized with the same scale. The normalized patches from six sets of images (one T2, two DWI, and three DCE images) were used as inputs into a CNN, the architecture of which is shown in Figure 4. The output was pCR (N=8) vs. non-pCR (N=33); and GR (N=27) vs. non-GR (N=14). To avoid overfitting, the patches were augmented by random Affine transformation. The loss function was cross entropy and the optimizer was Adam with learning rate 0.001 [6].Results:
The prediction accuracy results obtained in 10-fold cross-validation are shown in Table 1. Combining pre-treatment and early-treatment follow-up studies can achieve a higher accuracy compared to using either MRI dataset alone. The prediction accuracy in differentiation between pCR and non-pCR (0.71-0.89) is higher compared to the differentiation accuracy between GR and non-GR (0.70-0.77).Conclusions:
Although the results show that a CNN with appropriate normalization scheme can be implemented to predict the response in LARC receiving chemoradiation therapy, the ranges of prediction accuracy are only fair. This likely relates to the dependence of CNNs on a large dataset for training and validation. The change of tumor size is known as the most reliable response predictor, as shown in the three case examples in figures. In Figure 3, a relative large tumor remaining in the follow-up MRI after completing the radiation is highly suggesting that the tumor will not able to reach TGR of 0 or 1 after receiving additional chemotherapy. Typically, it is difficult to collect complete image datasets from patients receiving neoadjuvant CRT, and the small case number may limit the accuracy of the CNN analysis.Acknowledgements
This study is supported in part by NIH R01 CA127927 and Rutgers-RBHS precision medicine pilot grant, The Rutgers-Cancer Institute of New Jersey P30 CA072720.References
[1] Maas M, Nelemans PJ, Valentini V, Das P, Ro€del C, Kuo LJ, et al. Long-term outcome in patients with a pathological complete response after chemoradiation for rectal cancer: a pooled analysis of individual patient data. Lancet Oncol 2010;11:835–44. [2] Sanghera P, Wong DW, McConkey CC, Geh JI, Hartley A. Chemoradiotherapy for rectal cancer: an updated analysis of factors affecting pathological response. Clin Oncol (R Coll Radiol) 2008;20: 176–83. [3] Borschitz T, Wachtlin D, Mohler M, Schmidberger H, Junginger T. Neoadjuvant chemoradiation and local excision for T2-3 rectal cancer. Ann Surg Oncol 2008;15:712–20. [4] Nie K, Shi L, Chen Q, Hu X, Jabbour SK, Yue N, Niu T, Sun X. Rectal Cancer: Assessment of Neoadjuvant Chemoradiation Outcome based on Radiomics of Multiparametric MRI. Clin Cancer Res. 2016 Nov 1;22(21):5256-5264. [5] Liu Z, Zhang XY, Shi YJ, Wang L, Zhu HT, Tang ZC, Wang S, Li XT, Tian J, Sun YS. Radiomics Analysis for Evaluation of Pathological Complete Response to Neoadjuvant Chemoradiotherapy in Locally Advanced Rectal Cancer. Clin Cancer Res. 2017 Sep 22. [Epub ahead of print] [6] Kingma D, Ba J. Adam: A method for stochastic optimization. arXiv preprint arXiv:1412.6980. 2014 Dec 22.Figures
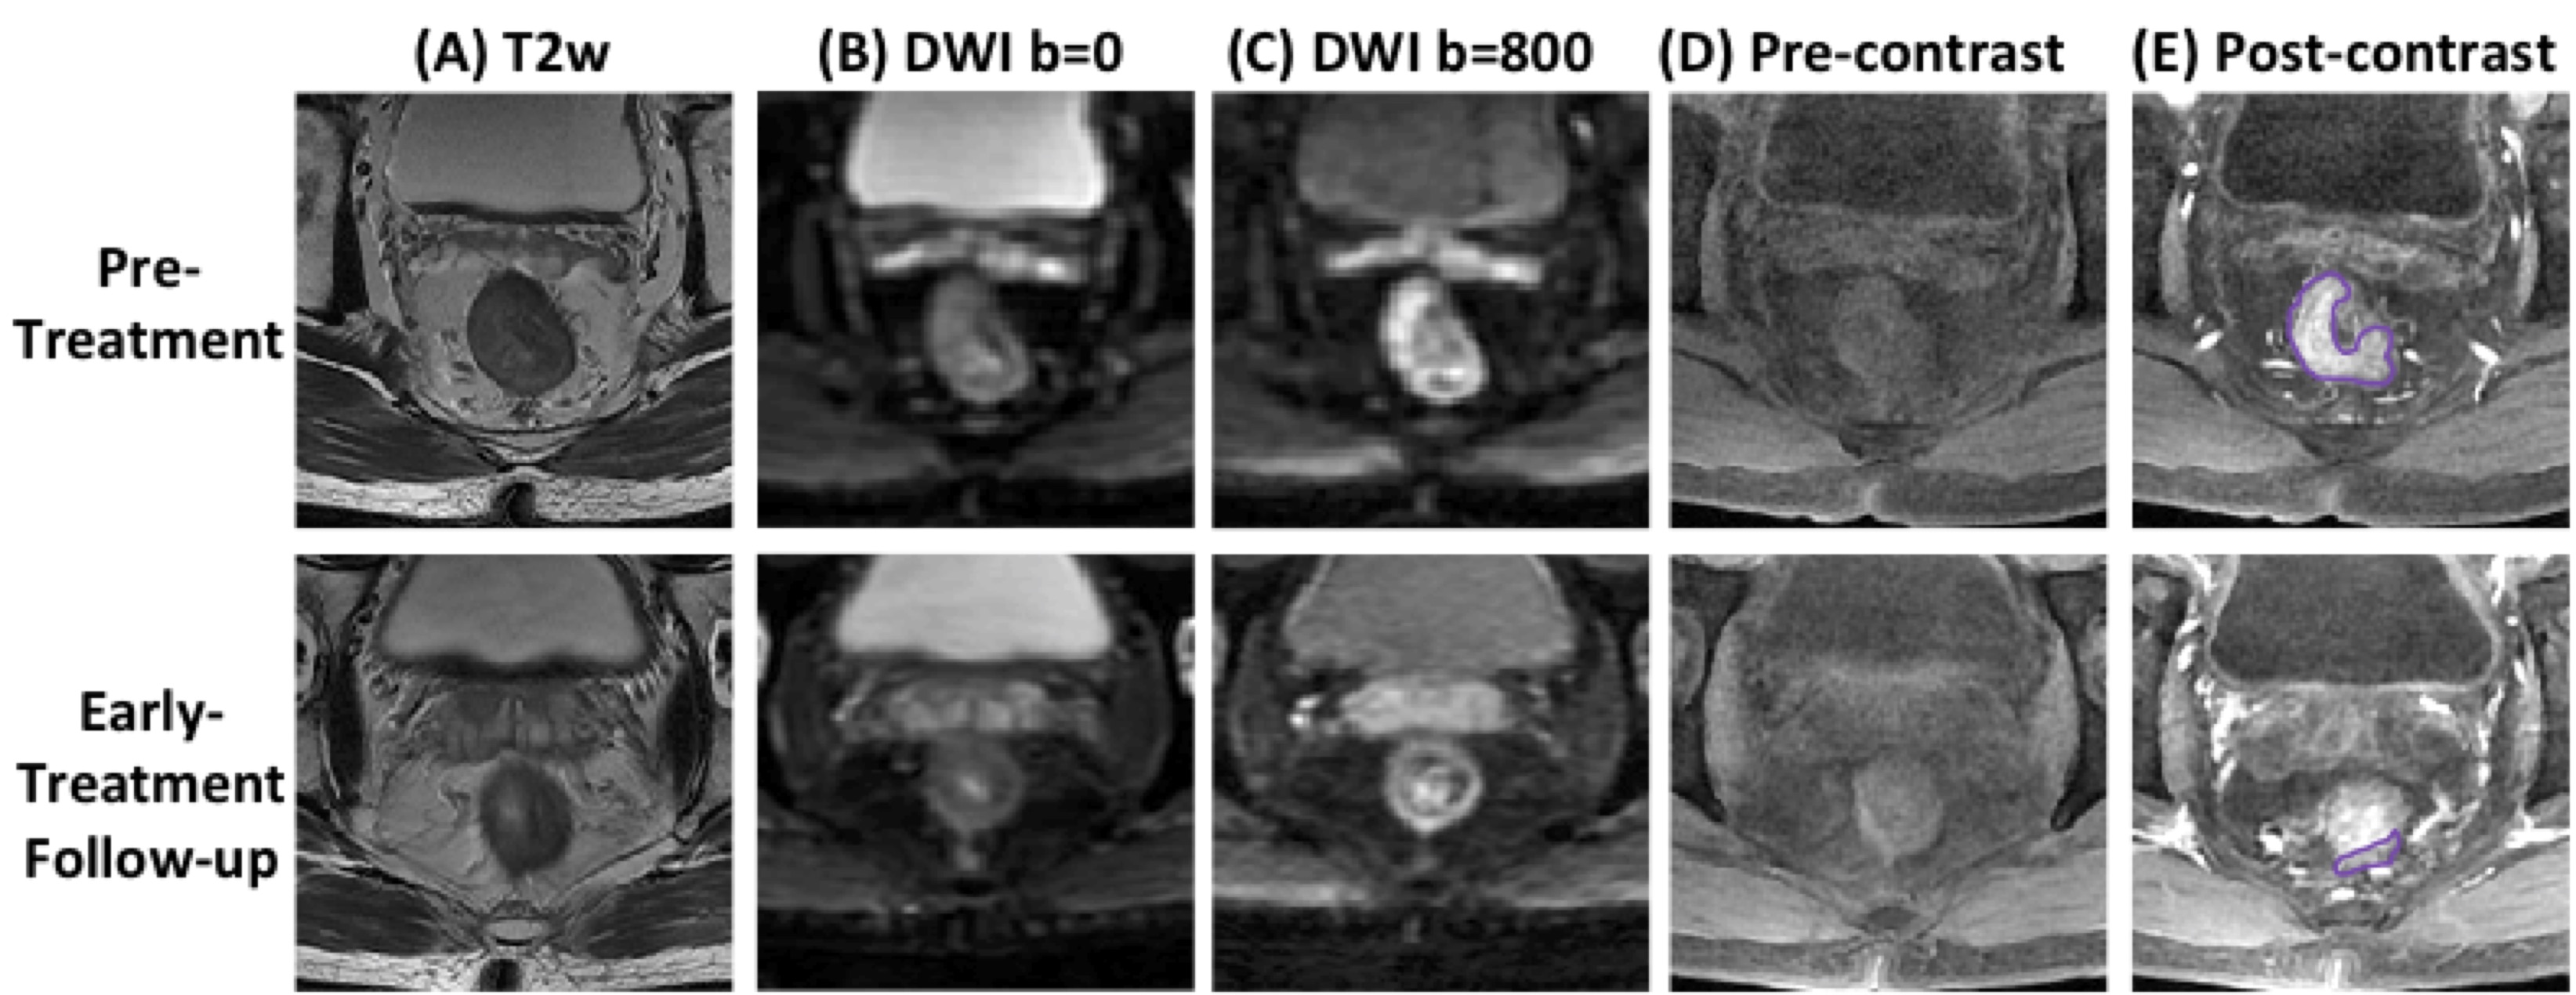
Figure
1: A
pCR (TRG0) case example from a 56-year-old
male
patient, with mid-rectum cancer. Images at a
corresponding location in the pre-treatment and early-treatment follow-up MRI
are shown. (A) T2-weighted
image, (B) the
diffusion-weighted image with b = 0, (C)
the diffusion weighted image with b=800, (D) pre-contrast image (LAVA-1), (E) 60 seconds
post-contrast
image (LAVA-3). The tumor ROI is shown on post-contrast
images. This patient shows a great response, and the tumor size is decreased
substantially in the follow-up study, and eventually achieves pCR after completing
the CRT treatment protocol.
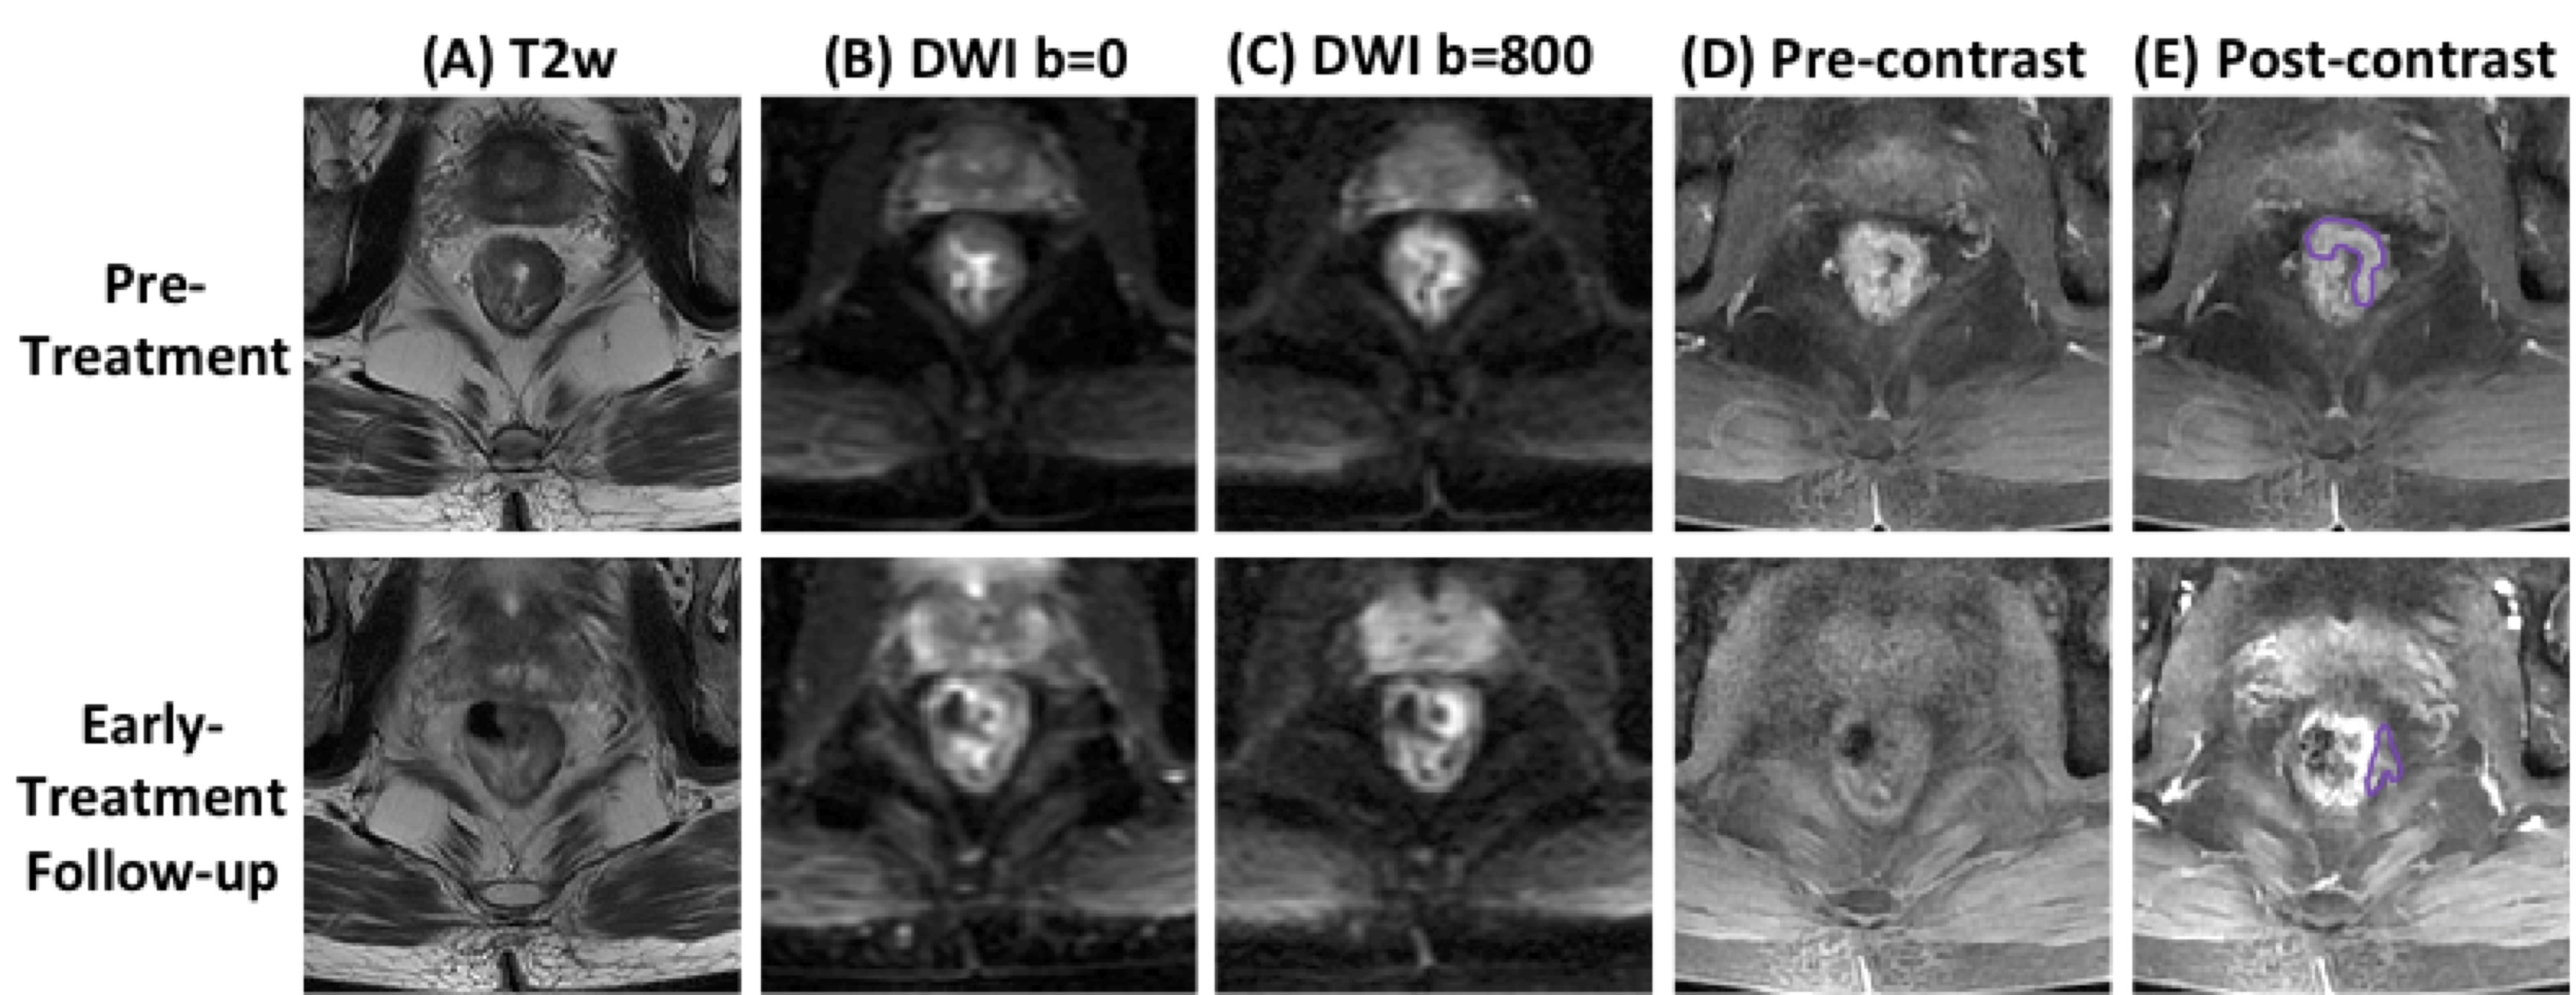
Figure
2: A
GR (TRG1) case example from a 52-year-old
male
patient, with mid-rectum cancer. Images at a
corresponding location in the pre-treatment and early-treatment follow-up MRI
are shown. (A) T2-weighted
image, (B) the
diffusion-weighted image with b = 0, (C)
the diffusion weighted image with b=800, (D) pre-contrast image (LAVA-1), (E) 60 seconds
post-contrast
image (LAVA-3). The tumor ROI is shown on post-contrast
images. This patient shows a good response, and the tumor size is decreased
substantially in the follow-up study, but still has small clusters of residual
diseases left after completing the CRT treatment protocol.
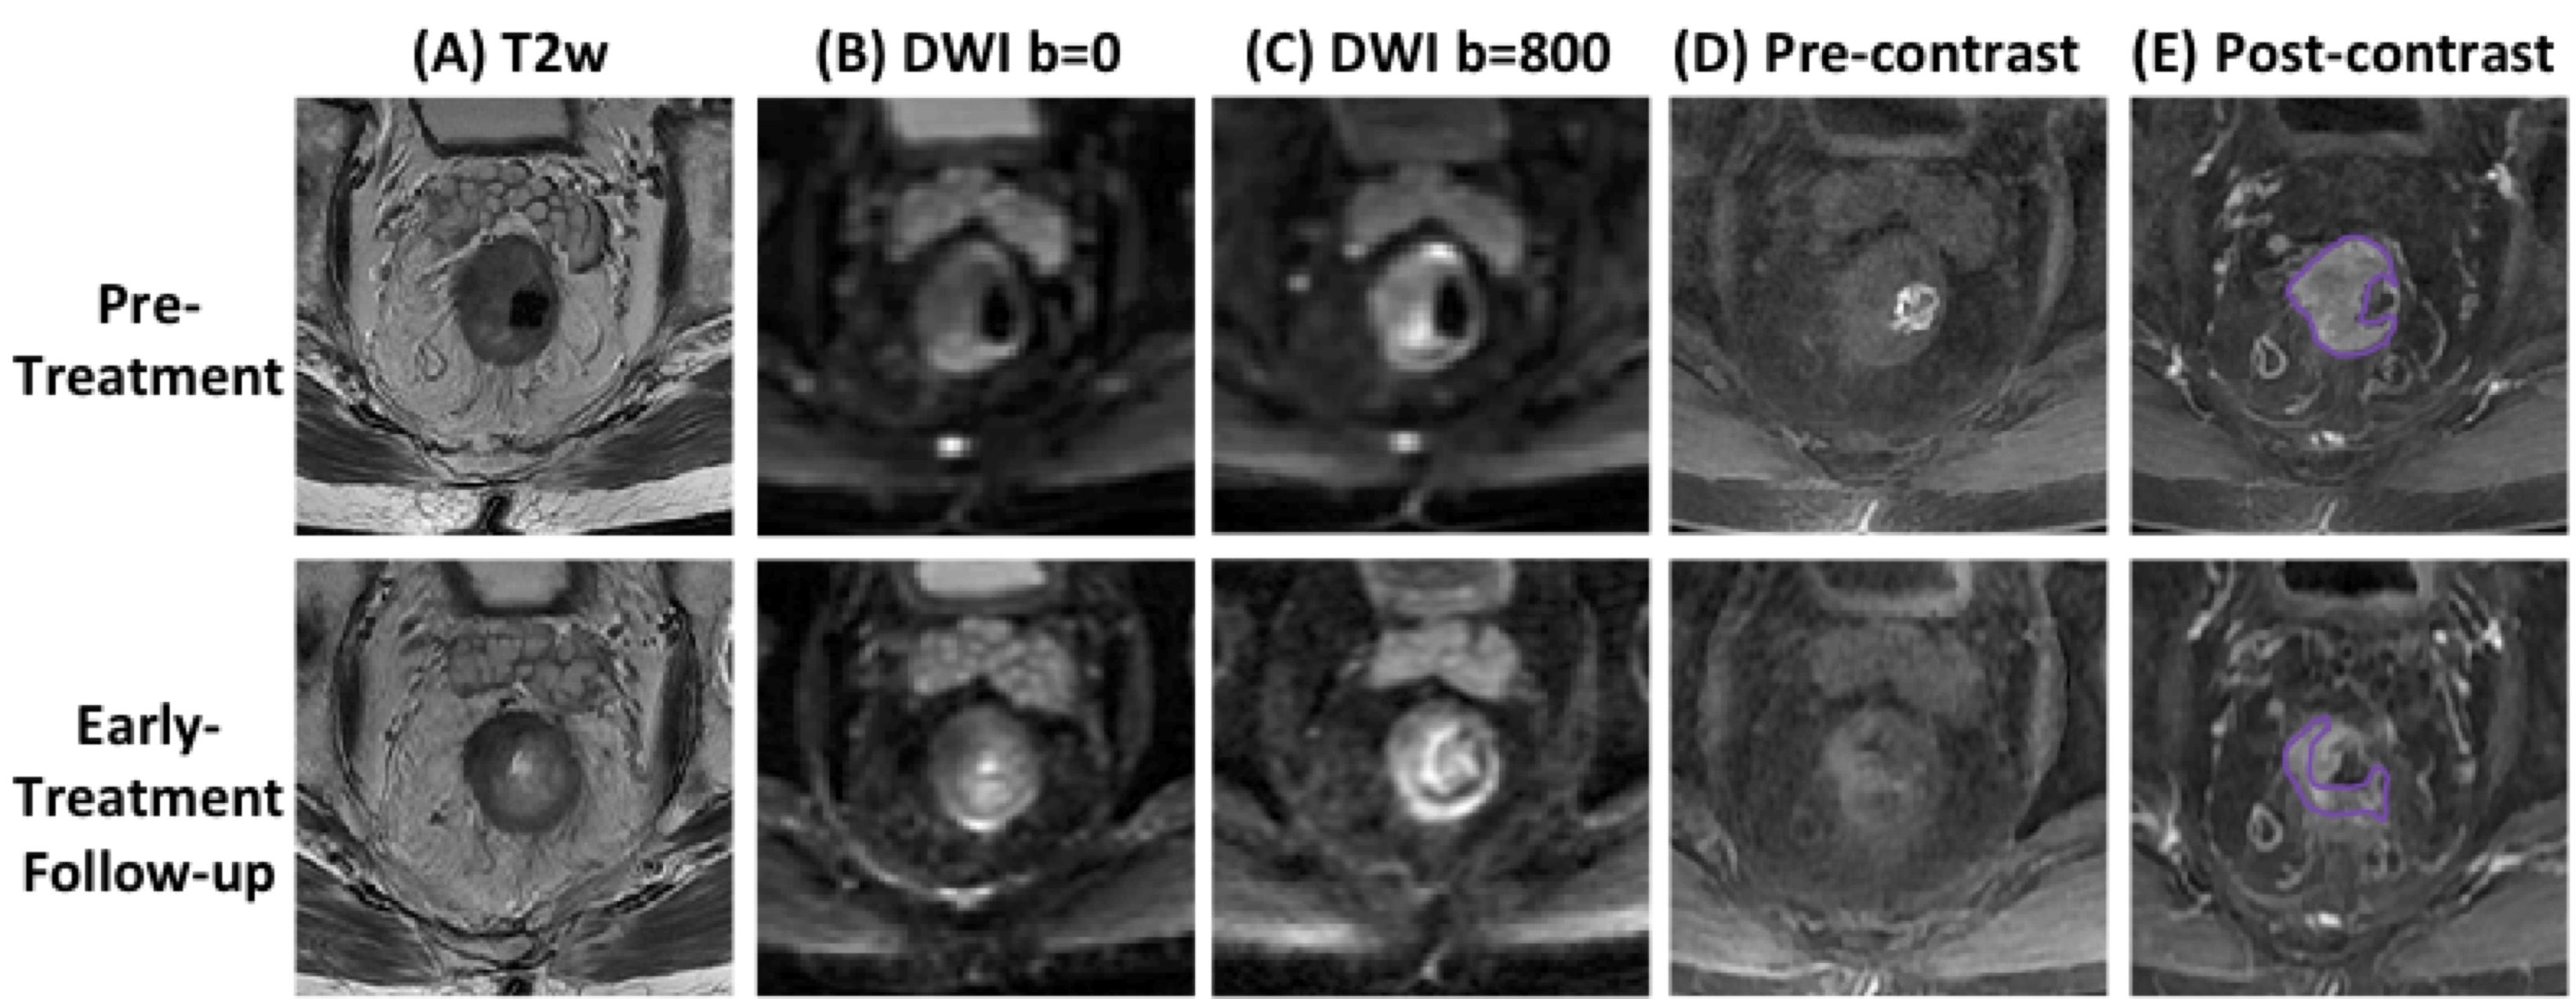
Figure
3: A
non-GR (TRG2) case example from an 80-year-old
male
patient, with lower-rectum cancer. Images at a
corresponding location in the pre-treatment and early-treatment follow-up MRI
are shown. (A) T2-weighted
image, (B) the
diffusion-weighted image with b = 0, (C)
the diffusion weighted image with b=800, (D) pre-contrast image (LAVA-1), (E) 60 seconds post-contrast
image (LAVA-3). The tumor ROI is shown on post-contrast
images. Although the tumor is smaller in the follow-up MRI, a substantial residual
disease is seen and the final pathological response after completing the CRT is
determined as TRG2 (residual cancer remaining but with predominate fibrosis).
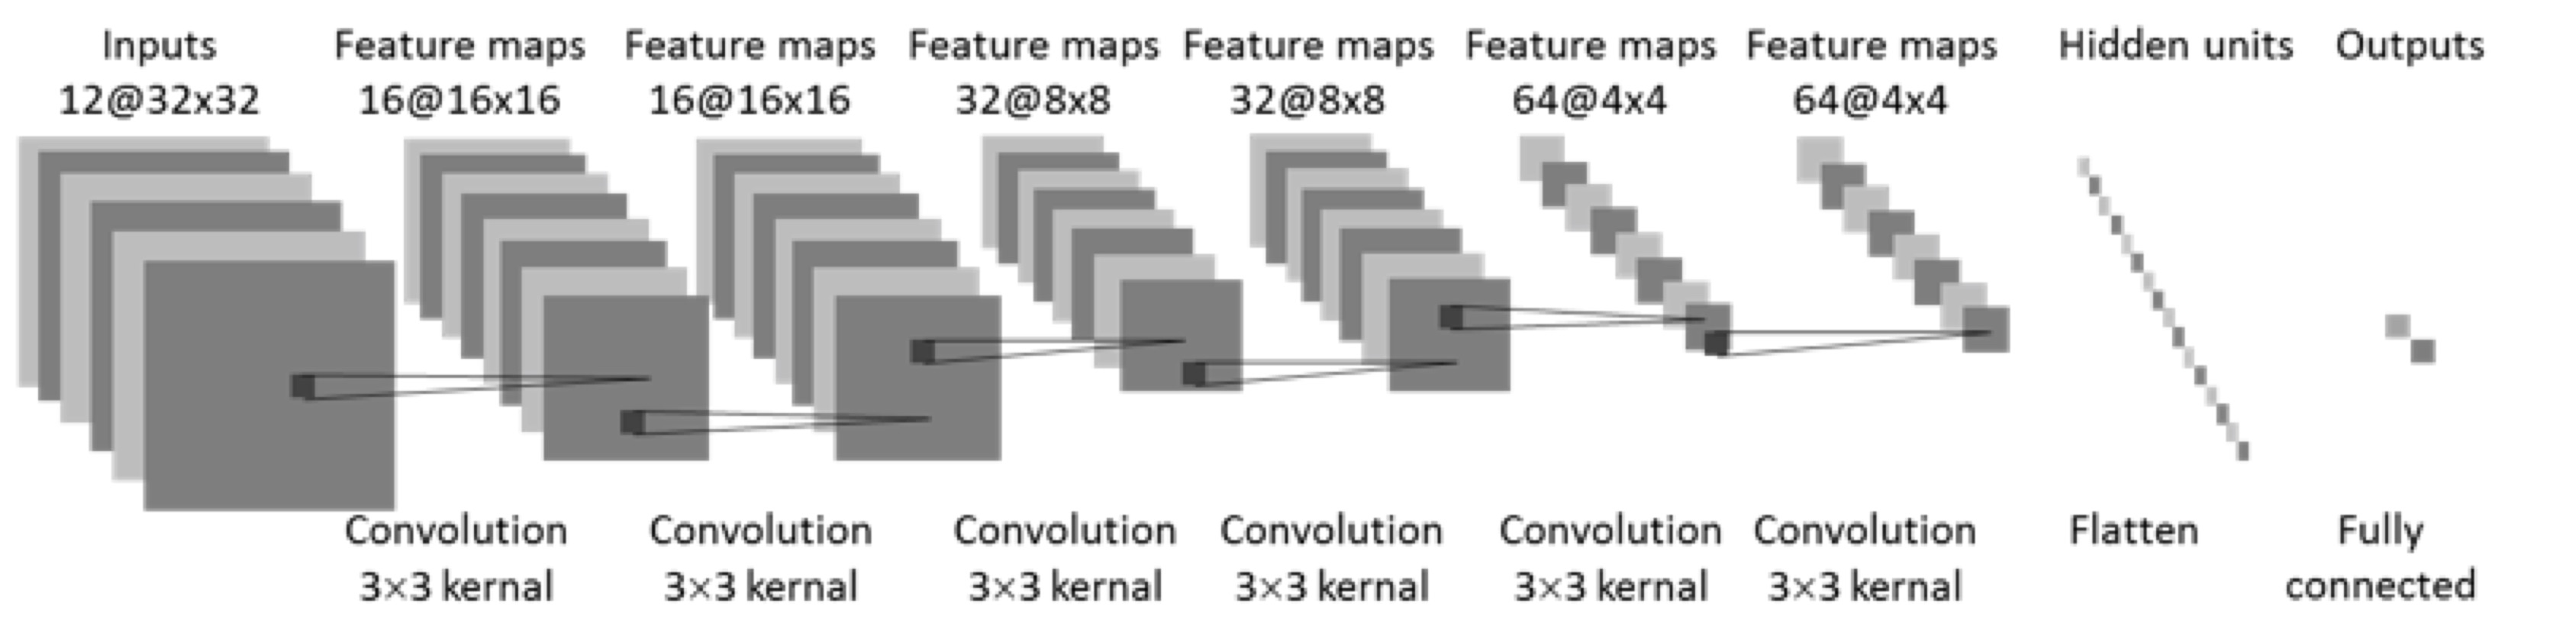
Figure
4: CNN
architecture using combined pre-treatment and early-treatment follow-up MRI. 12
sets of images: T2, two DWI (b=0 and 800), and three LAVA (pre-contrast L1, 15
seconds post-contrast L2, and 60 seconds post-contrast L3) from pre-treatment
and early-treatment follow-up studies are used as inputs. The architecture uses 6 convolutional layers via
3x3 filters followed by the ReLU nonlinear activation function. Dropout at 50% was applied to all
convolutional and fully-connected layers after the second layer. Feature maps
are down sampled to 25% of the previous layer by convolutions with a stride
length of two. A separate analysis is also done by using 6 sets of
pre-treatment, or 6 sets of early-treatment follow-up images only.
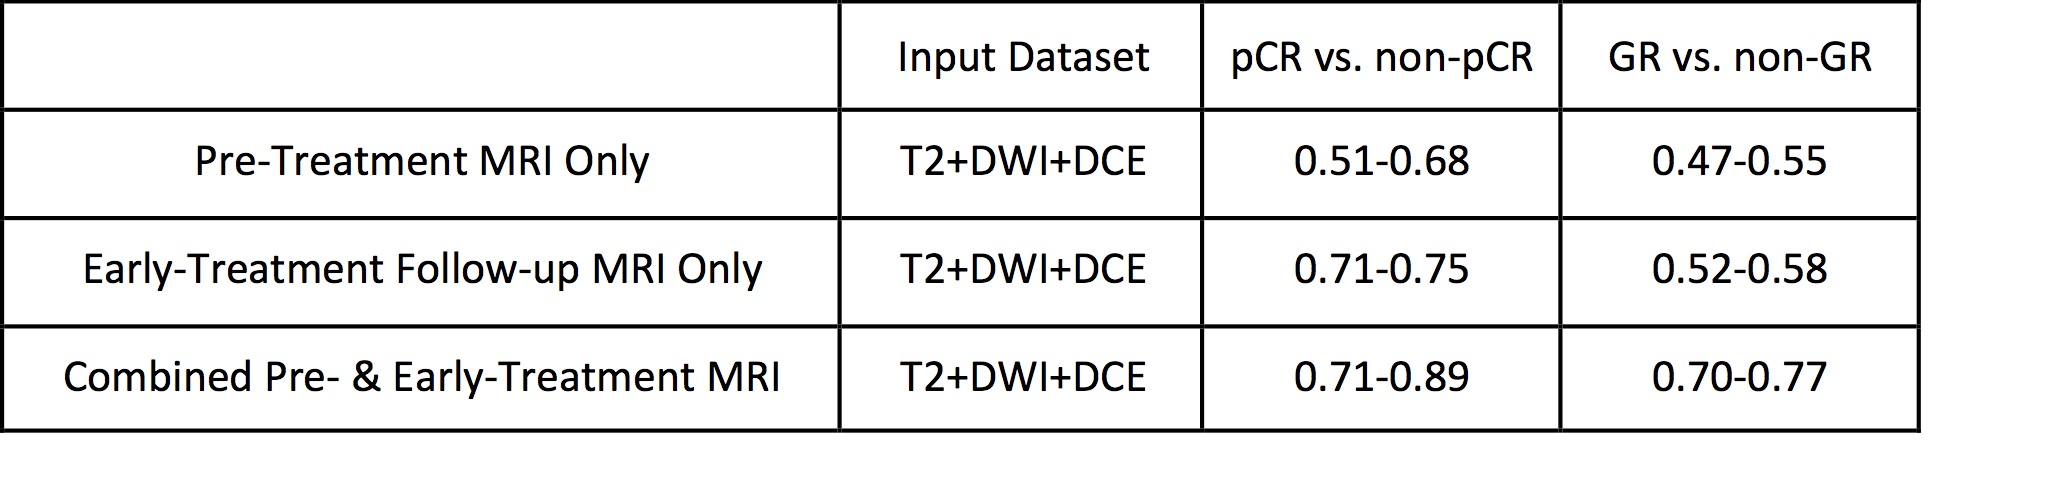
Table 1.
The response prediction accuracy using pre-treatment MRI only, early-treatment follow-up
MRI only, and combined pre- & early-treatment MRI in differentiation of pCR
vs. non-pCR and GR vs. non-GR.