0827
Pancreas perfusion and transit-time measurement using pseudo-continuous ASL1Division of MRI Research, department of Radiology, Beth Israel Deaconess Medical Center, Harvard Medical School, Boston, MA, United States, 2Global MR Applications and Workflow, GE Healthcare, Boston, MA, United States
Synopsis
While there are strong interests in non-contrast pancreatic perfusion measurement, reports of ASL use for this purpose are rare due to several challenges. In this work, we investigate the robustness of background-suppressed-pCASL for pancreatic perfusion, with an emphasis on quantifying blood-flow (PBF) and transit-time (ATT) using multiple-delays ASL. Robust ASL signal was obtained in all volunteers, and ATT was measured to be 1029±89ms. Measured ATT-corrected PBF was 162±12mL/100g.min. Evidence of heterogeneity in ATT and PBF was found, potentially linked to the complex vascular supply and different exocrine/endocrine functions. Hence, pCASL PBF measurement is feasible and holds promise for clinical studies.
Introduction
Non-invasive functional pancreas imaging presents high clinical relevance for the diagnostic, grading or monitoring of neoplastic, metabolic or inflammatory diseases such as diabetes or pancreatic cancer. However, pancreatic perfusion measurement heavily relies on contrast-enhanced methods such as DCE-MRI or CT1,2. Arterial Spin Labeling offers an interesting alternative due to the absence of contrast injection and easy quantification, but only a few reports could be found in the literature using pulsed labeling at 1.5T3,4, due to numerous challenges (e.g. low sensitivity, complex vascular geometry). We propose to investigate the feasibility of measuring pancreatic perfusion and blood-flow (PBF) using background suppressed pseudo-continuous ASL (pCASL) at 3T. An emphasis is also placed on measuring arterial transit-time (ATT) to assess its influence on PBF quantification.Material and Methods
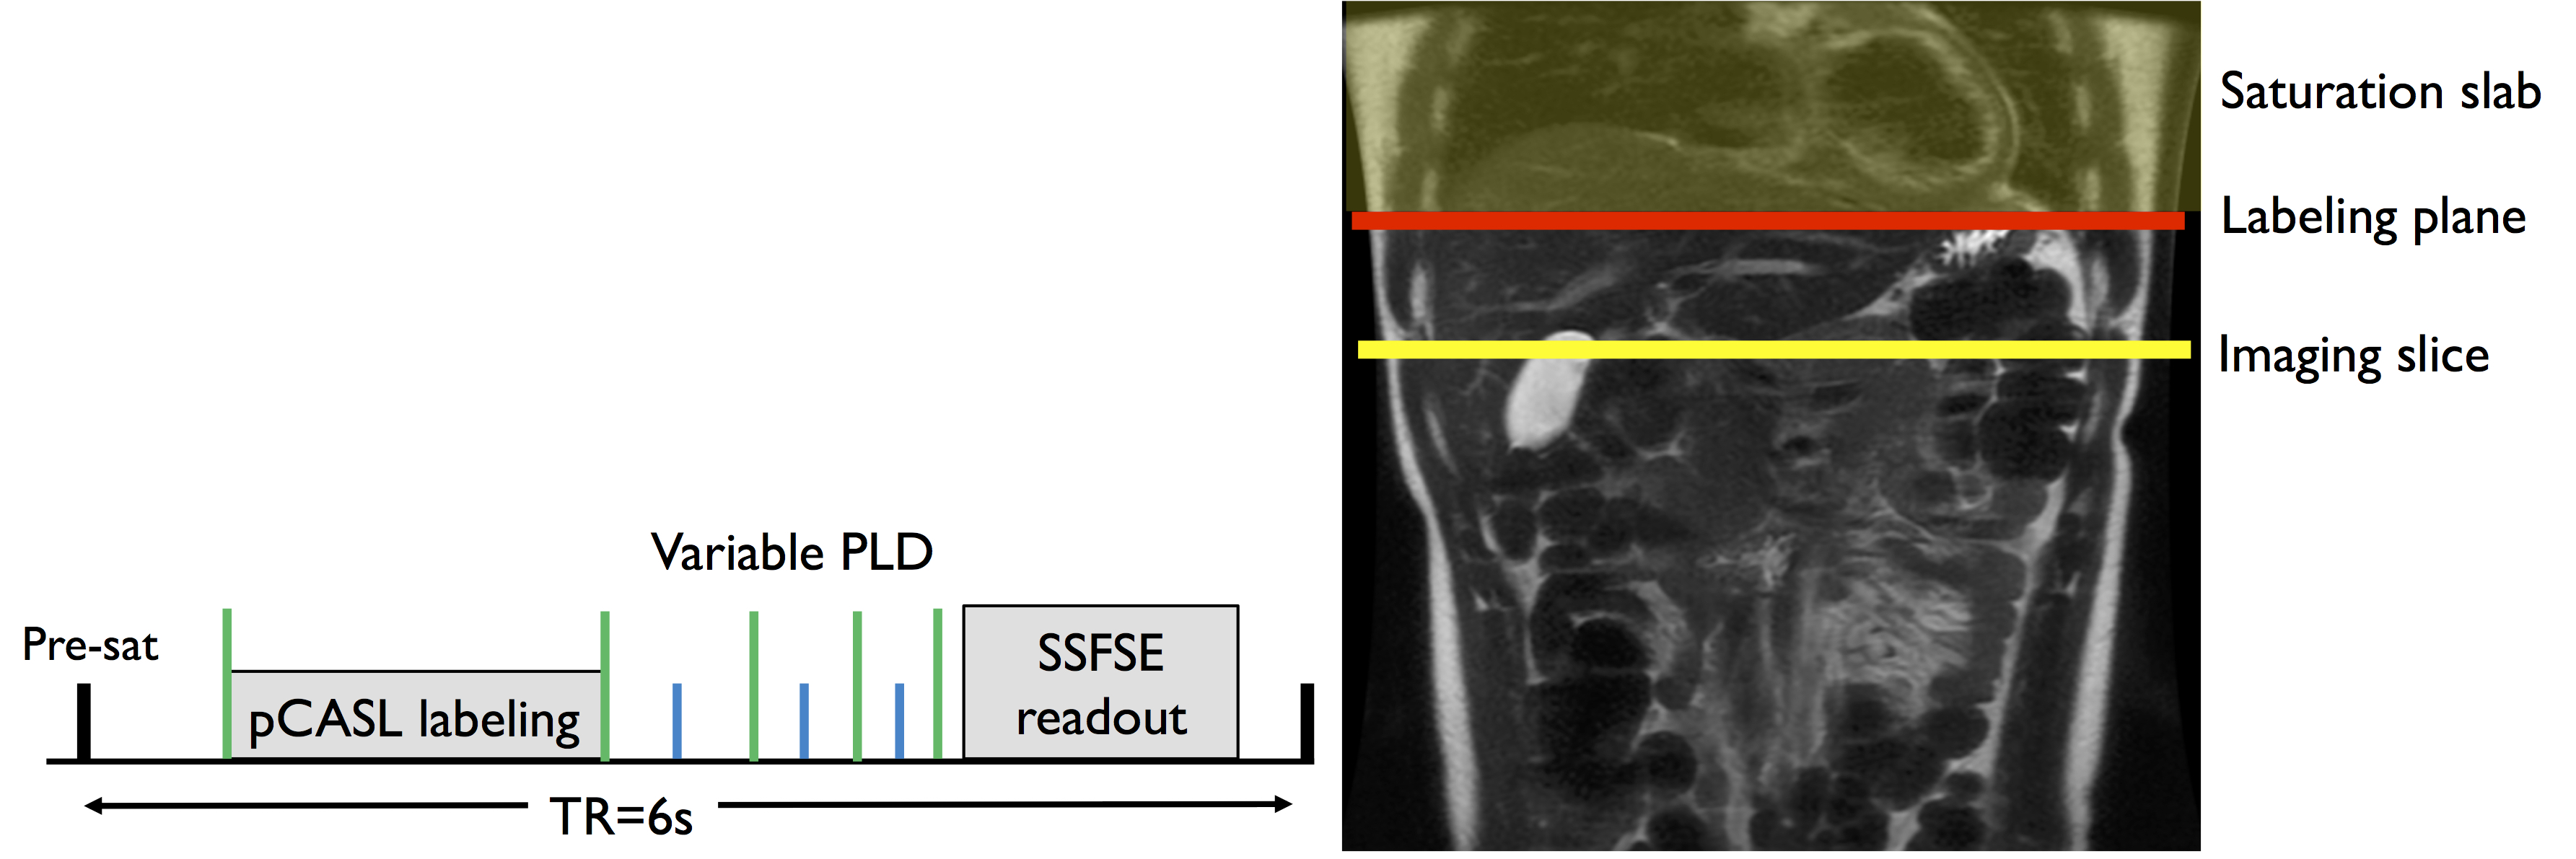
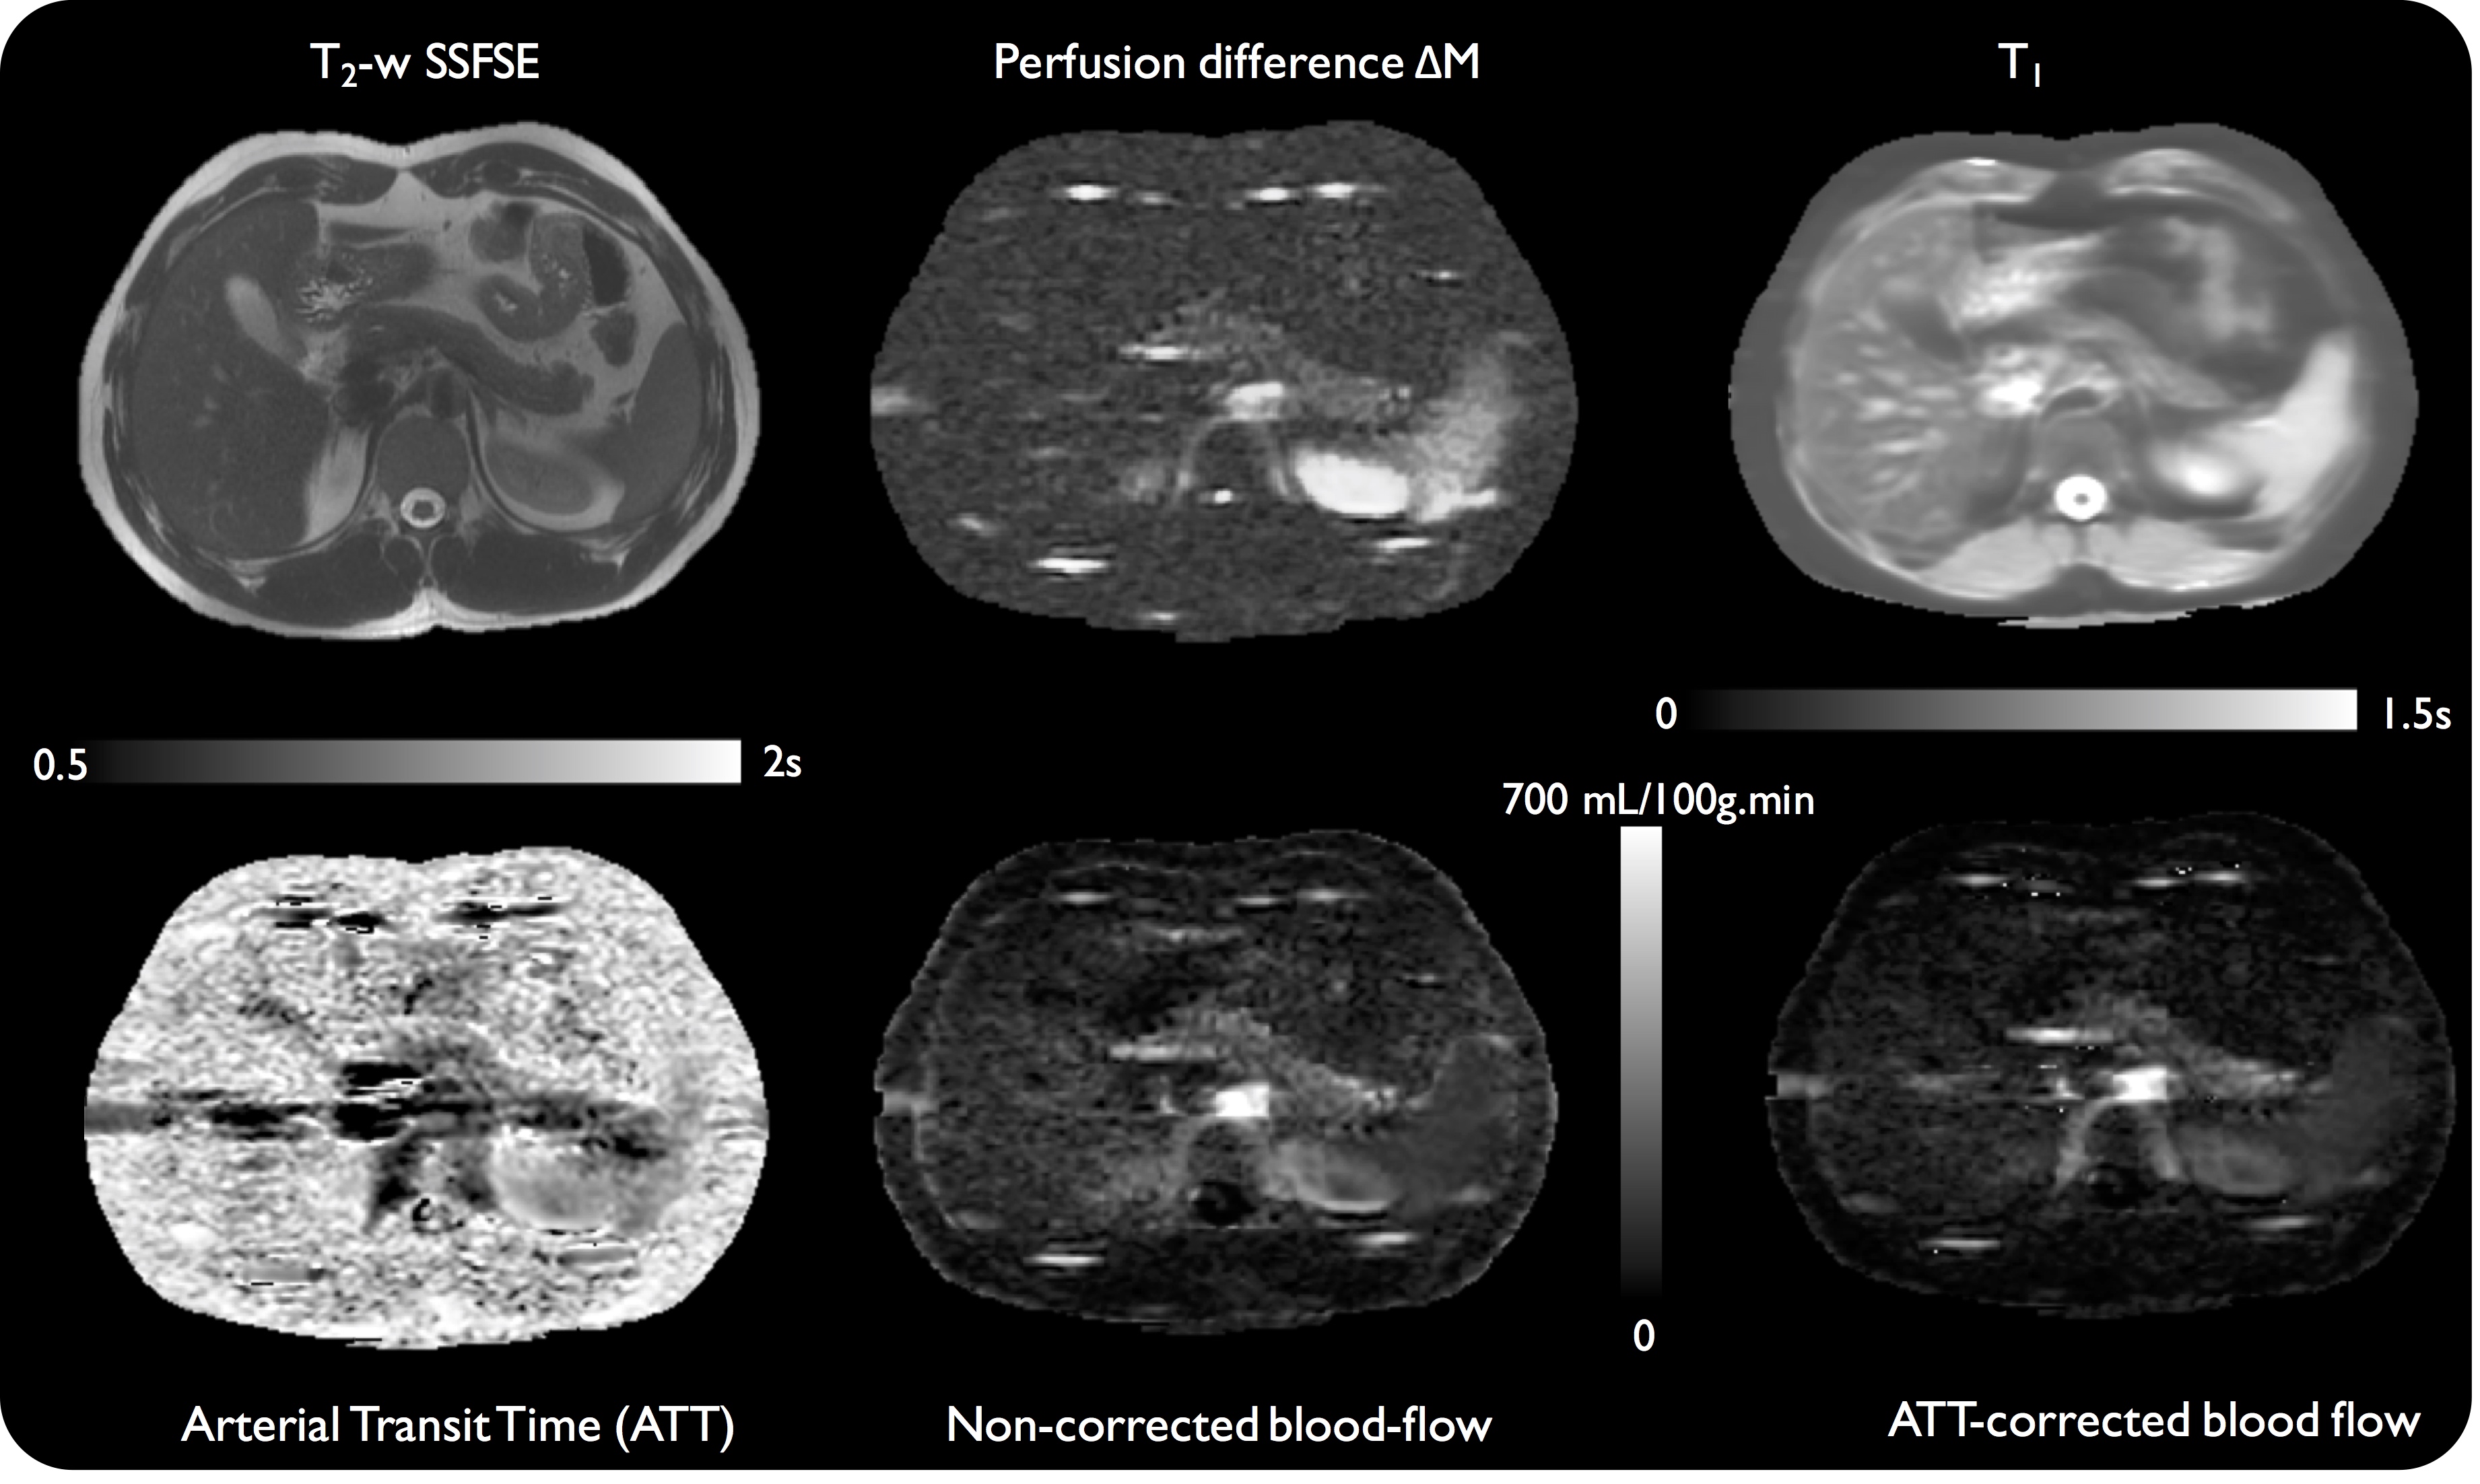
Eight healthy subjects were scanned at 3T (Discovery MR750, GE Healthcare) with a 32-ch body coil. A first group of 4 subjects underwent a single-delay ASL protocol while the remaining 4 underwent a multi-delay protocol. ASL was performed using an unbalanced pCASL scheme5 (repetition rate 1.18ms, average B1=1.4μT, Gmax/Gav=3.5/0.5mT/m)6 for 1.5s followed by either a single 1.5s post-labeling delay (PLD) or multiple (0.7/1/1.5/2s) PLDs. Background suppression was used to suppress the signal of static tissues to <2%7. A single axial slice (fig.1) was acquired using a single-shot-FSE readout (TR/TE=6000/45ms, 128x128 matrix, 2.5x2.5x10mm3). A timed-breathing approach was employed for breathing control8. A total of 3 reference images (PD-w and 2 IR for T1 mapping) and 14 label/control pairs were acquired in 3min.
Raw k-space data were saved and reconstructed offline using MATLAB (MathWorks, Natick, MA). Complex k-space subtraction and averaging was performed prior to Half-Fourier reconstruction and phased coil combination. The weighted-delay approach proposed previously9 was implemented to derive with an optimal time-efficiency ATT, defined as:
$$WD=[\sum_{i=1}^3w_{i}\Delta M(\delta,w_{i})]/[\sum_{i=1}^3\Delta M(\delta,w_{i})]$$
Where wi (i=1,..,3 – the 1s delay was excluded due to errors in BS timing) is the PLD used in each scan, and the perfusion difference for an ATT at the PLD wi. A range of WD was simulated for T1 values found in each image pixel for ATT from 0.7-2s and a fixed blood T1 of 1.66s. Then, the ATT value was obtained by numerically inverting the ATT from the WD (which is a monotonic function of ATT). The PBF was calculated using a standard kinetic model10:
$$dM=2{\times}M_{0}\times\alpha{\times}T_{1,t}{\times}f{\times}e^{-\frac{\delta}{T_{1,b}}}{\times}(e^{-max(w-\delta,0)/T_{1,t}}-e^{-max(\tau+\delta-w,0)/T_{1,t}})/\lambda$$
With dM the perfusion difference, M0 the estimated fully-relaxed magnetization, τ the labeling time, w the PLD, δ the ATT (assumed to be 750ms), T1,b the arterial blood T1, T1,t the estimated tissue T1, λ the blood-tissue partition coefficient (assumed to be 0.9), a the labeling efficiency (=0.6 for BS-pCASL)11. For volunteers with multi-delay ASL and quantified ATT, an additional PBF map was calculated by using the subject-specific estimated ATT map. Additionally, an ATT-corrected PBF was also calculated for the subjects scanned with single-delay ASL using an average pancreatic ATT measured from the multi-delay group. The impact of ATT correction was assessed with a paired t-test.
Results
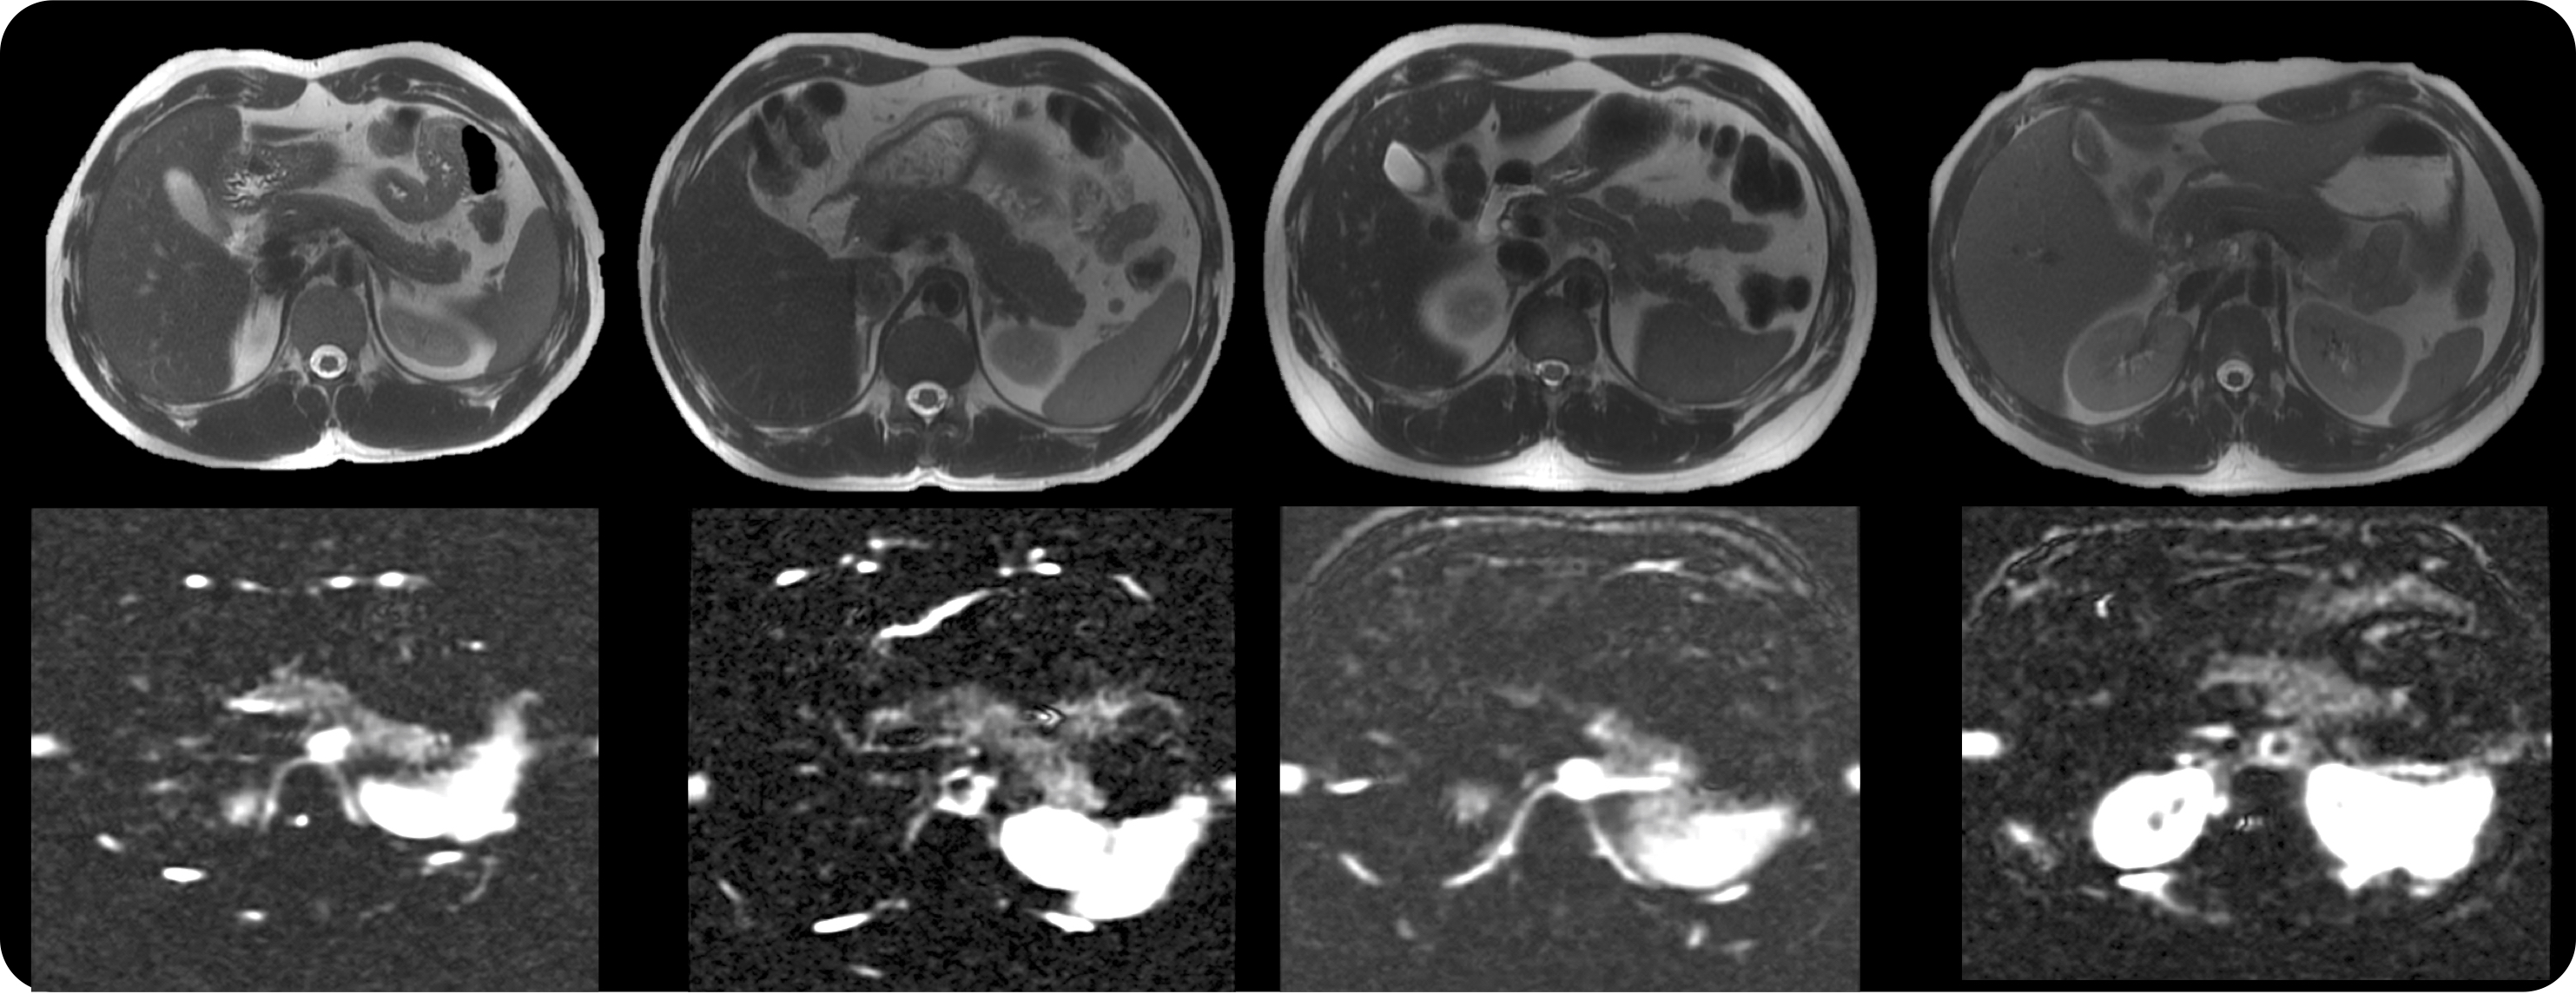
Successful ASL acquisitions were obtained in all volunteers. A reliable perfusion signal could be observed in the pancreas (fig.2) with high SNR collected in 3min. The average non-corrected PBF was measured to be 202±36mL/100g.min consistent with some previous reports4, though within-ROI STD was substantial (up to 40% of the mean value) and evidences of inter-subject variability were observed (≈18%).
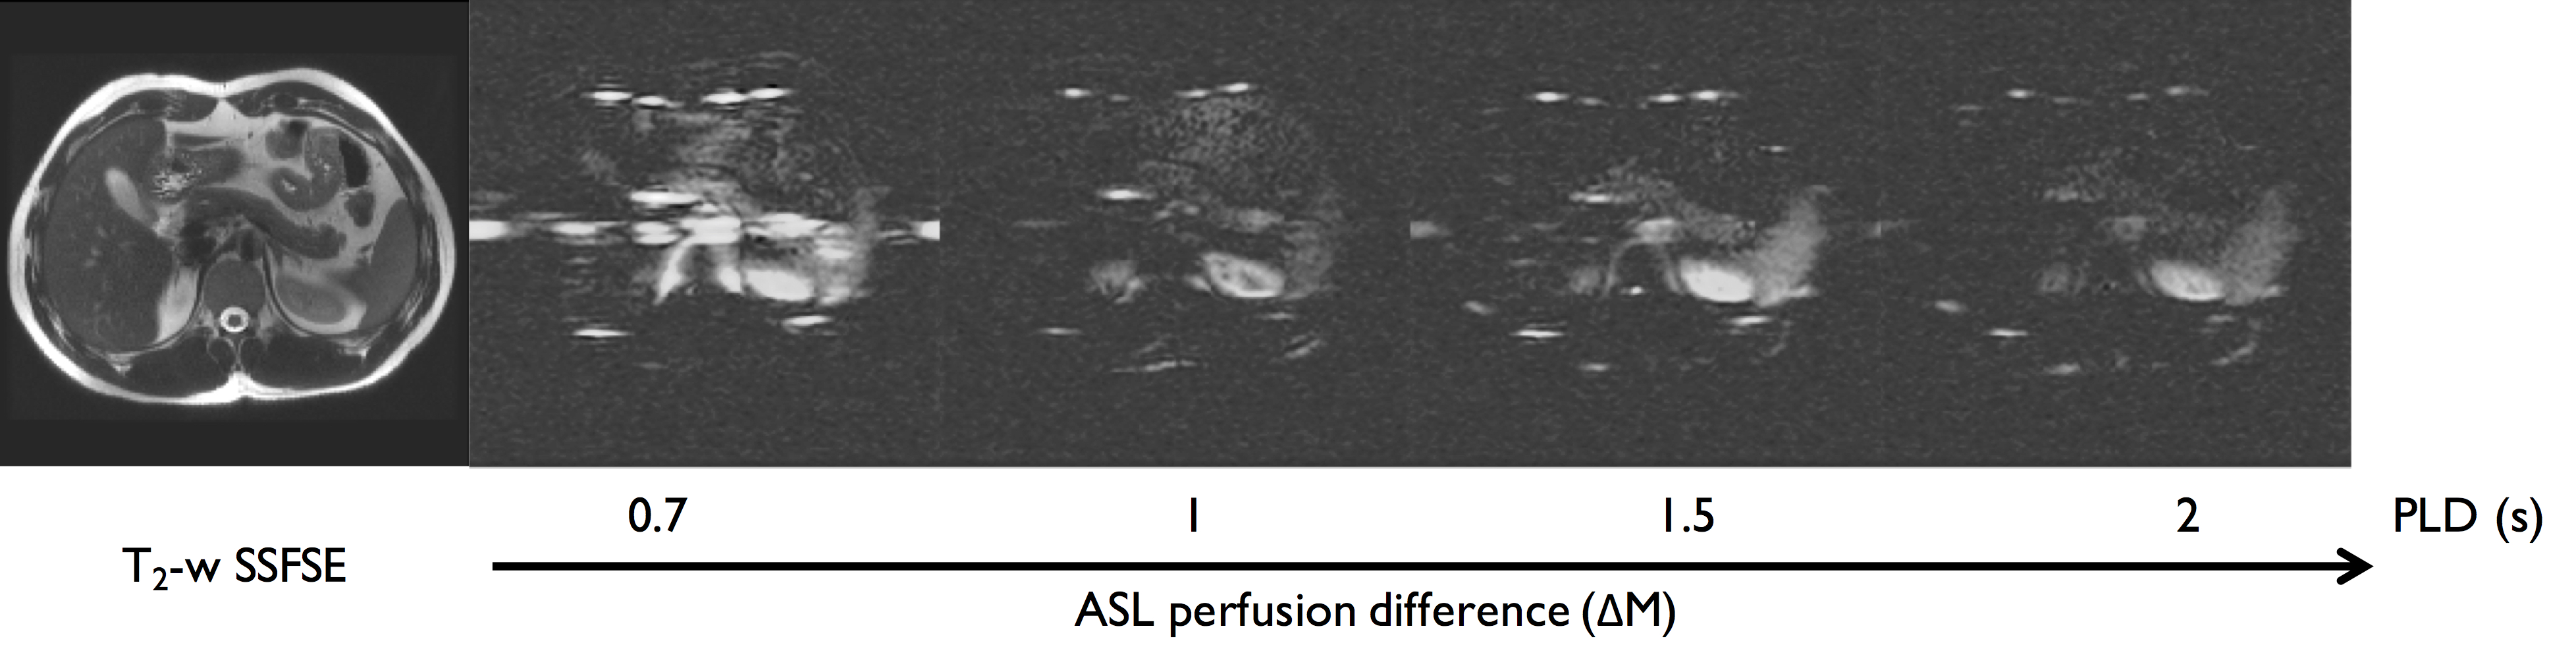
A PLD dependence of the ASL signal could be seen (fig.3). Pancreatic signal can be seen to become more homogeneous at longer delays while shorter delays reveal higher perfusion signal in the pancreatic tail.
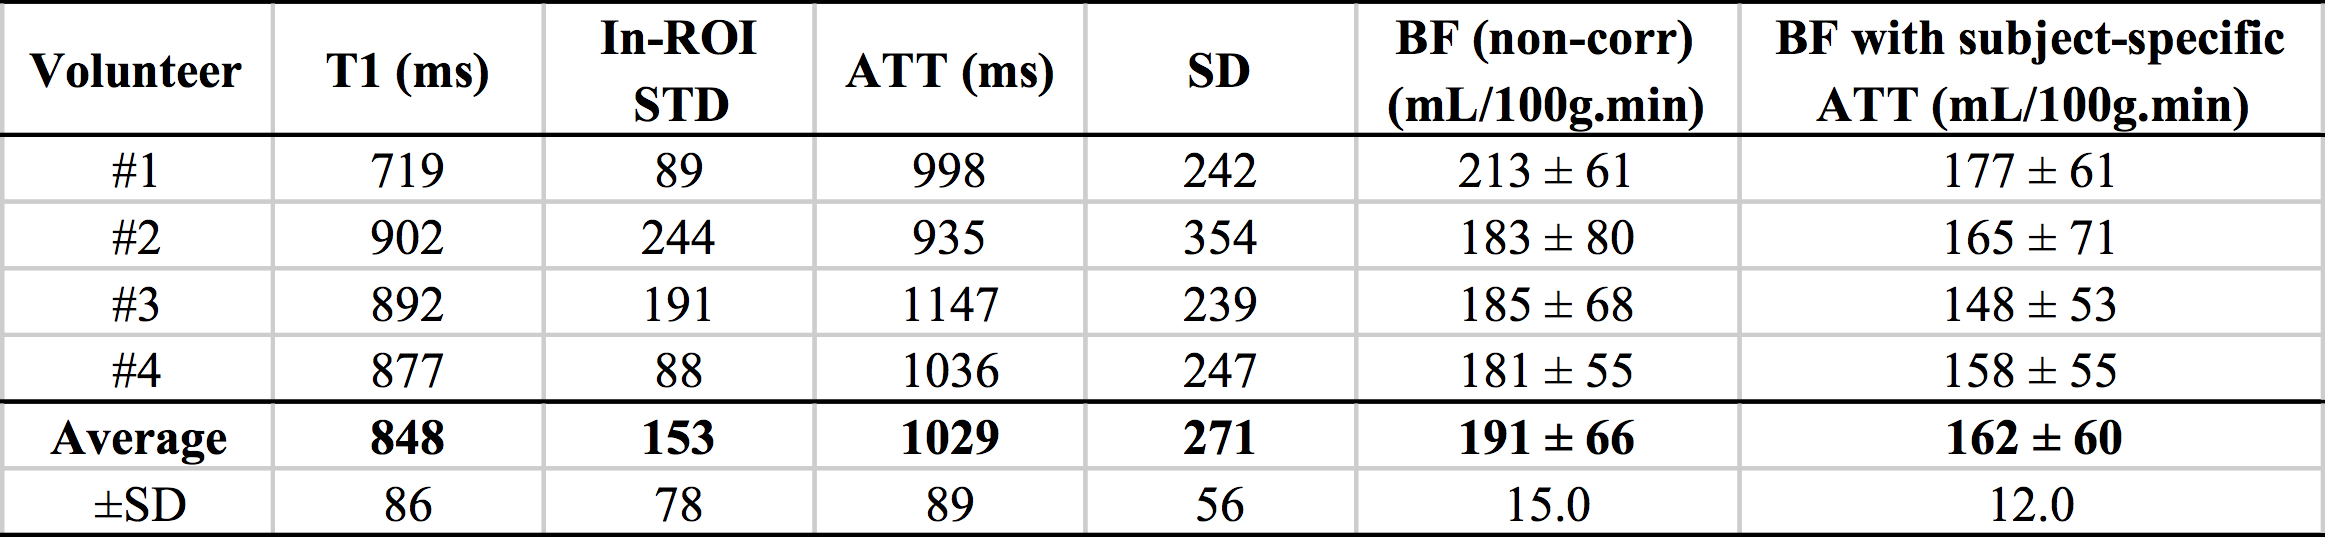
ATT measurements produced longer values than originally assumed (1029±89 vs 750ms), with again evidence of within-ROI variability (≈26%, fig.4). Subject-specific ATT-correction of PBF resulted in a lower absolute perfusion (162±12 vs 191±15mL/100g.min, p=0.005) (fig.5) with an increased heterogeneity of PBF observed when applying ATT correction (especially in the tail).
Finally, PBF correction on the single-delay datasets using an averaged ATT also led to a lower blood-flow (201 vs 168 mL/100g.min, p=0.004).
Discussion and conclusions
We have shown that background-suppressed pCASL at 3T using a timed-breathing approach can provide reliable measurements of pancreatic perfusion. Interestingly, some evidence of heterogeneity in perfusion, quantified as substantial within-ROI variability for both PBF and ATT, was found, potentially linked to the complex pancreatic vascular supply but also to the difference in function between exocrine/endocrine pancreas. Although further developments must be considered to extend spatial coverage without compromising image quality, these results already suggest great potential for the use of ASL in the diagnosis and monitoring of diseases such as pancreatic carcinoma, and to offer insights into functional alterations encountered in diabetes.Acknowledgements
No acknowledgement found.References
1. Bali, M. A. et al. Pancreatic perfusion: noninvasive quantitative assessment with dynamic contrast-enhanced MR imaging without and with secretin stimulation in healthy volunteers--initial results. Radiology 247, 115–121 (2008).
2. Tsushima, Y., Miyazaki, M., Taketomi-takahashi, A. & Endo, K. Feasibility of Measuring Human Pancreatic Perfusion In Vivo Using Imaging Techniques. Pancreas 40, 747–752 (2011).
3. Schraml, C., Schwenzer, N. F., Martirosian, P., Claussen, C. D. & Schick, F. Perfusion imaging of the pancreas using an arterial spin labeling technique. J. Magn. Reson. Imaging JMRI 28, 1459–1465 (2008).
4. Cox, E. F. et al. Temporal assessment of pancreatic blood flow and perfusion following secretin stimulation using noninvasive MRI. J. Magn. Reson. Imaging JMRI 42, 1233–1240 (2015).
5. Dai, W., Garcia, D., de Bazelaire, C. & Alsop, D. C. Continuous flow-driven inversion for arterial spin labeling using pulsed radio frequency and gradient fields. Magn. Reson. Med. 60, 1488–1497 (2008).
6. Zhao, L., Vidorreta, M., Soman, S., Detre, J. A. & Alsop, D. C. Improving the robustness of pseudo-continuous arterial spin labeling to off-resonance and pulsatile flow velocity. Magn. Reson. Med. (2016). doi:10.1002/mrm.26513
7. Maleki, N., Dai, W. & Alsop, D. C. Optimization of background suppression for arterial spin labeling perfusion imaging. Magma N. Y. N 25, 127–133 (2012).
8. Robson, P. M. et al. Strategies for reducing respiratory motion artifacts in renal perfusion imaging with arterial spin labeling. Magn. Reson. Med. 61, 1374–1387 (2009).
9. Dai, W., Robson, P. M., Shankaranarayanan, A. & Alsop, D. C. Reduced resolution transit delay prescan for quantitative continuous arterial spin labeling perfusion imaging. Magn. Reson. Med. 67, 1252–1265 (2012).
10. Buxton, R. B. et al. A general kinetic model for quantitative perfusion imaging with arterial spin labeling. Magn. Reson. Med. 40, 383–396 (1998).
11. Garcia, D. M., Duhamel, G. & Alsop, D. C. Efficiency of inversion pulses for background suppressed arterial spin labeling. Magn. Reson. Med. 54, 366–372 (2005).
Figures