0826
T1 mapping of the pancreas: correlation with HbA1c values1Gifu University, Gifu, Japan, 2Kyoto Prefectural University of Medicine, Kyoto, Japan, 3Philips Healthcare, Tokyo, Japan
Synopsis
The presence of pancreatic fibrosis is a representative feature of the pancreas in patients with impaired glucose tolerance (IGT). The T1 signal intensity of the pancreas is reported to be associated with pancreatic fibrosis and HbA1c values. In this study, we evaluated the feasibility of T1 mapping of the pancreas for the assessment of HbA1c values. Our results showed that increased T1 values of the pancreas was significantly correlated with HbA1c values, so the T1 values of the pancreas could serve as a potential imaging biomarker for the assessment of patients with IGT.
Purpose
To evaluate the feasibility of T1 value of the pancreas for the assessment of patients with impaired glucose tolerance (IGT).Materials and Methods
This prospective study was approved by our institutional review board and written informed consent was obtained. Fifty-eight patients with suspected pancreatic disease underwent magnetic resonance (MR) imaging. The T1 values were calculated on the T1 map obtained by the Look-Locker sequence with the following scan parameters: T1-TFE; TR/TE, 2.8/1.34 msec; voxel size, 1.88 × 1.88 × 5 mm; FA, 10; slice number, 10-slices; shot interval, 2500 msec; parallel imaging factor, 2; acquisition time, two sets of 10 sec with breath holding. The T1 values were measured in pancreatic head, body, and tail using region-of-interest (ROI), carefully devoid of main pancreatic ducts, focal lesions, and artifacts, and then averaged. The signal intensities of the pancreatic parenchyma (SIpancreas) and paraspinal muscle (SImuscle) were measured on 3D-fast field-echo T1-weighted images (FFE T1WI) for calculation of the signal intensity ratio (SIR = SIpancreas/SImuscle). The anterior-posterior (AP) diameters at pancreatic head, body, and tail were also measured in all patients. Patients’ laboratory and clinical data within two weeks of MR imaging were also recorded. Patients were classified into two groups according to American Diabetes Association criteria: HbA1c < 5.7% (Low value group), and HbA1c ≥ 5.7% (High value group). The Mann-Whitney U and Fisher’s tests were conducted to evaluate differences in patients’ laboratory and clinical data, T1 value, SIR on 3D-FFE T1WI, and AP diameters between two groups. Stepwise multiple regression analysis was conducted to evaluate the independent factors affecting HbA1c values. Simple linear regression analysis was performed to evaluate the correlation between MR imaging measurements and HbA1c values. For significant parameters, we determined the optimal threshold on the basis of the highest area under the receiver operating characteristic (ROC) curve that yielded the maximal sensitivity and specificity for the differentiation of Low and High value groups. A P value of less than 0.05 was considered to be significant.Results
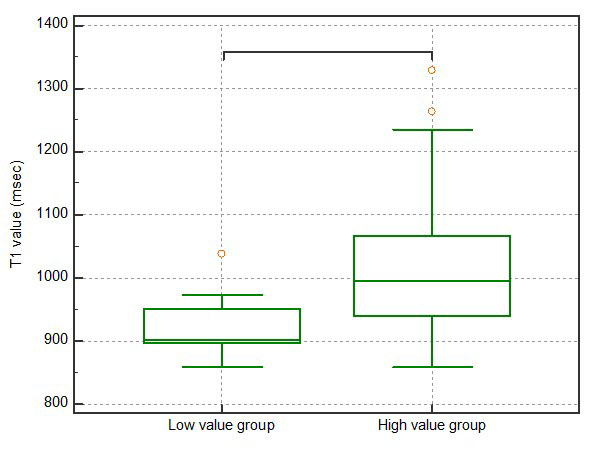
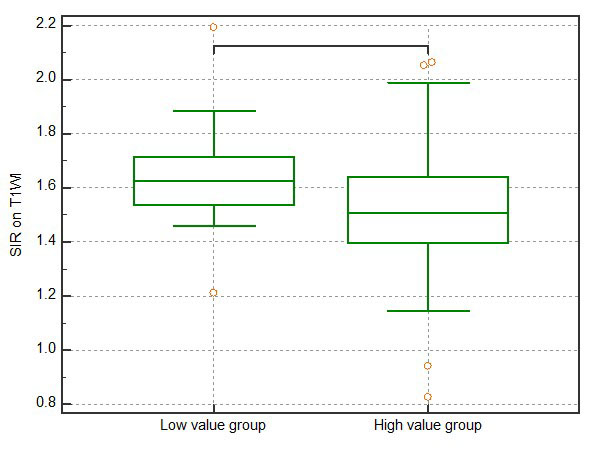
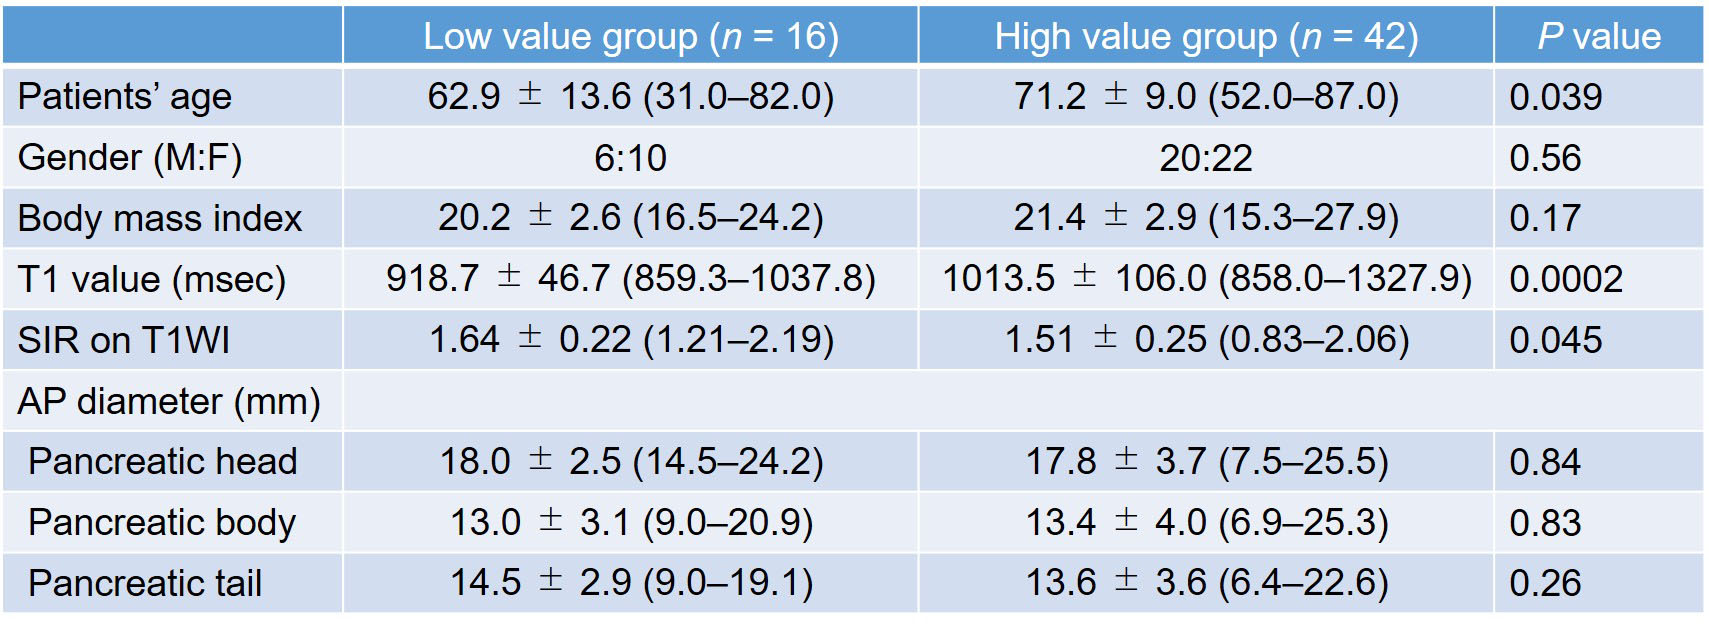
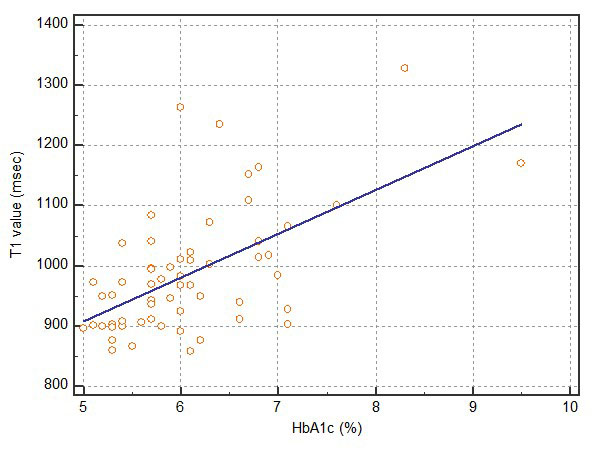
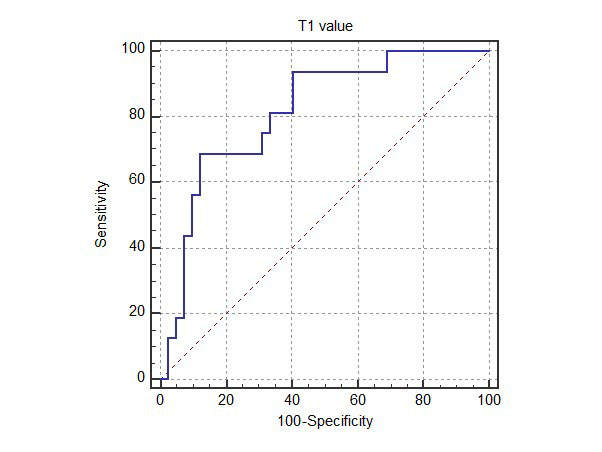
Among 58 patients, 16 were in Low value group and 42 were in High value group. The T1 value of the pancreas in Low value group was significantly lower than that in High value group (P = 0.0002) (Figure 1). The SIR on 3D-FFE T1WI in Low value group was significantly higher than that in High value group (P = 0.045) (Figure 2). There was no significant difference in AP diameters (Table 1). In the stepwise multiple regression analysis, the T1 value of the pancreas was significantly correlated with HbA1c values (P < 0.001). The other independent factors, including patients’ age, gender, body mass index, SIR on 3D-FFE T1WI and AP diameters had no significant correlation with HbA1c values. Simple regression analysis showed moderate, positive correlation between the T1 values and HbA1c values (r = 0.58, P < 0.0001) (Figure 3). On the basis of the ROC analysis, the sensitivity, specificity, and AUC for the differentiating Low and High value groups were 68.7%, 88.1%, and 0.82 in the T1 values of the pancreas, when employing a cutoff value of 907.8 msec.Discussion
In the present study, the T1 value of the pancreas was significantly correlated with HbA1c values. The reduced T1 signal intensity of the pancreas could be explained by the pancreatic fibrosis that replaced pancreatic acini-retaining pancreatic proteinaceous fluid. The pancreatic fibrosis might have impaired islet cell function as well, leading to IGT1. We previously reported that the SIR on T1WI was significantly correlated with pancreatic fibrosis and HbA1c values2. The T1 mapping technique is more reliable and accurate method than the conventional T1-wighted techniques because it is directly measuring the T1 relaxation time of the organ. Recent study have shown that the T1 value of the pancreas was significantly increased in patients with mild chronic pancreatitis3. According to our and their results, we believed that the increased T1 values of the pancreas reflect pancreatic fibrosis and IGT as well. In conclusion, we demonstrated the feasibility of using T1 mapping of the pancreas for the assessment of the patients with IGT. Our results suggest that the T1 values of the pancreas could serve as a potential imaging biomarker for the assessment of pancreatic fibrosis leading to IGT.Acknowledgements
The authors of this manuscript declare no relationships with any companies whose products or services may be related to the subject matter of the article.References
1. Clark A, Wells CA, Buley ID, et al. Islet amyloid, increased A-cells, reduced B-cells and exocrine fibrosis: quantitative changes in the pancreas in type 2 diabetes. Diabetes research 1988;9(4):151-9.
2. Noda Y, Goshima S, Tanaka K, et al. Findings in pancreatic MRI associated with pancreatic fibrosis and HbA1c values. J Magn Reson Imaging 2016;43(3):680-7.
3. Tirkes T, Lin C, Fogel EL, Sherman SS, Wang Q, Sandrasegaran K. T1 mapping for diagnosis of mild chronic pancreatitis. J Magn Reson Imaging 2017;45(4):1171-6.
Figures