0821
Both oxygen supply and phosphocreatine recovery rate show proximo-distal gradients along the human tibialis anterior after exercise1Radiology and Nuclear Medicine, Radboud university medical center, Nijmegen, Netherlands, 2Geriatrics, Radboud university medical center, Nijmegen, Netherlands
Synopsis
Since the rate of phosphocreatine recovery after exercise varied substantially within the tibialis anterior, we wondered if O2 supply also varied along this muscle. Therefore, we applied near infra-red spectroscopy to study the dynamic equilibrium of O2 supply and O2 utilization, intravoxel incoherent motion imaging for muscle perfusion and 31P-MRS during and after isometric exercise of the tibialis anterior. We observed higher post-exercise perfusion and faster phosphocreatine and oxyhemoglobin recovery proximally than distally in the tibialis anterior, indicating a proximo-distal gradient in O2 supply. This may be an adaptation to a higher proximal energy requirement.
Purpose
The phosphocreatine (PCr) recovery rate (kPCr) of muscles after exercise, reflecting their oxidative capacity1, varies between subjects2,3 and muscles2–4. Recently, we demonstrated that kPCr also varied substantially within a single muscle, i.e. in the tibialis anterior (TA)5. As kPCr depends on muscles’ capacity to utilize O2 for ATP production and O2 supply, we wondered if O2 supply also varied spatially within the TA. Therefore, we applied near infra-red spectroscopy (NIRS) to study the temporary imbalance of O2 supply and utilization, intravoxel incoherent motion imaging (IVIM) for muscle perfusion and 31P-MRS during and after isometric exercise of the TA.Methods
Study design
In two sessions twelve healthy male volunteers (age: 26±3y; BMI: 22.9±1.6kg/m2) performed isometric dorsiflexion of the right ankle until exhaustion at 30% of their maximum voluntary contraction (MVC; determined at the start of both sessions).
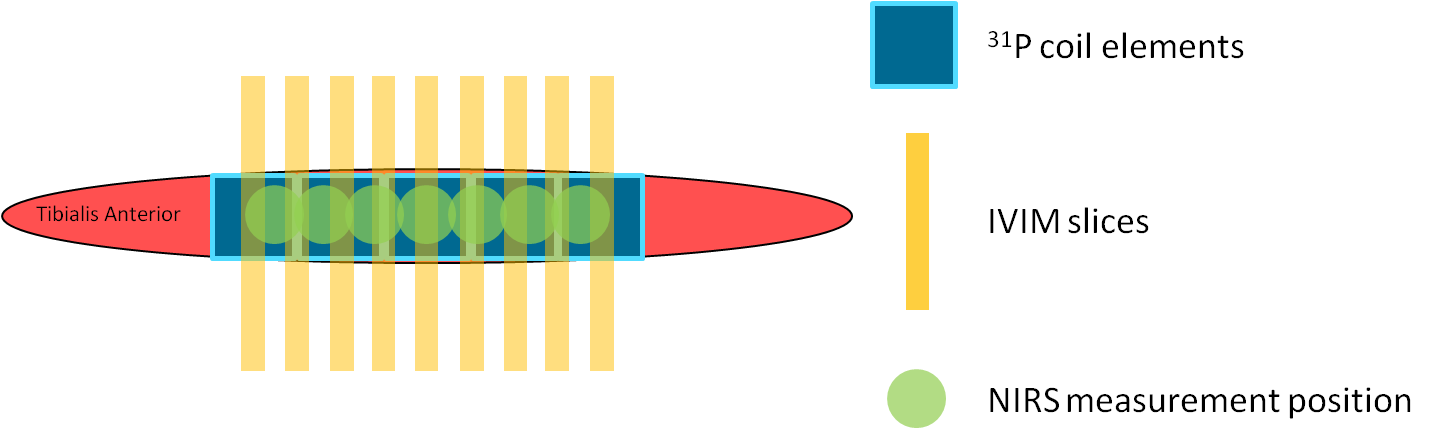
Session 1: Oxy- and deoxyhemoglobin changes were measured simultaneously at seven positions along the TA (Fig1) using continuous-wave NIRS (OxyMon, Artinis) for five minutes rest, exercise, and fifteen minutes recovery (N=12).
Session 2: The subjects performed the exercise twice inside a 3T MR system (Prisma Fit, Siemens). First, nine transverse diffusion-weighted (DW) slices (Fig1) were acquired (SE-EPI; SPAIR; TR/TE=2000/40ms; voxel size=2.75x2.75x10mm3; gap=11.3mm; acquisition time=1min18s; b=0,5,10,15,20,40,60,80,100,150,200,400,600s/mm2) using a knee coil; four acquisitions during rest and twelve during recovery (N=10). Second, 31P-MR spectra were collected (pulse-acquire; FA=48°; TR=2060ms; NA=2; 1 spectrum/coil element; NOE) during one minute rest, exercise and recovery (total:±20min; N=8). We used a 1H/31P birdcage coil (Rapid) for transmission and home-built ladder-shaped 31P-phased array coil containing five coil elements positioned on the TA for reception (Fig1; size=4x4.5cm each, signal localization through the coil element sensitivity profiles).
Post-processing
NIRS: We applied a moving average filter (span=10s) and determined the time to reach 50% of the maximum oxyhemoglobin value during recovery (TTP_50perc).
IVIM: We determined the average signal magnitude for the TA per slice, b-value and time-series by delineating the TA on all b0 images. The signal decay was fitted per slice and time-series with a bi-exponential model6 (Eq1) in two steps7.
$$$S_b=S_0'((1-F_p)e^{-b\times{D}}+F_pe^{-b\times{D^*}})$$$ (Eq1)
First, diffusion coefficient (D) and S0’’ were computed by a linear least-squared fit to the log-transformed signal for b-values>200s/mm2 (Eq2).
$$$log(S_b)=-b\times{D}+log(S_0'')$$$ (Eq2)
Second, perfusion coefficient (D*), perfusion fraction (Fp) and S0’ were fitted with a non-linear least-squared fit (Eq1) to b-values=5-600s/mm2 with D fixed. D, D*, Fp, and blood flow related parameter Fp×D* during rest and recovery were defined as the average over the first four and last eleven acquisitions, respectively.
31P-MRS: PCr, inorganic phosphate (Pi) and ATP resonances were fitted with AMARES/jMRUI (Lorentzians). kPCr was fitted with a mono-exponential model (Eq3).
$$$PCr(t)=PCr_0+\triangle{PCr}(1-e^{-k_{PCr}\times{t}})$$$ (Eq3)
PCr0=end-exercise PCr; ΔPCr=end-recovery PCr (PCrrecovery) minus PCr0
PCr depletion was defined as ΔPCr/PCrrecovery and end-exercise pH (pHendex) was determined from the chemical shift difference between Pi and PCr.
Statistics
Linear mixed models were used to assess the linear dependence of kPCr, TTP_50perc and IVIM outcomes to position. kPCr was correlated with NIRS and IVIM using Pearson’s correlation on the pooled data of all volunteers per position.
Results
Exercise: MVC was 209±36N and 207±25N during session 1 and 2, respectively. Force during NIRS, IVIM and 31P-MRS was similar (all: 29±1% MVC) and time to exhaustion was 276±98s, 271±102s, and 158±39s, respectively.
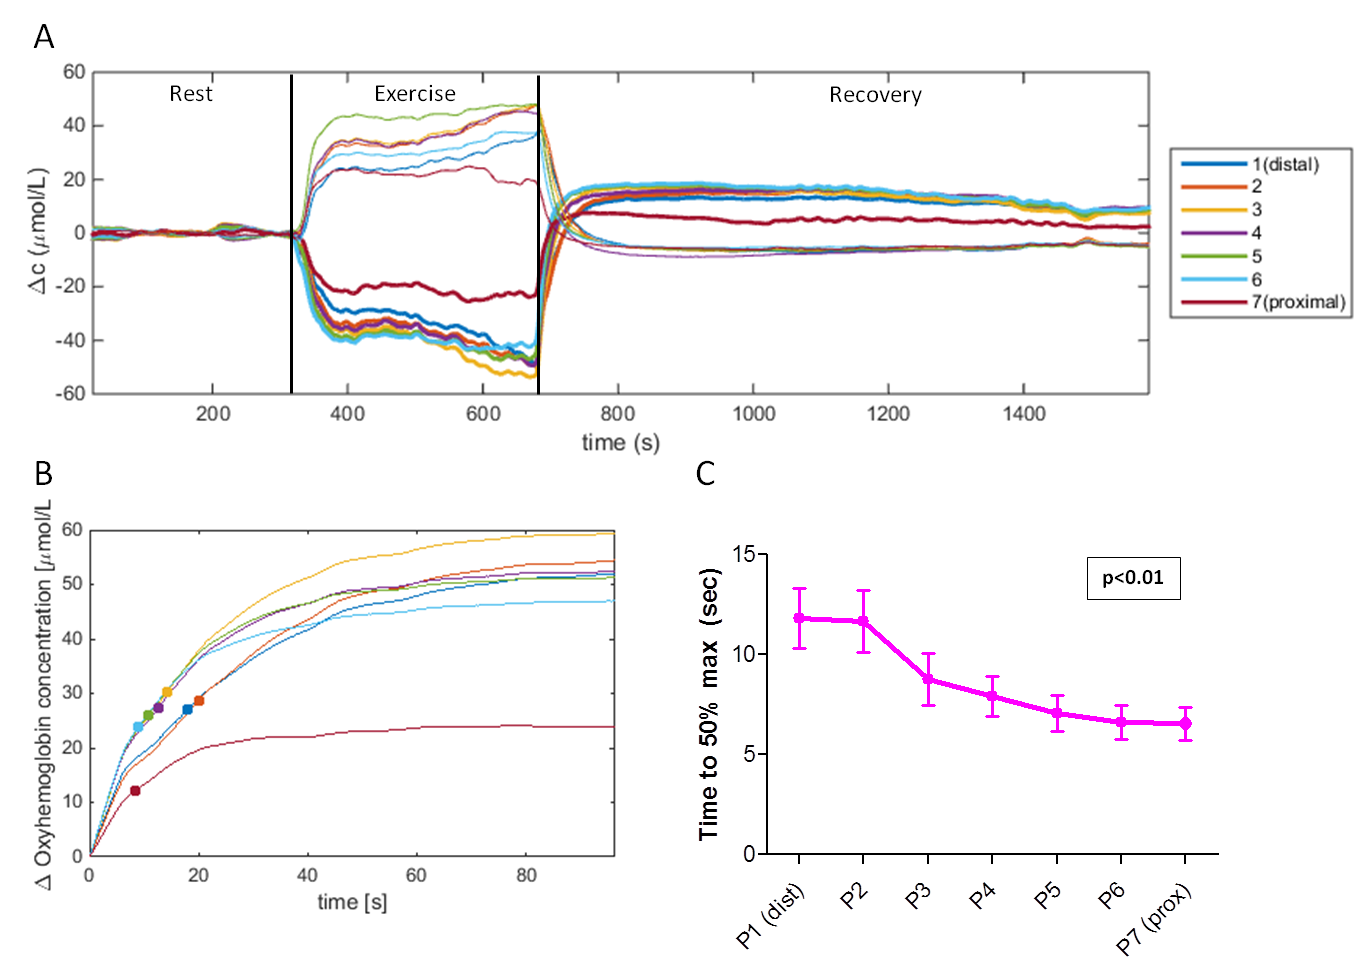
NIRS (Fig2): Oxyhemoglobin decreased and deoxyhemoglobin increased during exercise, both recovering to baseline. TTP_50perc showed significant linear relationships with measurement position (p=0.01), being lower proximally.
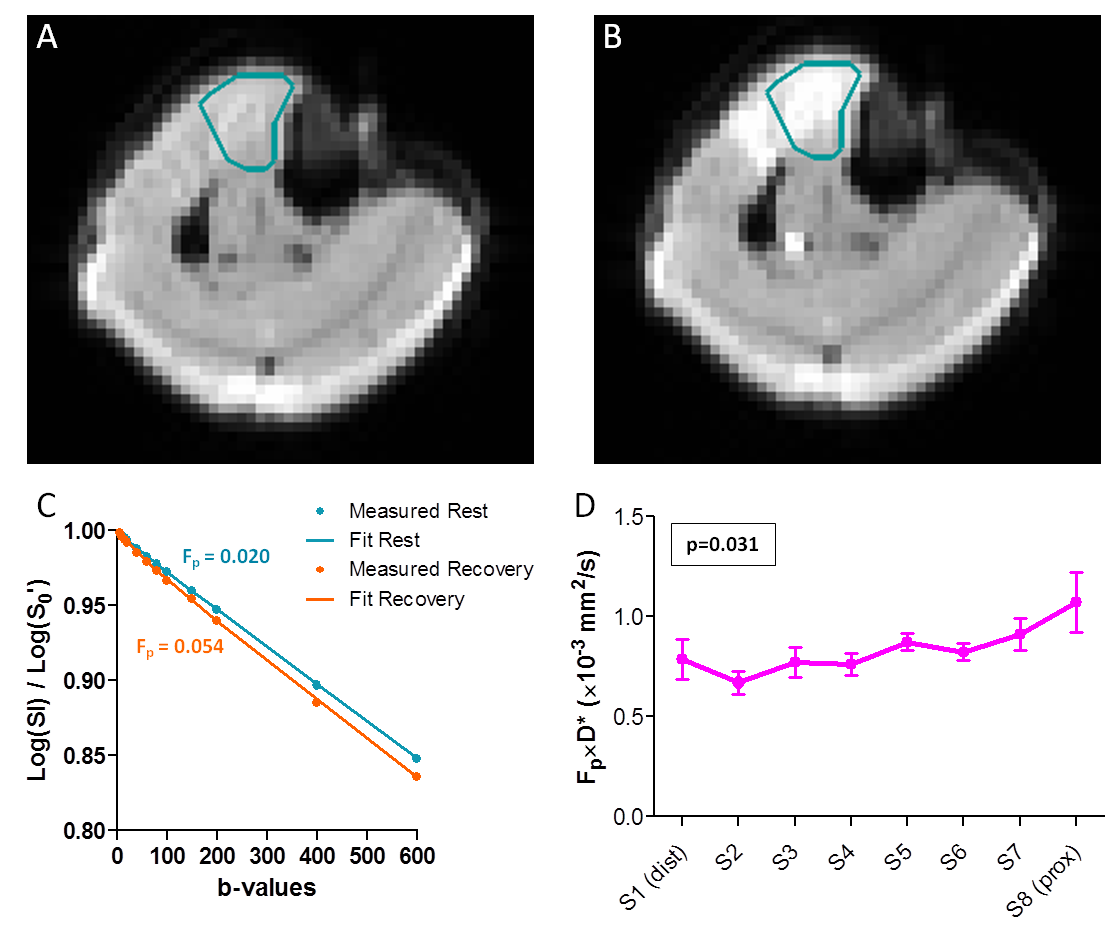
IVIM (Fig3): Fig3A-C shows example DW images for b5 and corresponding signal decay. D, Fp, D*, and Fp×D* significantly increased after exercise (D:+4±3%, Fp:+62±48%, D*:+131±53%, Fp×D*:+283±135%, all p<0.001). Fp and Fp×D* showed significant linear relationships with slice position during recovery (Fp: p=0.011; Fp×D*: p=0.031), being higher proximally. D* showed a similar trend (p=0.062).
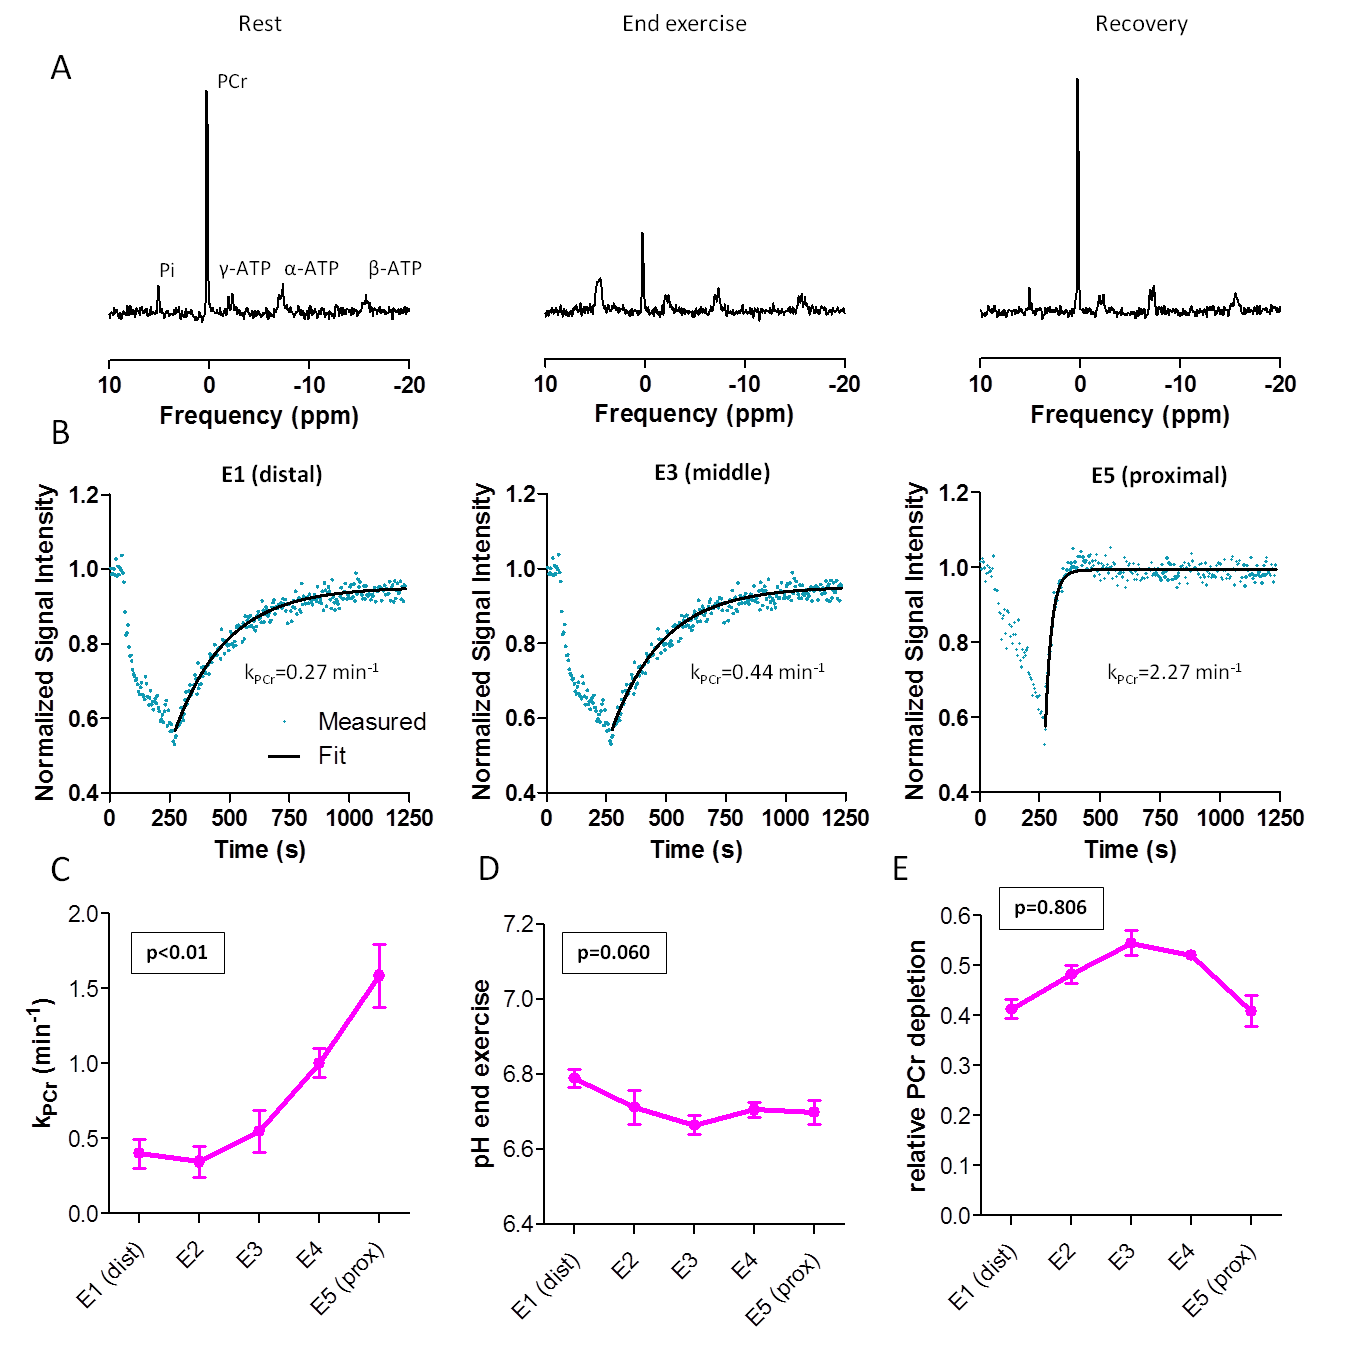
31P-MRS (Fig4): PCr decreased during exercise and recovered to baseline after exercise. kPCr showed significant linear relationships with coil elements, being higher proximally (p<0.01), while pHendex (p=0.060) and PCr depletion did not (p=0.806).
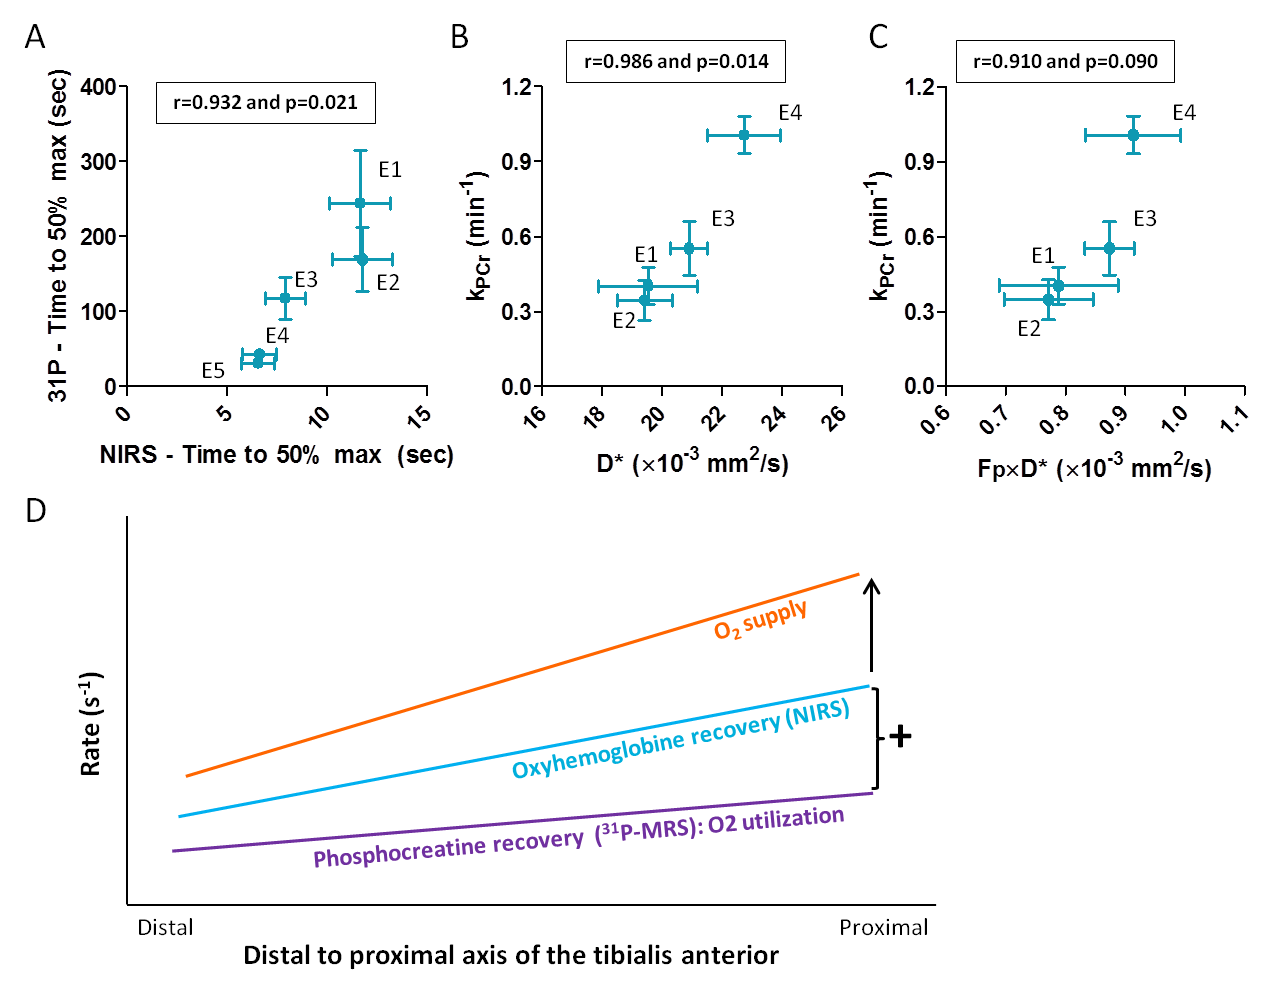
31P-MRS vs. NIRS and IVIM (Fig5): PCr recovery correlated significantly with TTP_50perc (r=0.932,p=0.021), D* (r=0.986,p=0.014) and tended to correlate with Fp×D* (r=0.910,p=0.090).
Discussion and Conclusion
We observed higher post-exercise perfusion and faster PCr and oxyhemoglobin recovery proximally than distally in the TA. Oxyhemoglobin recovery depends on O2 supply and utilization. As both the initial post-exercise O2 utilization, reflected by ΔPCr×kPCr1, and oxyhemoglobin recovery were faster proximally, the gradient in O2 supply has to be even more pronounced (Fig5D). To conclude, both IVIM and NIRS show a post-exercise proximo-distal gradient in O2 supply correlating with kPCr after isometric exercise of the TA. This may be an adaptation to a higher proximal energy requirement.Acknowledgements
We like to thank the volunteers for their time and dedication.References
1Kemp GJ, Ahmad RE, Nicolay K, Prompers JJ. Quantification of skeletal muscle mitochondrial function by 31P magnetic resonance spectroscopy techniques: a quantitative review. Acta Physiol (Oxf). 2015;213:107–144.
2Larsen RG, Callahan DM, Foulis SA, Kent-Braun JA. In vivo oxidative capacity varies with muscle and training status in young adults. J Appl Physiol. 2009;107:873–879.
3Fleischman A, Makimura H, Stanley TL, et al. Skeletal muscle phosphocreatine recovery after submaximal exercise in children and young and middle-aged adults. J Clin Endocrinol Metab. 2010;95:E69-74.
4Yoshida T, Abe D, Fukuoka Y. Phosphocreatine resynthesis during recovery in different muscles of the exercising leg by 31P-MRS. Scand J Med Sci Sport. 2013;23:e313-9.
5Boss A, Heskamp L, van Uden MJ, Bains LJ, Breukels V, Heerschap A. Muscle Functional Oxidative Capacity Varies Along the Length of Healthy Tibialis Anterior. Proc ISMRM. Epub 2016.
6Le Bihan D, Breton E, Lallemand D, Aubin ML, Vignaud J, Laval-Jeantet M. Separation of diffusion and perfusion in intravoxel incoherent motion MR imaging. Radiology. 1988;168:497–505.
7Federau C, Maeder P, O’Brien K, Browaeys P, Meuli R, Hagmann P. Quantitative Measurement of Brain Perfusion with Intravoxel Incoherent Motion MR Imaging. Radiology. 2012;265:874–881.
Figures