0819
Quantitative T2 mapping of the thigh muscles and its correlation with the ADC: a feasibility study in assessing inflammatory myopathy1Radiology, Peking Union Medical College Hospital, Beijing, China, 2Rheumatology, Peking Union Medical College Hospital, Beijing, China, 3Advanced Clinical Imaging Technology, Siemens Healthcare, AG, Switzerland, 4MR Collaboration NE Asia, Siemens Healthcare, Shanghai, China
Synopsis
We investigated the use of the T2 mapping technique to quantitatively evaluate the thigh muscles of 18 dermatomyositis (DM)/polymyositis (PM) patients and 10 healthy control subjects. Moreover, the correlation of T2 values with apparent diffusion coefficient (ADC) values was also studied. The results showed significantly elevated T2 values with edematous muscles and increased T2 values with unaffected muscles (normal appearing in conventional MRI) in DM/PM patients, compared to the control group. The T2 values of the edematous muscles were found to be closely correlated with the ADC. This study demonstrated that T2 mapping may be successfully used in the quantitative evaluation of inflammatory myopathy.
Background and Purpose
Dermatomyositis (DM) and polymyositis (PM) are the two leading types of idiopathic inflammatory myopathy, and are characterized by symmetrical proximal muscle weakness, particularly in thigh muscles. [1] The diagnostic criteria established in 1975 by Bohan and Peter are still used today [2], and conventional MRI could detect muscle changes in myositis, but usually does so qualitatively. The aim of this study was to explore whether T2 mapping could quantitatively assess the edematous thigh muscles of patients with DM and PM, and whether the T2 values of the edematous muscle lesions were correlated with the ADC.Materials and Methods:
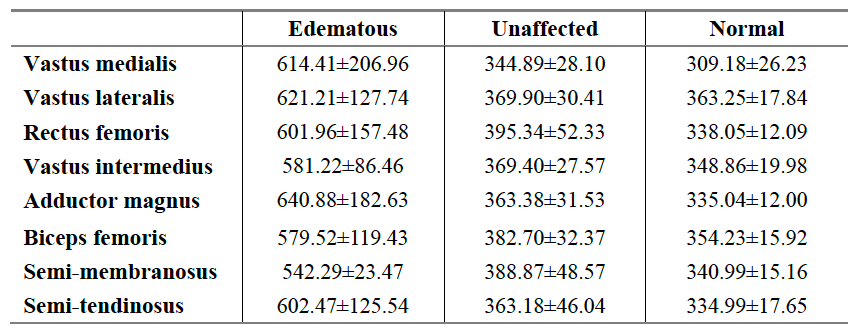
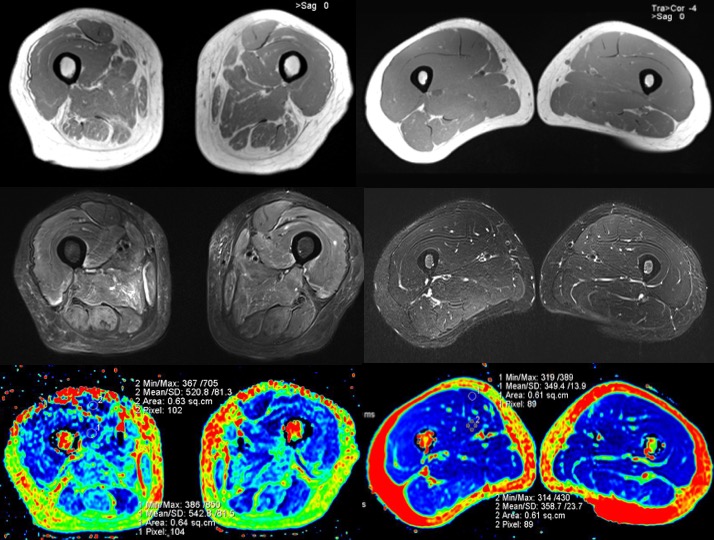
From November 2016 to May 2017, DM and PM patients (consistent with Bohan & Peter diagnostic criteria) and healthy volunteers (free of any systemic or musculoskeletal diseases) were prospectively enrolled after providing written informed consent. A total of 36 thighs of 18 patients (11 PM and 7 DM patients; male: female = 4:5; mean age, 52.2 years [29-69 years]) and 20 thighs of 10 healthy volunteers (male: female = 1:9; mean age, 36.6 years [25-63 years]) were included. A prototype T2 mapping sequence, diffusion weighted imaging (DWI), and three conventional MR sequences of both thighs was carried on a MAGNETOM Skyra 3T MR scanner (Siemens Healthcare, Erlangen, Germany) using an 18-channel body coil. The detailed parameters for the T2 mapping were as follows: TR = 6690ms; TE = 10-100ms, ΔTE = 10ms; slice thickness = 5mm; FOV= 420mm×420mm; matrix = 254×84; and bandwidth = 221Hz. The detailed parameters for DWI were as follows: TR = 4500ms; TE = 51ms; slice thickness = 4mm; FOV= 400mm×400mm; matrix = 100 × 66, bandwidth = 2380Hz, and b value = 0 and 400 s/mm2. All the acquired images were transferred to a commercial workstation (MMWP workstation; Siemens Healthcare). A circular region of interest (ROI) with an area of 60 mm2 was used to measuring T2 map values (Fig. 1). The T2 values of each thigh muscle except gracilis were measured for the edematous and unaffected muscles of the DM/PM patients and the normal muscles of the healthy subjects. A similar method was used to measure the ADC of four selected muscles (vastus medialis [VM], vastus intermedius [VI], adductor magnus [AM], and semi-membranosus [SM]). Student’s t test and Pearson’s correlation coefficient were used for the statistical analysis.Results:
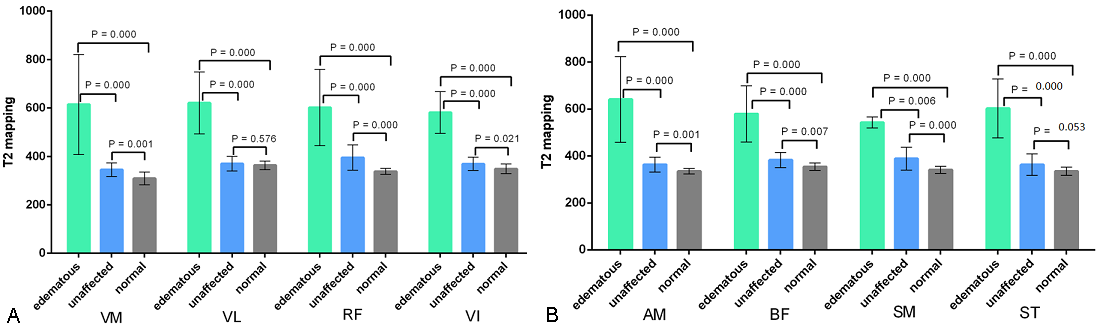
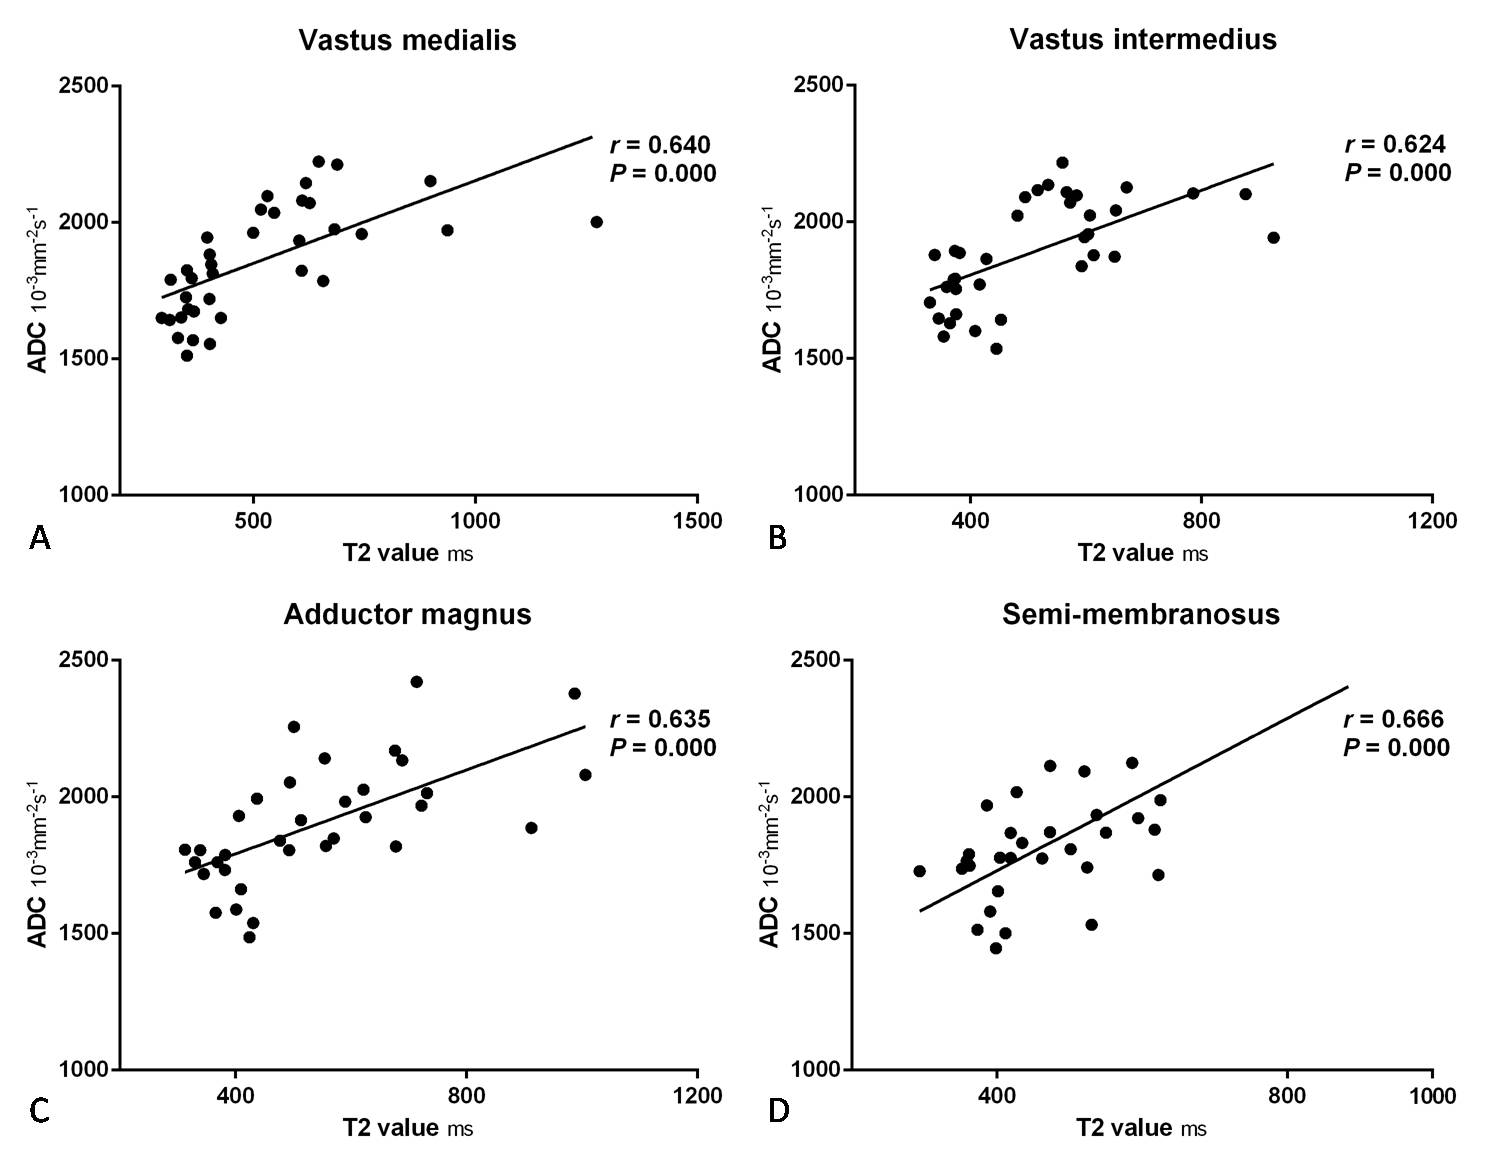
The T2 values and test results of the edematous and unaffected muscles in the DM/PM patients and normal muscles in the healthy controls are shown in Figure 2 and 3. For each thigh muscle measured, the T2 values of the edematous muscles were all markedly higher than those in the health controls (all P ≤ 0.001). (Fig. 4) Moreover, the T2 values of the edematous muscles were all significantly higher than those of the unaffected muscles in the patients (all P ≤ 0.001). The T2 values of the unaffected muscles in the patient group were also compared with those in health control, with all having a P < 0.05, except in the vastus lateralis and semi- tendinosus. Regarding the four selected muscles, the ADC of the edematous muscles were significantly higher than those of the unaffected and healthy groups (all P < 0.001). In addition, the T2 values of the edematous muscles were closely correlated with the ADC (r = 0.640 for VM, r = 0.624 for VI, r = 0.635 for AM, and r = 0.666 for SM; all P < 0.001). (Fig. 5)Discussion and Conclusion
The quantitative evaluation of muscle lesions using a non-invasive T2 mapping technique may serve as a useful tool in the diagnosis and monitoring workflow of myositis. A previous study [3] showed the correlation of signal intensity on T2 weighted imaging and disease activity in myositis patients, but this method was qualitative rather than quantitative. T2 mapping has been used to evaluate muscle injury in a rabbit model [4] and muscle atrophy in Duchenne Muscular Dystrophy [5]. To the best of our knowledge, however, there is no prior similar research regarding the application of T2 mapping in the thigh muscles of DM and PM patients. In our study, the results showed increased T2 values with the edematous muscles in the DM/PM patients, and its correlation with ADC was positive. Myositis causes vasculitis and vasogenic muscle edema, resulting in increased random Brownian motion of water protons which is reflected by increased ADC values. Furthermore, the thigh muscles of those patients that appeared normal on conventional MR images were identified as being abnormal on the T2 maps. In conclusion, T2 mapping has the potential to provide quantitative information on DM and PM.Acknowledgements
The authors thank Tianyi Qian (Siemens Healthcare, Beijing, China) for his technical support, Chanyuan Wu (Department of Rheumatology, Peking Union Medical College Hospital, Chinese Academy of Medical Sciences & Peking Union Medical College) for the clinical advice, and Bo Hou (Department of Radiology, Peking Union Medical College Hospital, Chinese Academy of Medical Sciences & Peking Union Medical College) for scanning data.References
1. Findlay AR, Goyal NA, Mozaffar T. An overview of polymyositis and dermatomyositis. Muscle Nerve. 2015; 51(5):638-656.
2. Alexanderson H, Lundberg IE. Disease-specific quality indicators, outcome measures and guidelines in polymyositis and dermatomyositis. Clin Exp Rheumatol. 2007; 25(6 Suppl 47):153-158.
3. Studynkova JT, Charvat F, Jarosova K, et al. The role of MRI in the assessment of Polymyositis and Dermatomyositis. Rheumatology. 2007, 46:1174-1179.
4. Zhang LY, Ding JT, Wang Y, et al. MRI quantitative study and pathologic analysis of crush injury in rabbit hind limb muscles. J Surg Res. 2011, 167(2):e357-e363.
5. Kim HK, Serai S, Lindquist D, et al. Quantitative skeletal muscle MRI: Part 2, MR spectroscopy and T2 relaxation time mapping-comparison between boys with Duchenne Muscular Dystrophy and healthy boys. Am J Roentgenol. 2015, 205(2):W216-W223.
Figures