0818
Quantification of water T1 and fat fraction in skeletal muscle tissue using an optimal MR fingerprinting radial sequence (MRF-WF)1NMR Laboratory, Institute of Myology, Paris, France, 2NMR Laboratory, CEA, DRF, IBFJ, MIRCen, Paris, France
Synopsis
Quantitative T1-mapping might represent an efficient tool to monitor inflammation, necrosis or fibrosis processes in skeletal muscle tissues affected by neuromuscular disorders. However, standard T1-mapping sequences cannot separate the contribution of water and fat protons. If directly applied to fatty infiltrated skeletal muscles, a “global” T1 value would mainly reflect the degree of intramuscular fat and the other underlying processes would largely be hidden. Here, we proposed an optimal sequence allowing simultaneous estimation of water T1 and fat fraction. It was validated in phantom and in vivo acquisitions were performed on several subjects suffering from different neuromuscular diseases.
Introduction:
For many neuromuscular disorders (NMDs), the establishment of a reliable NMR imaging biomarker that would be predictive of disease evolution, possibly before massive macroscopic degenerative changes in muscle tissue (e.g. fat infiltration) is still lacking. Quantitative T1 mapping, which emerged in the last decade for cardiac protocols and is being extensively validated to monitor inflammation, necrosis or fibrosis processes in myocardial tissues2, might represent an efficient tool to address this issue. However, none of the sequences proposed for cardiac applications is able to separate the contribution of water and fat protons. If directly applied to fatty infiltrated skeletal muscles, a “global” T1 value would mainly reflect the degree of intramuscular fat and the other underlying processes previously mentioned would largely be hidden. The goal of this study was to propose an optimal sequence, inspired by the MR fingerprinting (MRF) method2, allowing simultaneous estimation of water T1 (T1H2O) and fat fraction (FF) in the skeletal muscles.Method:
All the experiments were performed at 3T (PRISMA, Siemens) using the body coil for RF transmission and a set of flexible matrix coils for signal reception. The MRF sequence for water and fat separation (MRF-WF) consisted in the acquisition of a 1400 radial spokes FLASH echo train, with golden angle sampling scheme, following non-selective inversion. The echo time (TE), repetition time (TR) and prescribed flip angle (FA) were varied throughout the acquisition (Figure 1). Other sequence parameters were: BW = 790 Hz/px, FOV = 350 mm2, resolution = 1x1mm2, 5 slices, slice thickness = 8 mm, Tacq = 50s. For each slice, 175 images were reconstructed using view sharing and a compressed sensing algorithm with total variation regularization in both space and time dimensions3. A dictionary of 69888 normalized signal evolution curves with various T1H2O values (between 230 and 2300ms), transmit field efficacy B1 values (between 0.4 and 1) and off resonance Δf values (between -100 and 100Hz) was generated using Bloch simulations. Each entry in the dictionary contained a pure water (SH2Oi) and a pure fat (Sfati) signal evolution. A 6-peak model with fixed chemical shift (σ) and T1 values4 was used to characterize fat protons. The i-th dictionary entry was written as:
$$ [S_{H2O}^i, S_{fat}^i] = [Bloch\left\{TE(t), TR(t), FA(t), T1_{H2O}^i, Δf^i, B1^i\right\}, \sum_{k=1}^6a_k \times Bloch\left\{TE(t), TR(t), FA(t), T1_k, σ_k, Δf^i, B1^i\right\}]$$
For each voxel, the optimal triplet (T1H2Oi, Δfi and B1i ) and the amplitudes of water and fat signals (w and f) were determined by solving the following problem:
$$ \begin{bmatrix}w \\f \end{bmatrix} = argmin_{w,f\geq0} || y - [S_{H2O}^i, S_{fat}^i] \begin{bmatrix}w \\f \end{bmatrix}||_2 $$
where y represented the observed signal evolution. FF was estimated as FF = f/(w+f).
This approach was validated on a 13-vial phantom, containing peanut oil/water emulsions at different fat fractions (from 0 to 1) and NiCl2 concentrations (from 0.45 to 1.61mM). Gold standard T1H2O was measured within each vial using an IR-STEAM sequence (TI varying from 20 to 5000 ms, voxel size = 12 mm3; TE/TR = 20/6500 ms, BW = 2500 Hz, vector size = 2048).
In vivo acquisitions were performed on a healthy volunteer at different slice levels (from legs to shoulders) and 8 patients suffering from different neuromuscular disorders (3 Becker muscular dystrophy: BMD, 2 necrotizing myopathy: NM and 2 Duchenne muscular dystrophy: DMD). For all subjects, FF was also quantified using the standard 3pt-Dixon method5 on a GRE sequence at 3 different TE (TE1/TE2/TE3/TR = 2.75/3.95/5.15/10ms).
Results:
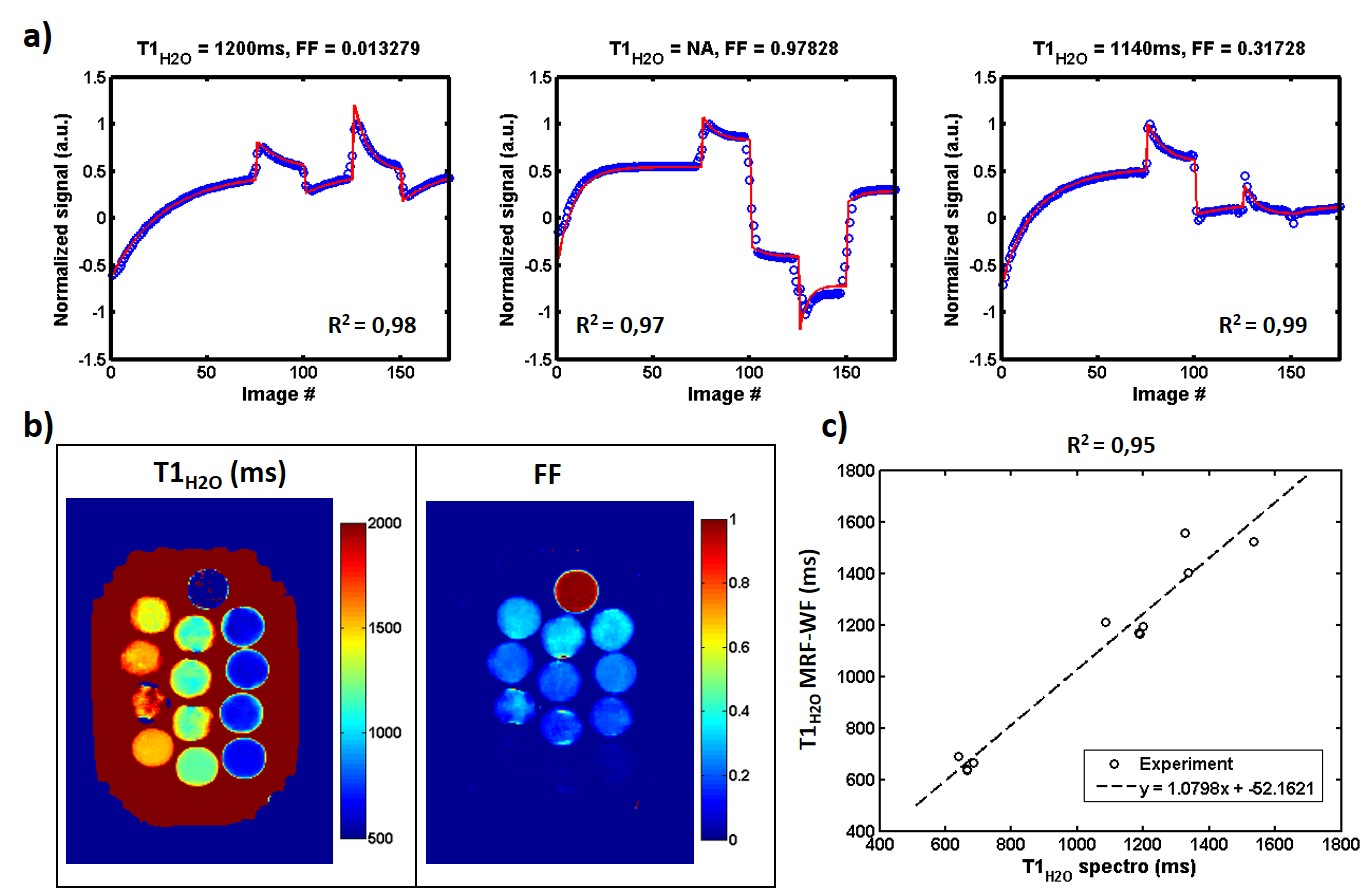
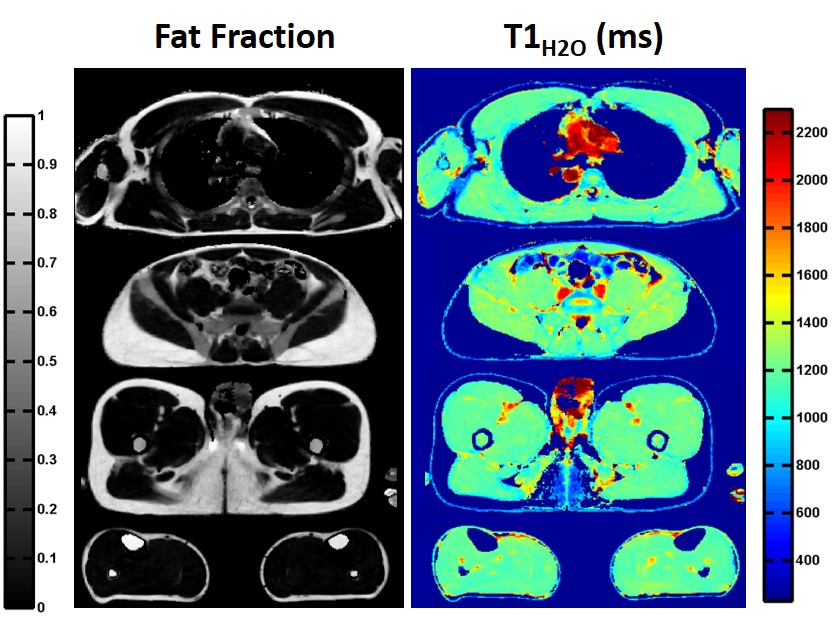
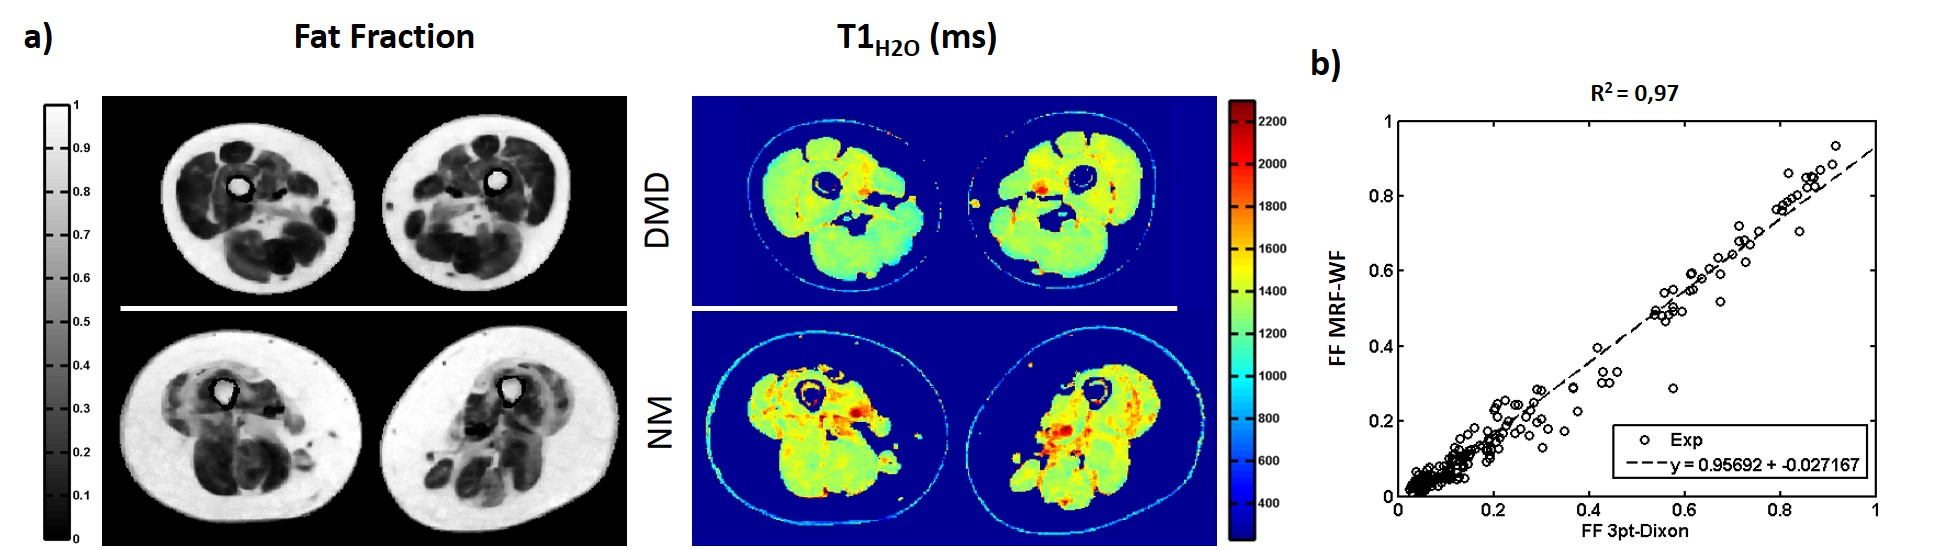
Figure 2-a exhibits the signal evolution (real part) in three vials at different fat fractions (0, 1 and 0.3) and the corresponding fits, T1H2O and FF values. For each condition, fitting quality was good with correlation coefficients R2 higher than 0.97. The parametric maps obtained on phantom are displayed in figure 2-b. T1H2O values estimated with MRF-WF correlated with the gold standard spectroscopic T1H2O (figure 2-c, R2 = 0.95, p<0.05). In vivo T1H2O and FF maps were obtained on the healthy volunteer at different body level (figure 3). Variations of FF and T1H2O were clearly visible in several muscles groups of some patients (figure 4-a). Finally, FF values computed with MRF-WF correlated tightly with 3pt-Dixon FF (figure 4-d).Discussion & Conclusion:
The MRF-WF sequence allowed to simultaneously derive unbiased T1H2O and FF values in voxels containing a mixture of water and fat protons. This could be used to better understand and characterize the effects of tissue water compartmentation and distribution on muscle T1 values in patients affected by chronic degenerative stages. Moreover, the short acquisition time of this sequence would be compatible with clinical research and could be acquired on large patient cohorts to evaluate the sensitivity of T1H2O as an early biomarker of disease severity in many NMDs.Acknowledgements
No acknowledgement found.References
1- Schelbert EB, Messroghli DR. State of the Art: Clinical Applications of Cardiac T1 Mapping. Radiology. 2016 Mar;278(3):658-76. doi: 10.1148/radiol.2016141802.
2- Ma D, Gulani V, Seiberlich N, Liu K, Sunshine JL, Duerk JL, Griswold MA. Magnetic Resonance Fingerprinting. Nature. 2013 Mar 14; 495(7440): 187–192. doi: 10.1038/nature11971
3- Marty B, Coppa B, Carlier PG. Fast, Precise, and Accurate Myocardial T1 Mapping Using a Radial MOLLI Sequence With FLASH Readout. Magn Reson Med. 2017 Jul 3. doi: 10.1002/mrm.26795.
4- Hamilton G, Smith DL, Bydder M, Nayak KS, Hu HH. MR Properties of Brown and White Adipose Tissues. JMRI 2011; 34:468–473
5- Glover GH, Schneider E. Three-point Dixon technique for true water/fat decomposition with B0 inhomogeneity correction. Magn Reson Med 1991;18:371–83.
Figures