0817
Increased T1Rho relaxation in a Duchenne muscular dystrophy mouse model with increased muscle fibrosis1Radiology, Leiden University Medical Center, Leiden, Netherlands, 2Human Genetics, Leiden University Medical Center, Leiden, Netherlands, 3Preclinical and Translational MRI, Academic Medical Center, Amsterdam, Netherlands
Synopsis
A T1Rho sequence was used in a Duchenne Muscular Dystrophy mouse model characterized by increased muscle fibrosis. Significantly higher T1Rho relaxation times were found compared to wild-type mice in which fibrosis was absent. Although both T1Rho and T2 values were increased, the increase was more pronounced for T1Rho than for T2 (14.2% vs 3.6%), indicating that T1Rho is affected by other processes than those resulting in increased T2 values. These data demonstrate the potential of T1Rho to assess muscle fibrosis in vivo.
Introduction
Duchenne muscular dystrophy (DMD) is a
progressive muscle wasting disease resulting in death between the 2nd
and 3rd decade of life. The lack of dystrophin in DMD patients renders
their muscle fibers more vulnerable to contraction-induced damage. Muscle
pathology in DMD is characterized by focal degeneration and regeneration accompanied
by inflammation (infiltration, edema), appearing as hyperintense foci on T2-weighted
images. Before the permanent muscle loss, muscle fibrosis is already
progressively increasing compared to the localized inflammation (1,2). Upon exhaustion of the muscle’s regenerative capacity, muscle fibers
are eventually replaced by fat and connective tissue, resulting in loss of
function. As muscle fibrosis is an early event in the disease course, measurement
of muscle fibrosis could act as an early global disease marker, independent of the
transient local inflammation processes.
T1Rho is the spin-lattice relaxation during the presence of a spin lock
RF pulse in the rotating frame of reference and was shown to be sensitive to
liver and cardiac fibrosis. The aim of this study was to quantify T1Rho in skeletal muscle for
its ability to report on skeletal muscle fibrosis in a DMD mouse model with
increased endomysial (muscle) fibrosis and compare it to traditional T2
measures in the same muscle and gold-standard histology for fibrosis.
Method
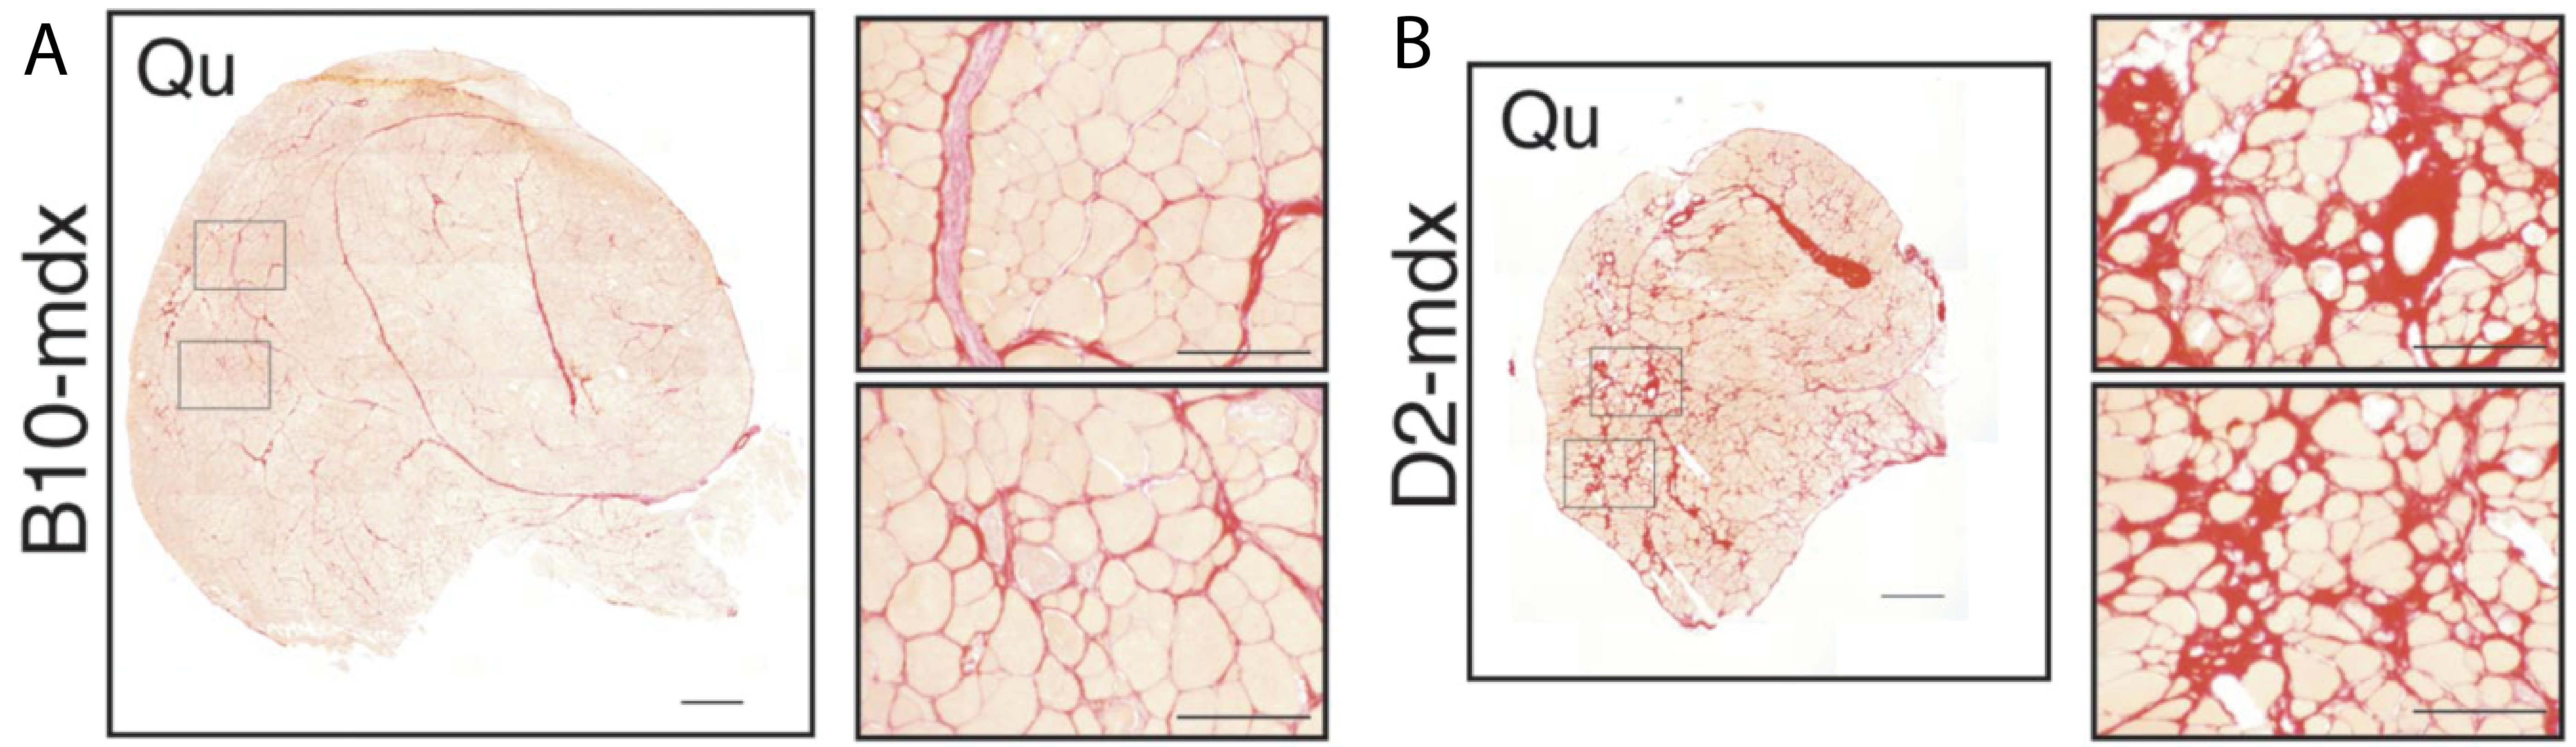
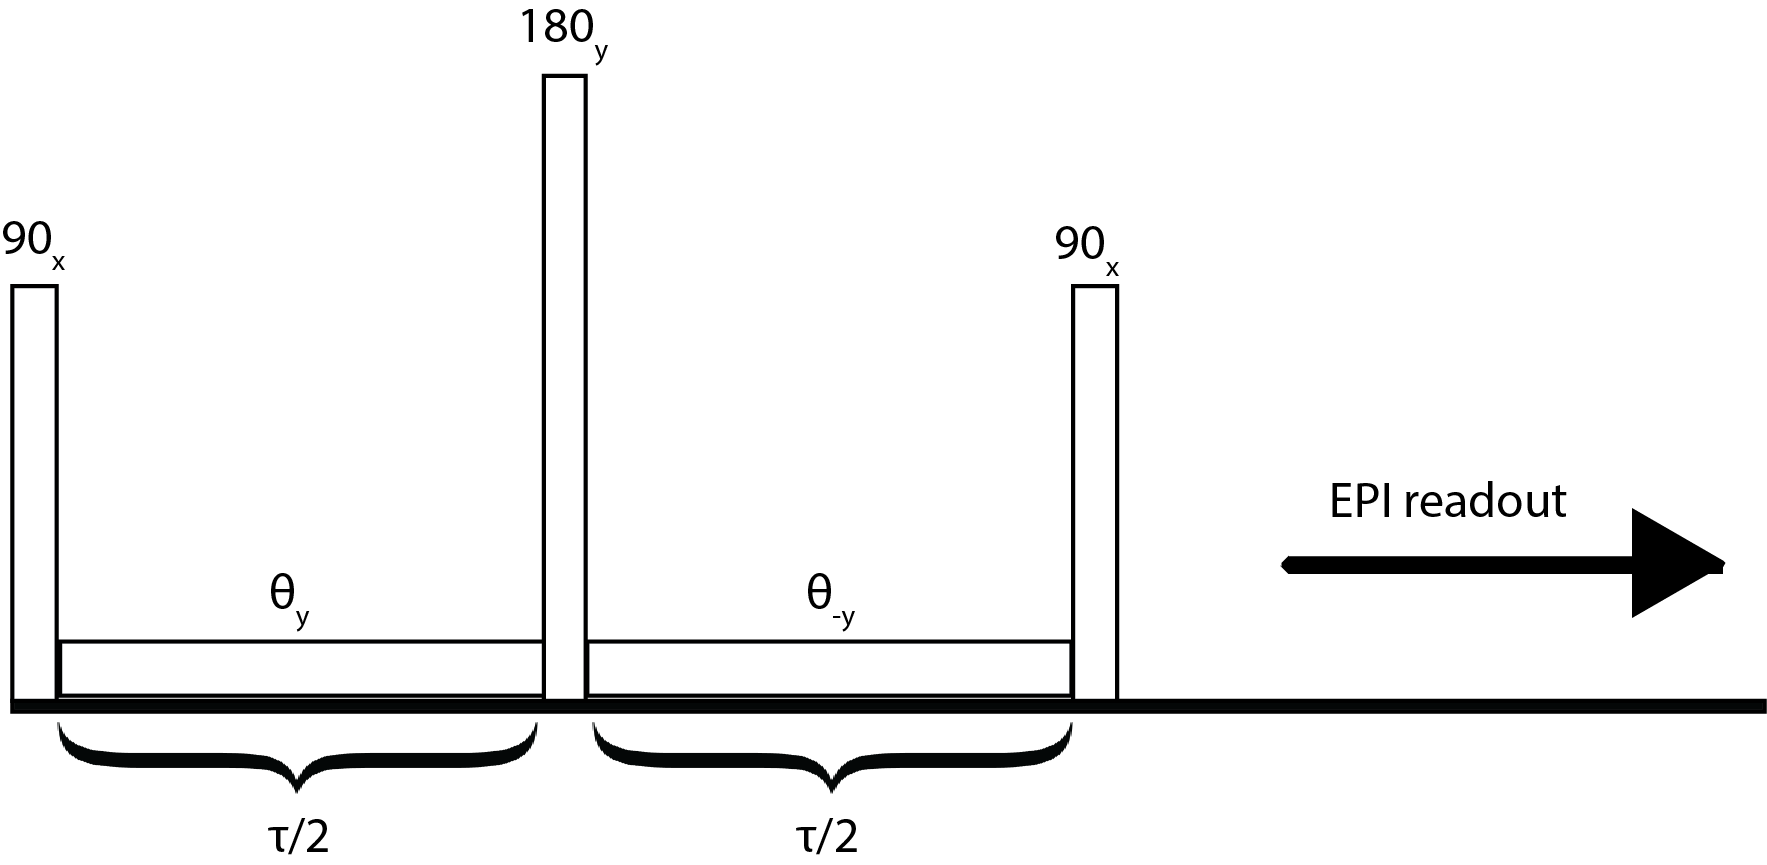
Sixteen-week-old D2-mdx (n=16) and DBA2/J wild type (n=17) male mice were used. The DBA2/J background was used because of affected Anxa6 and Ltbp4 genes involved in regeneration and fibrosis in this strain. This results in increased muscle fibrosis and decreased regeneration compared to the standard C57BL/10 background (3), shown in figure 1, leading to a phenotype more similar to that in patients. All mice were studied using a Bruker 7T PharmaScan equipped with a 23-mm volume coil. The T1Rho protocol consisted of a B0- and B1-insensitive preparation module (4,5), shown in Figure 2, followed by an EPI readout. The spin lock frequency was set to 500Hz with spin lock durations (SLD) of [5 10 20 40 60 80 100]ms. To avoid any contaminations from previous spin lock pulses, a single slice single shot EPI readout was used with NA=8; matrix=[128 64]; FOV=[20x10x1]mm; TR=4000; dummy scans=4; TE=16ms. T1Rho was compared to T2 relaxation measured with an 8 slice MSME sequence. ROIs were drawn in the gastrocnemius muscle (3 center slices in the T2 map).Results
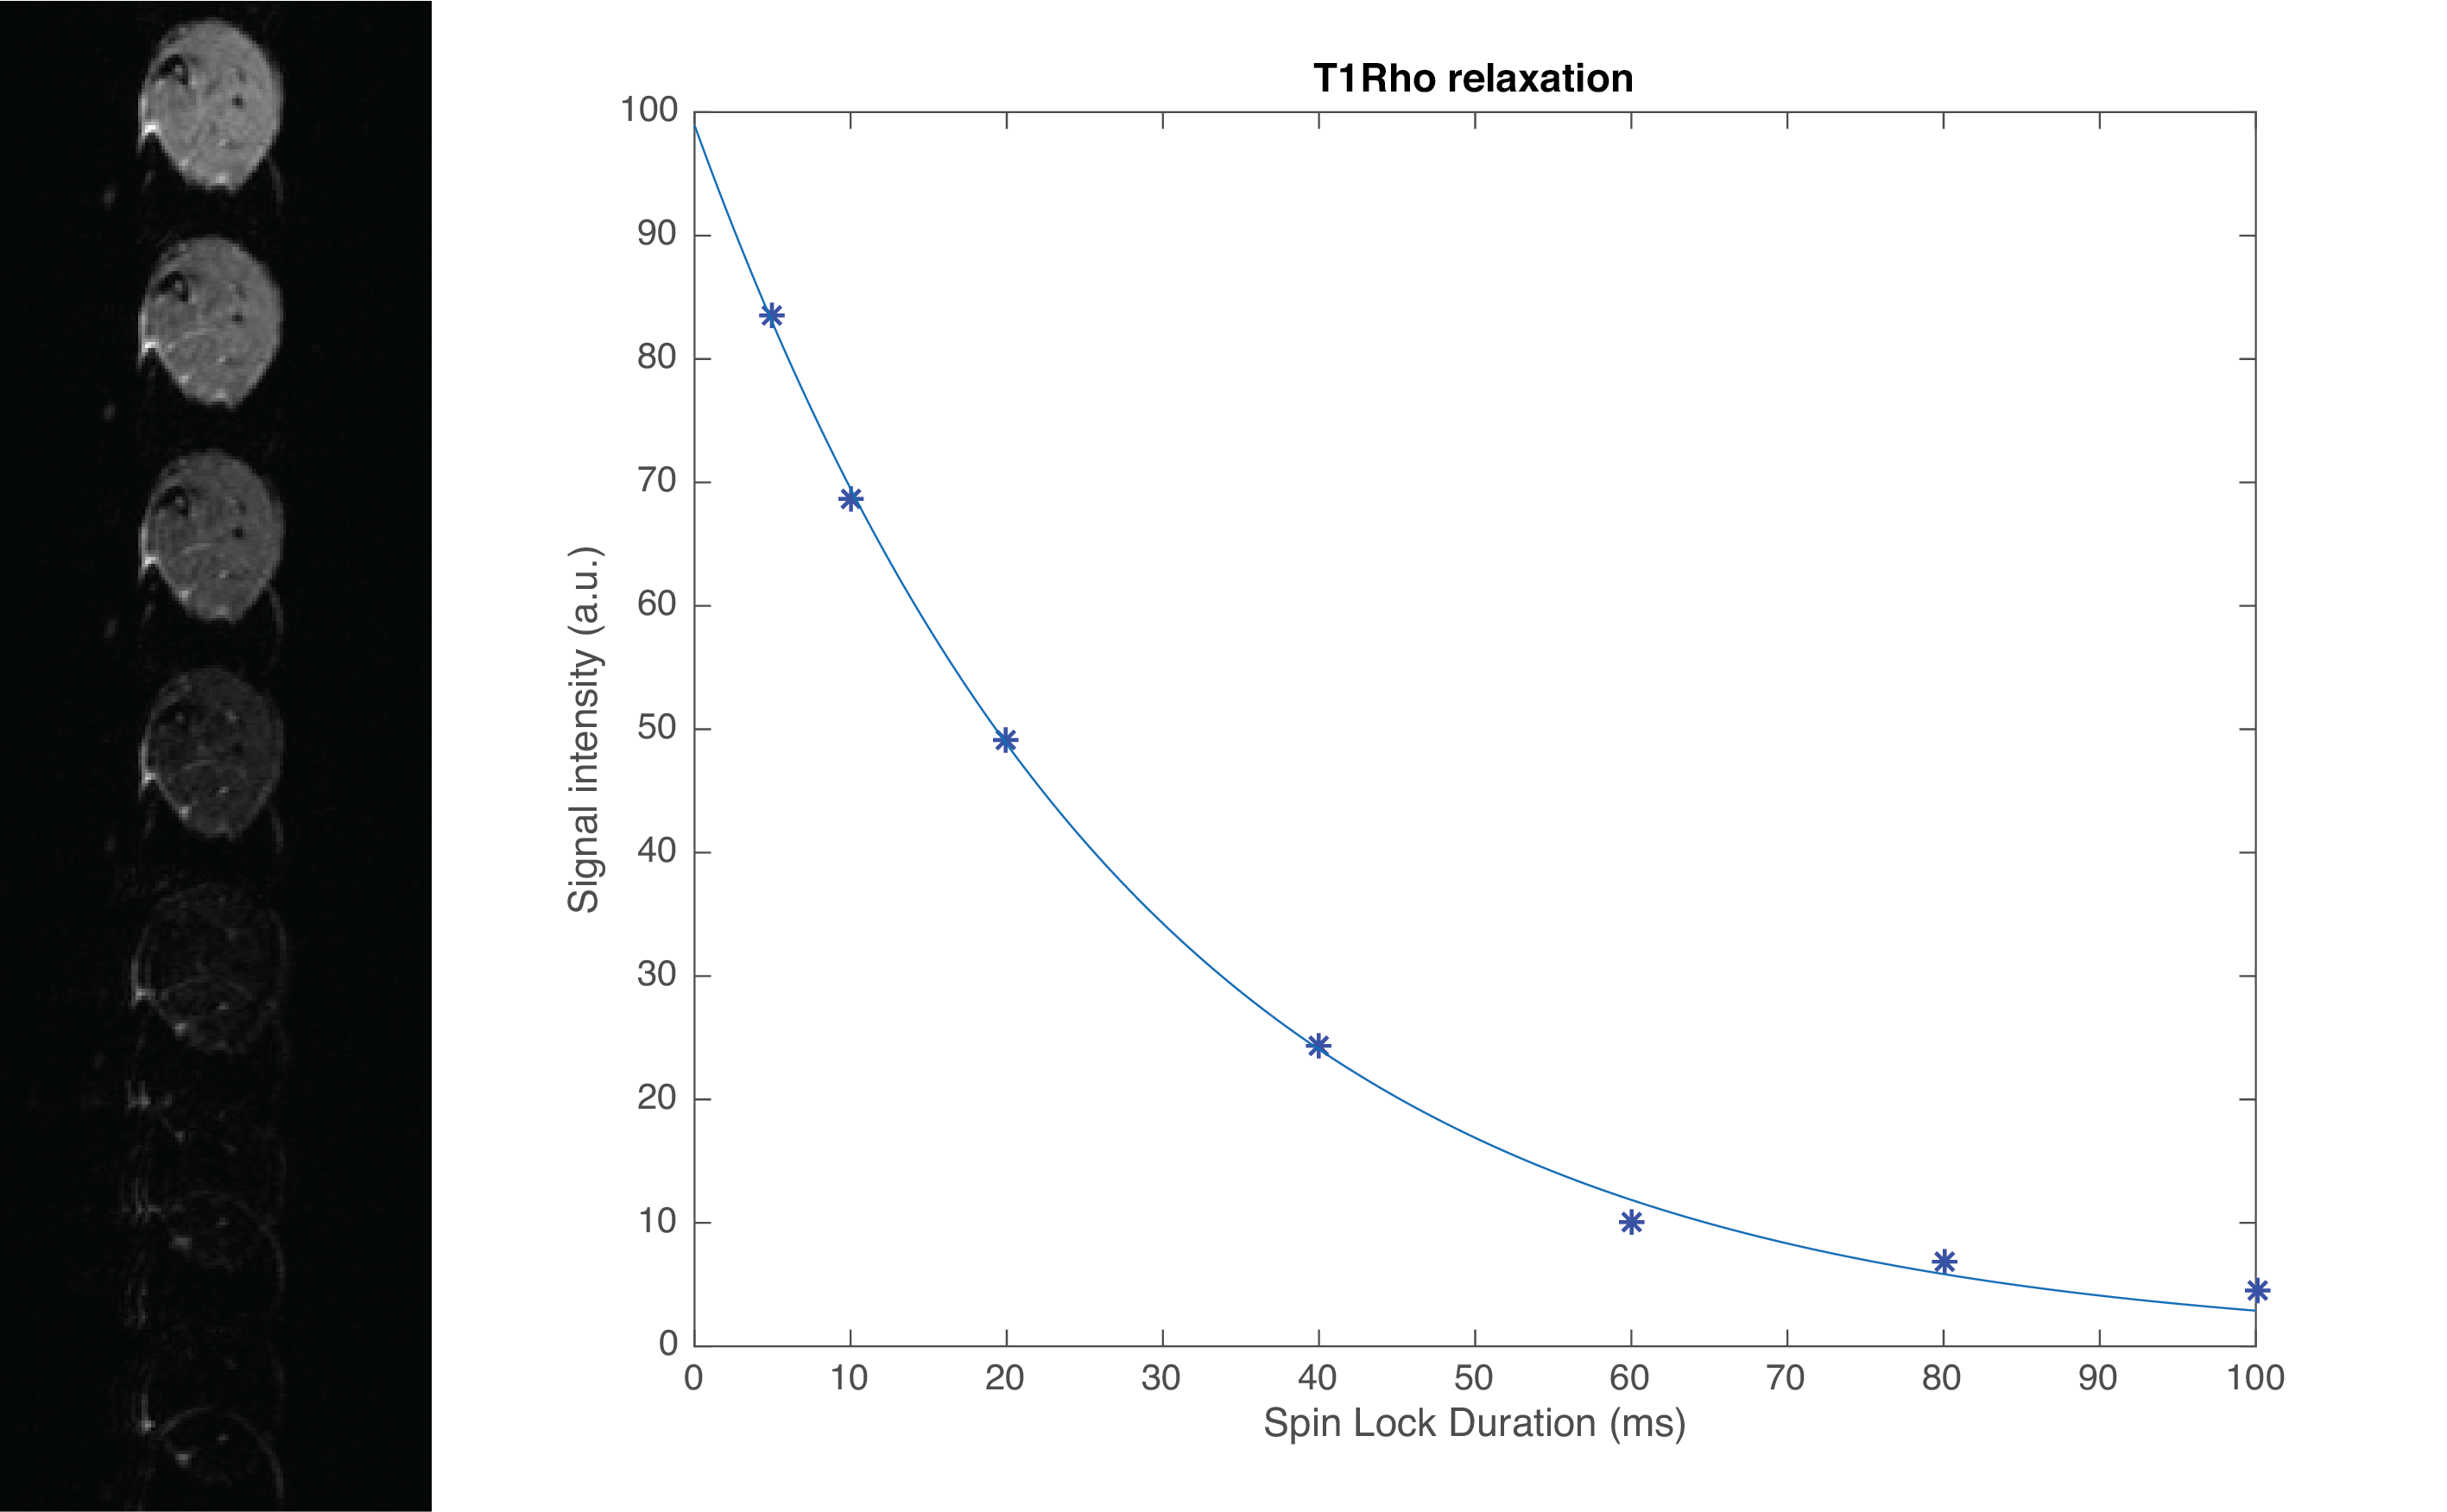
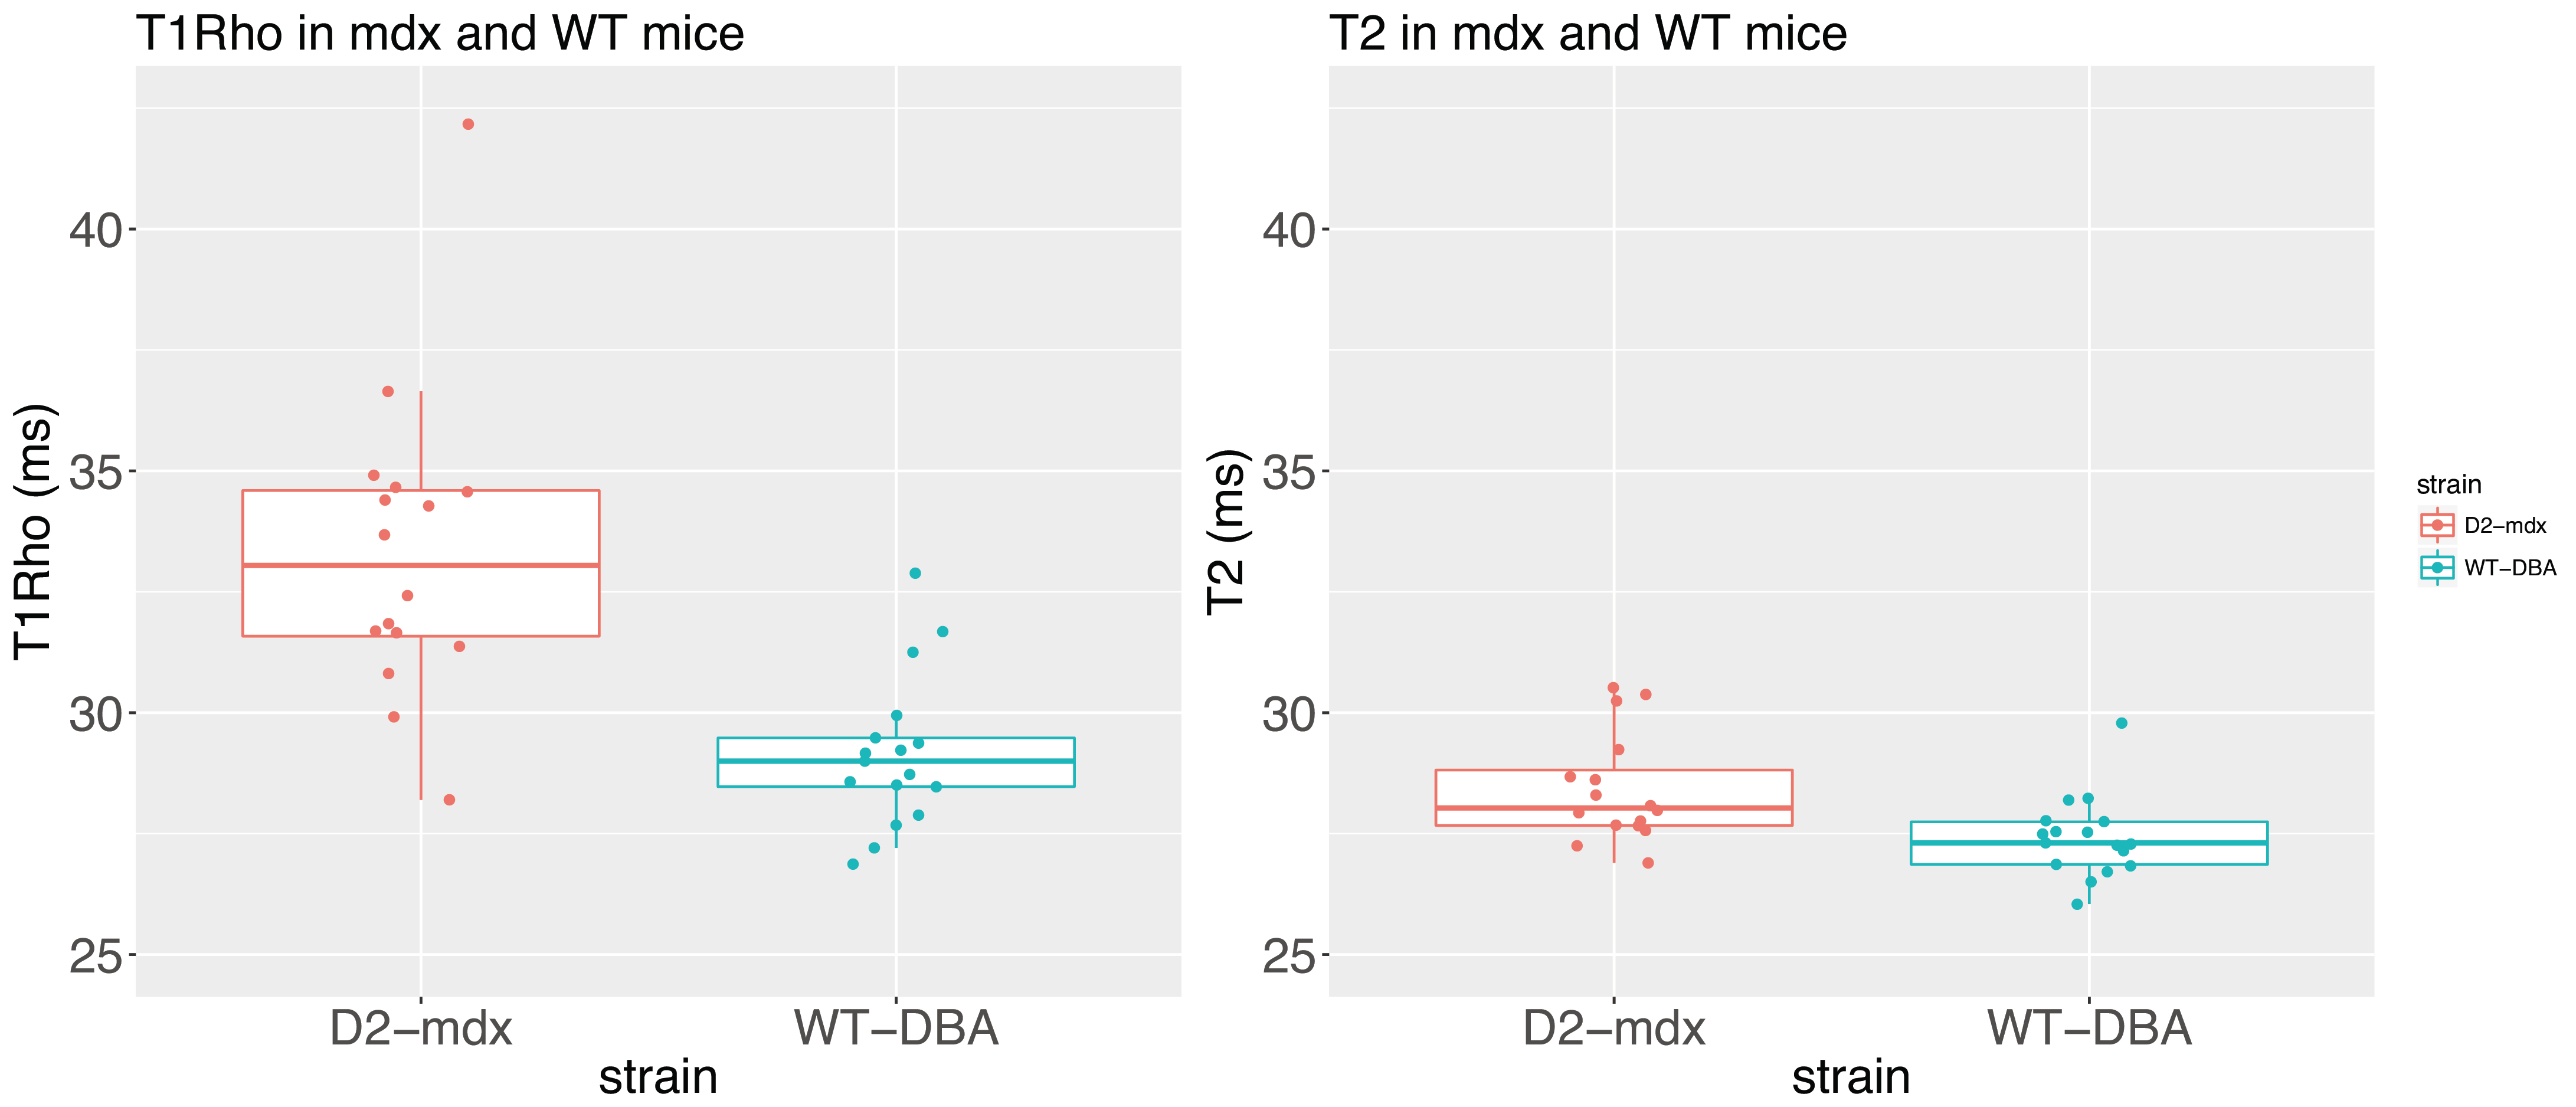
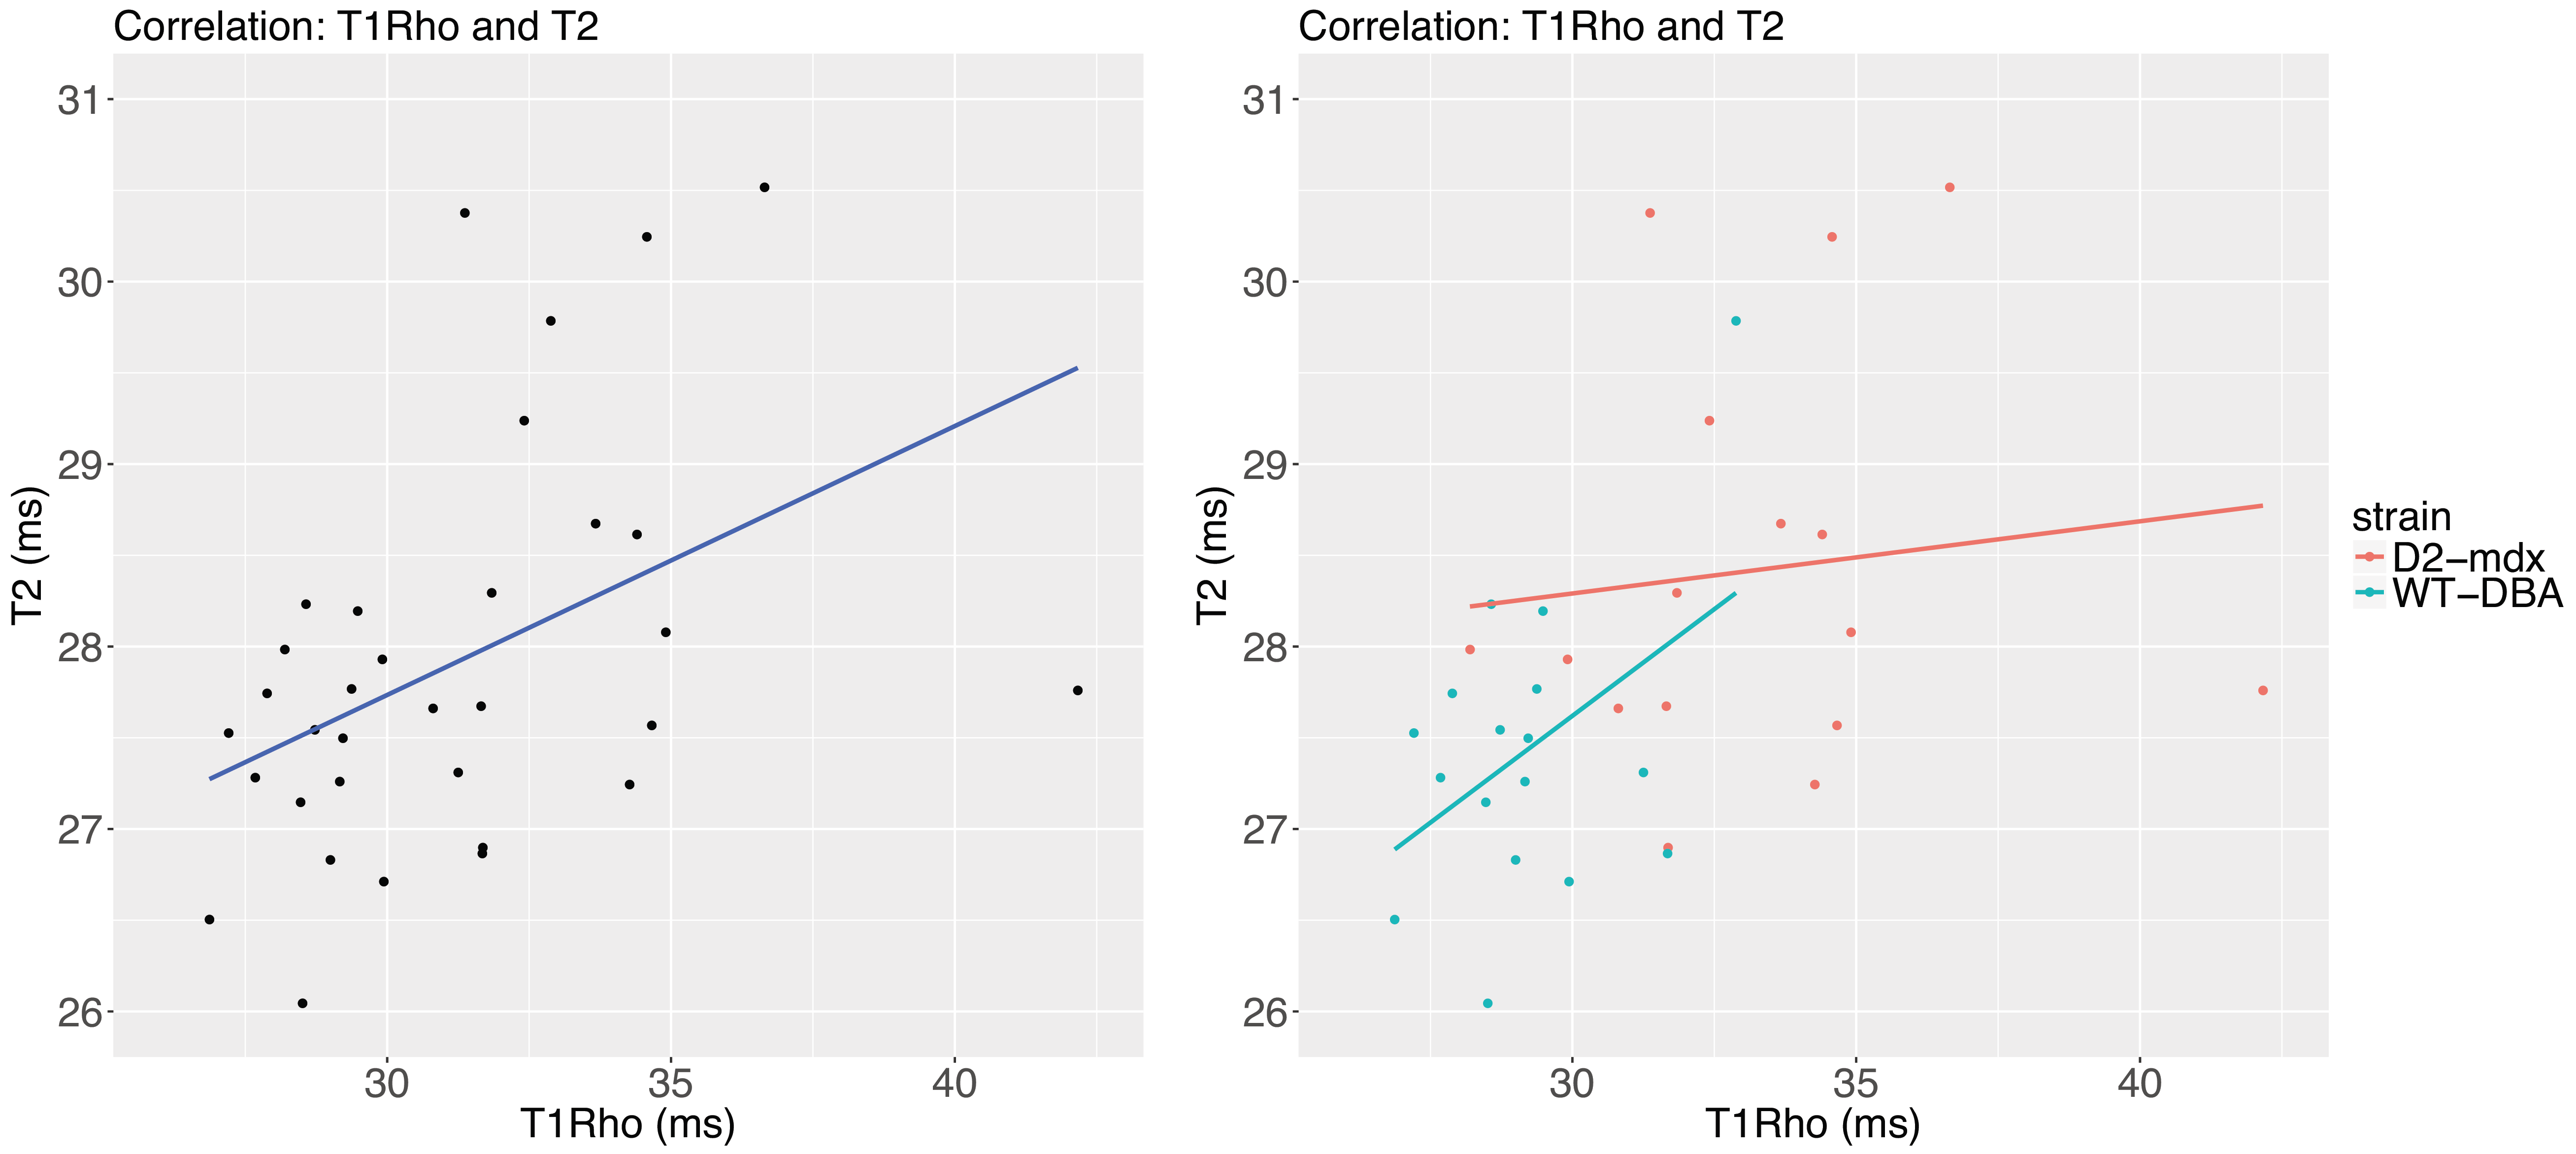
Images were successfully acquired using all SLDs. For most acquisitions the signal reached the noise floor from SLD=80ms onwards, see Figure 2. Average T1Rho was significantly increased in D2-mdx compared to DBA2/J mice (33.32+3.20ms vs 29.17+1.57ms respectively, P<0.001). Average T2 was increased as well in D2-mdx compared to DBA2/J mice (28.42+1.12 vs 27.43+0.83ms respectively, P<0.01), see Figure 4. When both D2-mdx and DBA2/J were taken into account, T1Rho and T2 correlated significantly (Pearson correlation coefficient r=0.44, P=0.01). However, only DBA2/J wild type mice contributed to this correlation (r=0.44, P=0.08), as no correlation was found in D2-mdx mice (r=0.11, P=0.68), see Figure 5.Discussion
We found significantly higher T1Rho values in D2-mdx mice characterized by increased muscle fibrosis. Although both T1Rho and T2 values were increased, the increase was more pronounced for T1Rho than for T2 (14.2% vs 3.6%), indicating that T1Rho is affected by other processes than those resulting in increased T2 values. While histological analyses on fibrosis are pending, we know from literature that fibrosis can be up 9% in 6-month-old D2-mdx (3) mice and T1Rho is sensitive to liver and cardiac fibrosis (6,7).
Next to this, although on a group level T1Rho is significantly correlated to T2 (r=0.44), the main determinant of this correlation results from wild type mice (r=0.44), as in D2-mdx mice no correlation was found. This may be due to the significant variation in the pathology severity between mice; with varying levels of fibrosis and inflammation. Therefore we aim to correlate these findings to the amount of fibrosis and inflammation in each individual animal. Additionally, it would be interesting to study the mdx-BL10 model, in which T2 is more increased, while their muscles are less fibrotic compared to D2-mdx mice.
Conclusion
A fibrosis-sensitive T1Rho sequence was
used in a mouse model characterized by increased muscle fibrosis. Significantly
higher T1Rho relaxation times were found compared to wild-type mice in which
fibrosis was absent. In the presence of pathology, T1Rho and T2 are not
correlated and reflect different aspects of muscle damage. Histological
analysis should further confirm the sensitivity of T1Rho to specifically measure
fibrosis in muscles.Acknowledgements
This work was supported by the European Union NMD-Bioimage project. Seventh Framework Programme (FP7/2007-2013) under grant agreement 602485 Bioimage-NMD project.References
1. Klingler W, Jurkat-Rott K, Lehmann-Horn F, Schleip R. The role of fibrosis in Duchenne muscular dystrophy. Acta Myol. 2012 Dec;31(3):184–95.
2. Desguerre I, Mayer M, Leturcq F, Barbet J-P, Gherardi RK, Christov C. Endomysial Fibrosis in Duchenne Muscular Dystrophy: A Marker of Poor Outcome Associated With Macrophage Alternative Activation. J Neuropathol Exp Neurol. 2009;68(7):762–73.
3. Fukada S, Morikawa D, Yamamoto Y, Yoshida T, Sumie N, Yamaguchi M, et al. Genetic background affects properties of satellite cells and mdx phenotypes. Am J Pathol. 2010;176(5):2414–24.
4. Hectors SJCG, Moonen RPM, Strijkers GJ, Nicolay K. T1 ρ mapping for the evaluation of high intensity focused ultrasound tumor treatment. Magn Reson Med. 2015 Apr;73(4):1593–601.
5. Witschey WRT, Borthakur A, Elliott MA, Mellon E, Niyogi S, Wallman DJ, et al. Artifacts in T1 rho-weighted imaging: compensation for B(1) and B(0) field imperfections. J Magn Reson. 2007 May;186(1):75–85.
6. Wang C, Zheng J, Sun J, Wang Y, Xia R, Yin Q, et al. Endogenous contrast T1rho cardiac magnetic resonance for myocardial fibrosis in hypertrophic cardiomyopathy patients. J Cardiol. Japanese College of Cardiology; 2015;66(6):520–6.
7. Wang Y-X, Yuan J, Chu E, Go MYY, Huang H, Ahuja A, et al. T1 r MR Imaging Is Sensitive to Evaluate Liver Fibrosis : An Experimental Study in a Rat Biliary Duct Ligation Model 1 Purpose : Methods : Results : Radiology. 2011;259(3):712–9.
Figures