0816
Multi-parametric MR shows increased T2 heterogeneity in fat infiltrated muscles in Becker Muscular Dystrophy1Radiology, Amsterdam Medical Center, Amsterdam, Netherlands, 2Radiology; C.J. Gorter Center for High Field MRI, Leiden University Medical Center, Leiden, Netherlands, 3Radiology, University Medical Center Utrecht, Utrecht, Netherlands, 4Neurology, Leiden University Medical Center, Leiden, Netherlands
Synopsis
Quantitative MR is increasingly used to assess muscle damage in muscular dystrophies, including BMD. Early markers that reflect changes in muscle tissue are becoming increasingly important with therapies aimed at preserving muscle tissue. This study used a multi-modal MR approach to examine diffusion properties, the average water T2 and SD of the water T2 in non-fat-infiltrated and fat-infiltrated muscles in BMD. Our results indicate that none of the proposed measures are sensitive to muscle tissue changes prior to the replacement of muscle tissue by fat and that only T2 heterogeneity is sensitive to muscle tissue changes in the presence of fat in patients with BMD.
Introduction:
In Becker muscular dystrophy (BMD), muscles are progressively infiltrated with fat and fibrosis resulting in muscle weakness1. Quantitative MR is increasingly used to assess muscle damage in muscular dystrophies (MD)2-3, including BMD4-5. Therapy development in MD is aimed at preserving muscle tissue and the replacement of muscle tissue by fat is considered an irreversible process. Therefore, non-invasive outcome measures that reflect changes in muscle tissue itself and/or that are sensitive to changes occurring prior to fat infiltration are critically needed. Good candidate MR techniques could be Diffusion Tensor Imaging (DTI), as it is sensitive to micro-structural changes in muscle injury6 and both the average water T2 and water T2 heterogeneity as they have shown to be sensitive to inflammation and fibrosis in MD7-8.The aim of this study was to examine diffusion properties and water T2 relaxation times in fat infiltrated and non-fat infiltrated lower leg muscles of BMD patients.Methods:
MR datasets were acquired in the lower leg of 22 BMD patients (age: 41.4±13.6 yrs) and 13 controls (age: 43±13.7 yrs) on a Philips Ingenia 3T system using a 16-channel receive coil. The protocol consisted of DTI (SE; TR/TE 2990/49ms; NSA 6; b-values 0/450 s/mm2; voxel size 2x2x6mm; no gap; 12 slices; SSGR, SPAIR and selective suppression of the olefinic fat9), 3-point DIXON images to determine muscle fat fraction (TR/TE/∆TE 210/4.41/0.76ms; FA 8°; voxel size 1x1x10mm; gap 5mm;) and multi-echo SE images to assess the mean and SD of water T2 relaxation times (17echoes;TR/TE/∆TE 3000/7.6/7.6ms; voxel size 1.4x1.8x10mm; gap 20mm; 5 slices).Data-analysis:
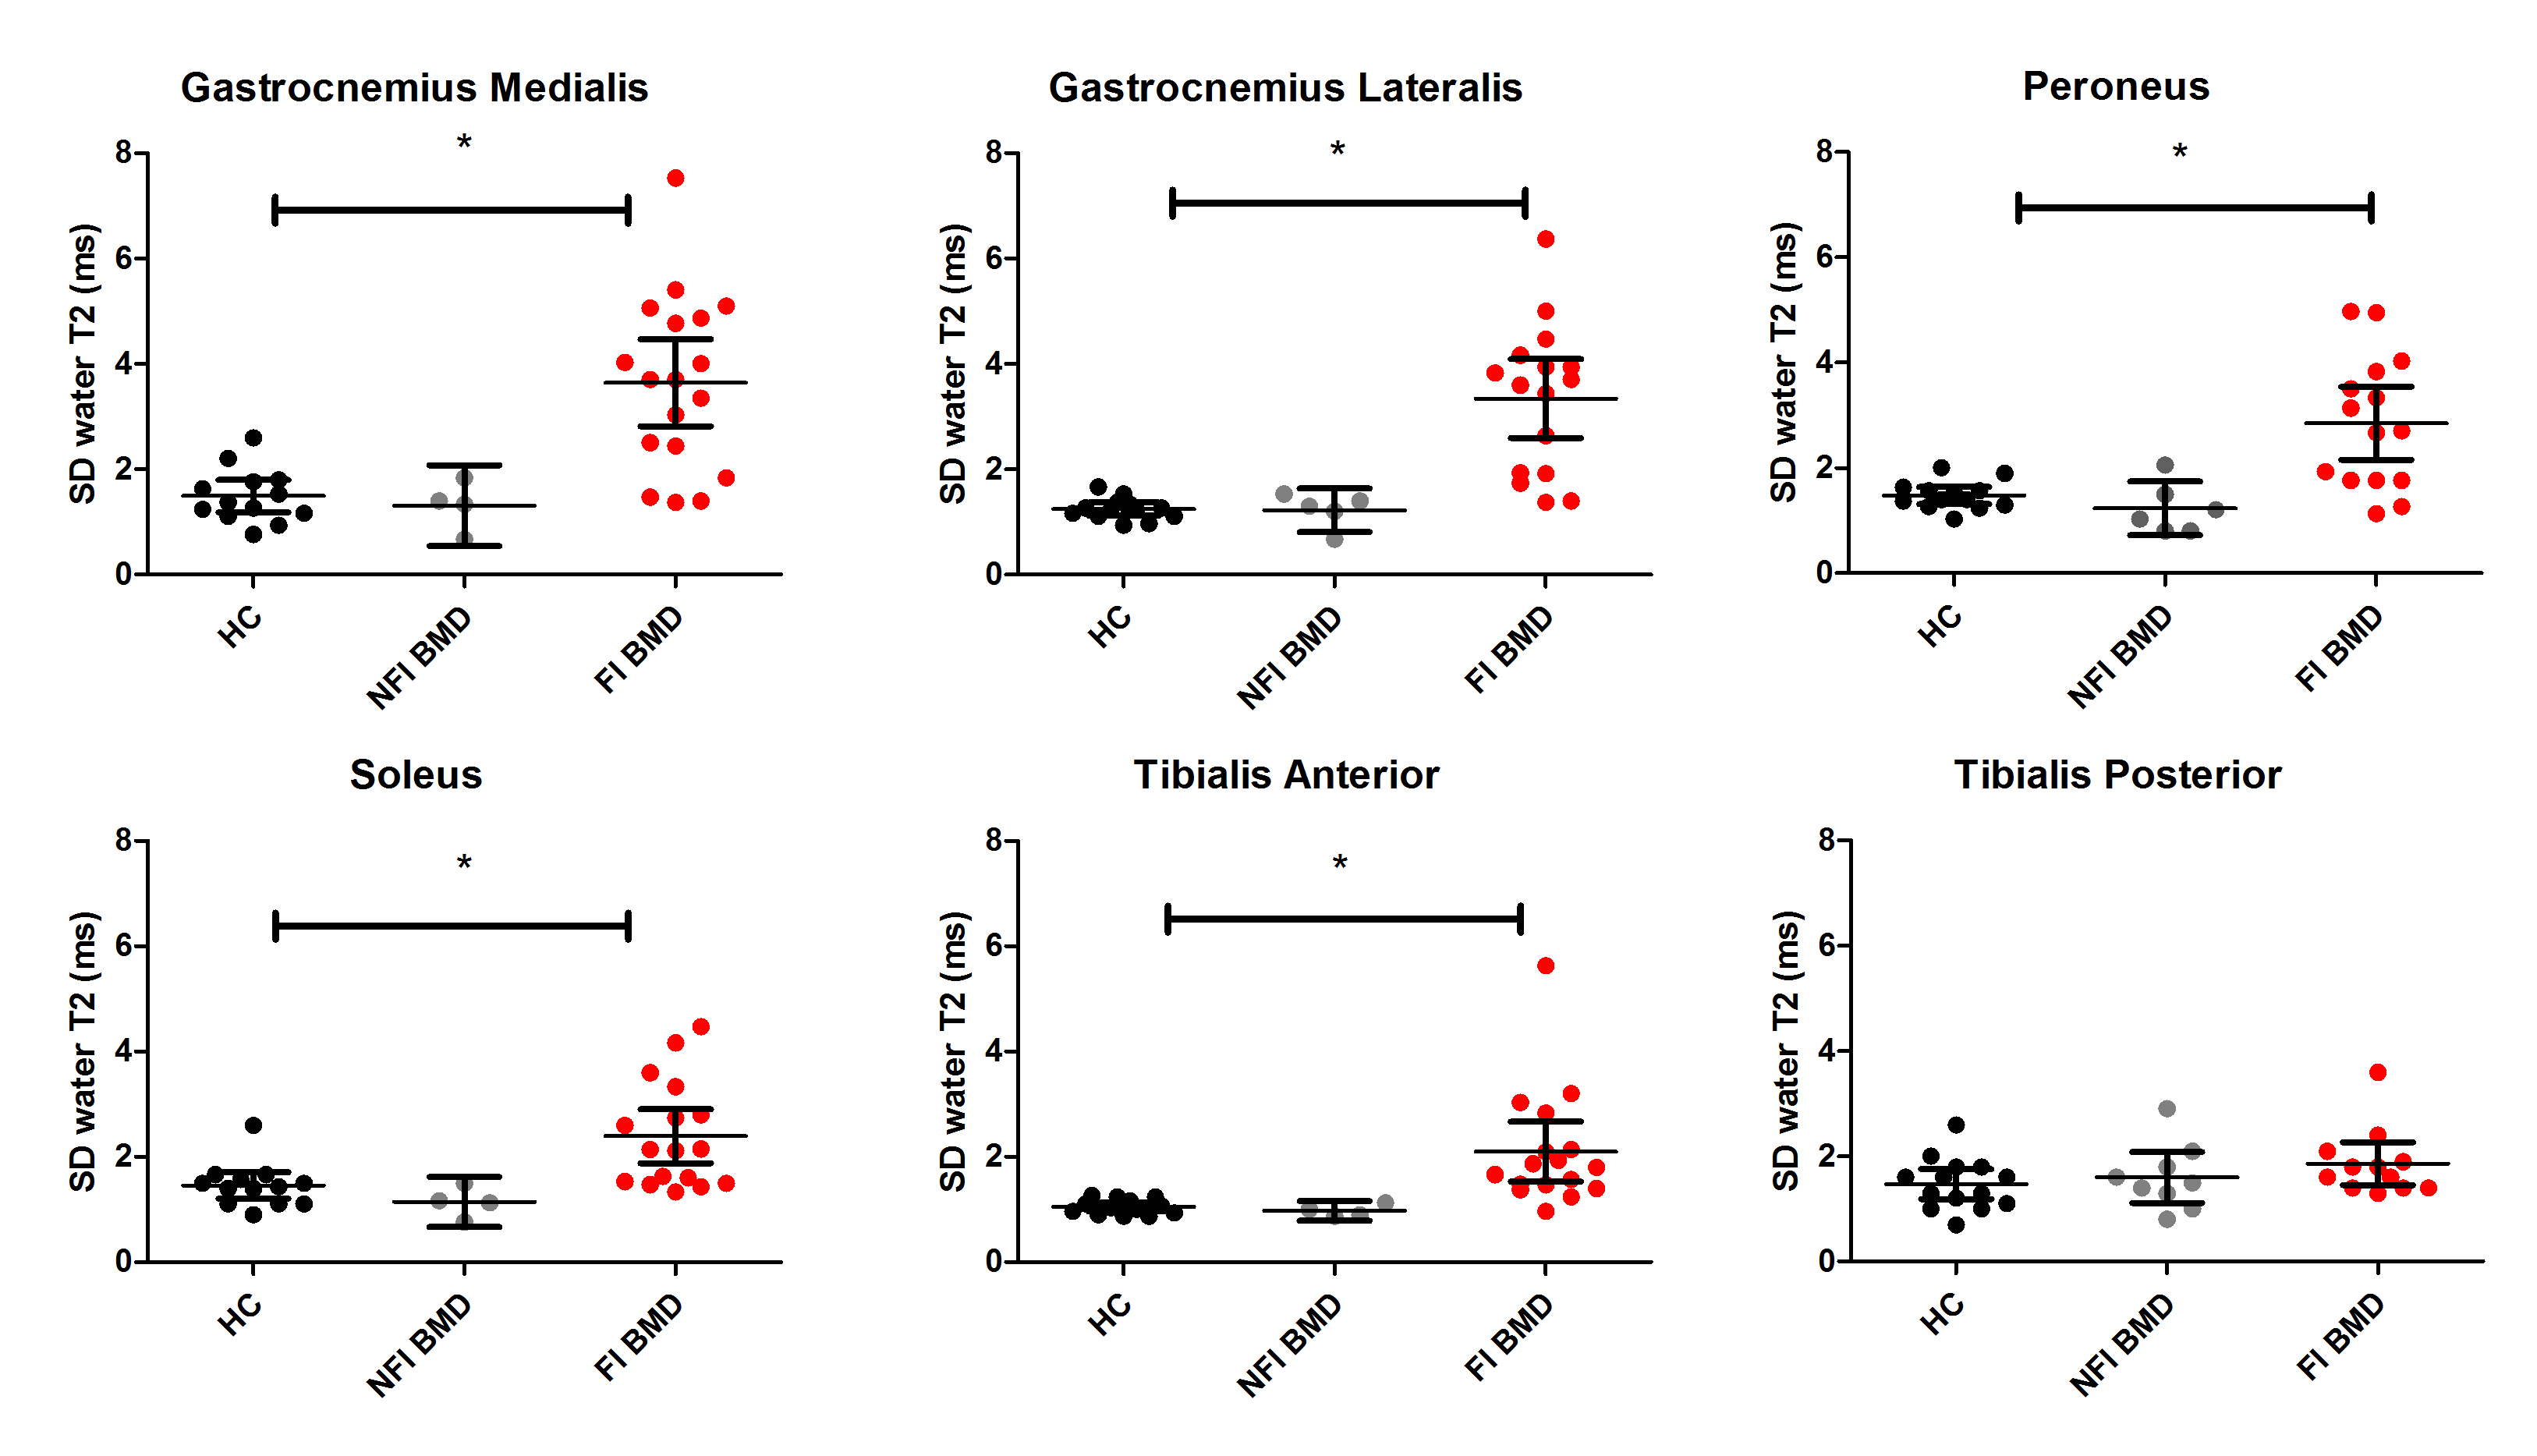
Diffusion data were de-noised, registered and corrected for eddy currents. Eigenvalues were estimated according to a WLLS fit and FA and MD were obtained. Fat fraction maps were reconstructed using a 6 peak fat model. Water T2 maps were reconstructed using an EPG algorithm10. DTI-datasets with SNR levels >20 and %fat >50 were excluded from the analysis11. All outcome parameters were determined in ROIs drawn for the gastrocnemius medialis (GCM) and lateralis (GCL), soleus (SOL) peroneus (PER), tibialis anterior (TA) and posterior (TP) muscle and reported as their mean value over multiple slices. All muscles of the BMD patients were classified into two groups according to their fat fraction: Non Fat Infiltrated muscles BMD (NFI BMD) and Fat Infiltrated muscles BMD (FI BMD). Cut-off values were based on the mean fat fraction +2*SD of that specific muscle in controls12. Differences between the groups were assessed on a muscle by muscle basis using a Kruskal-Wallis test corrected for multiple comparisons, the p-value was set to <0.001.Results:
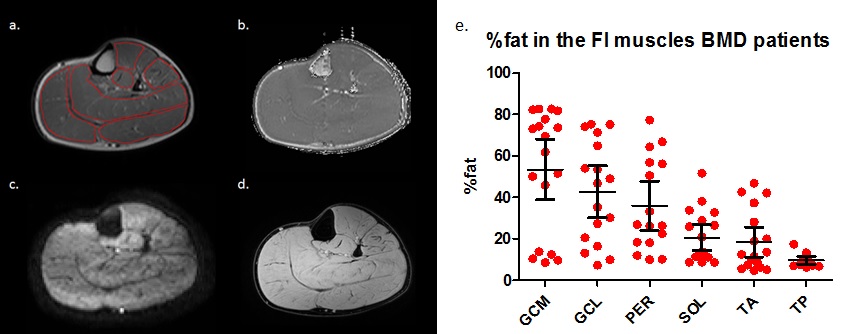
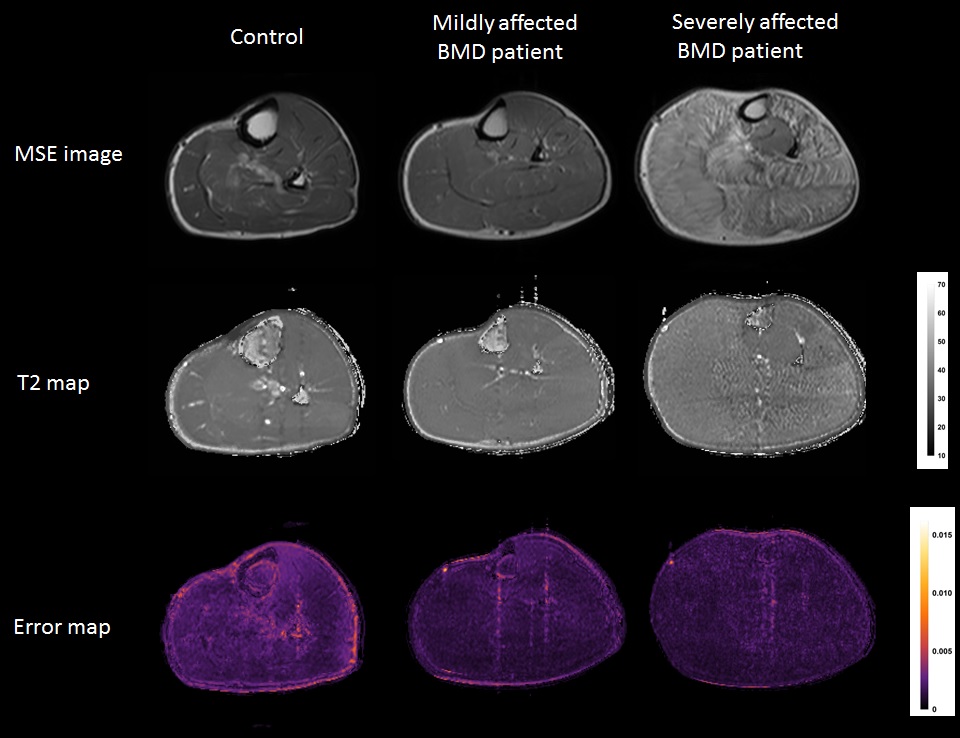
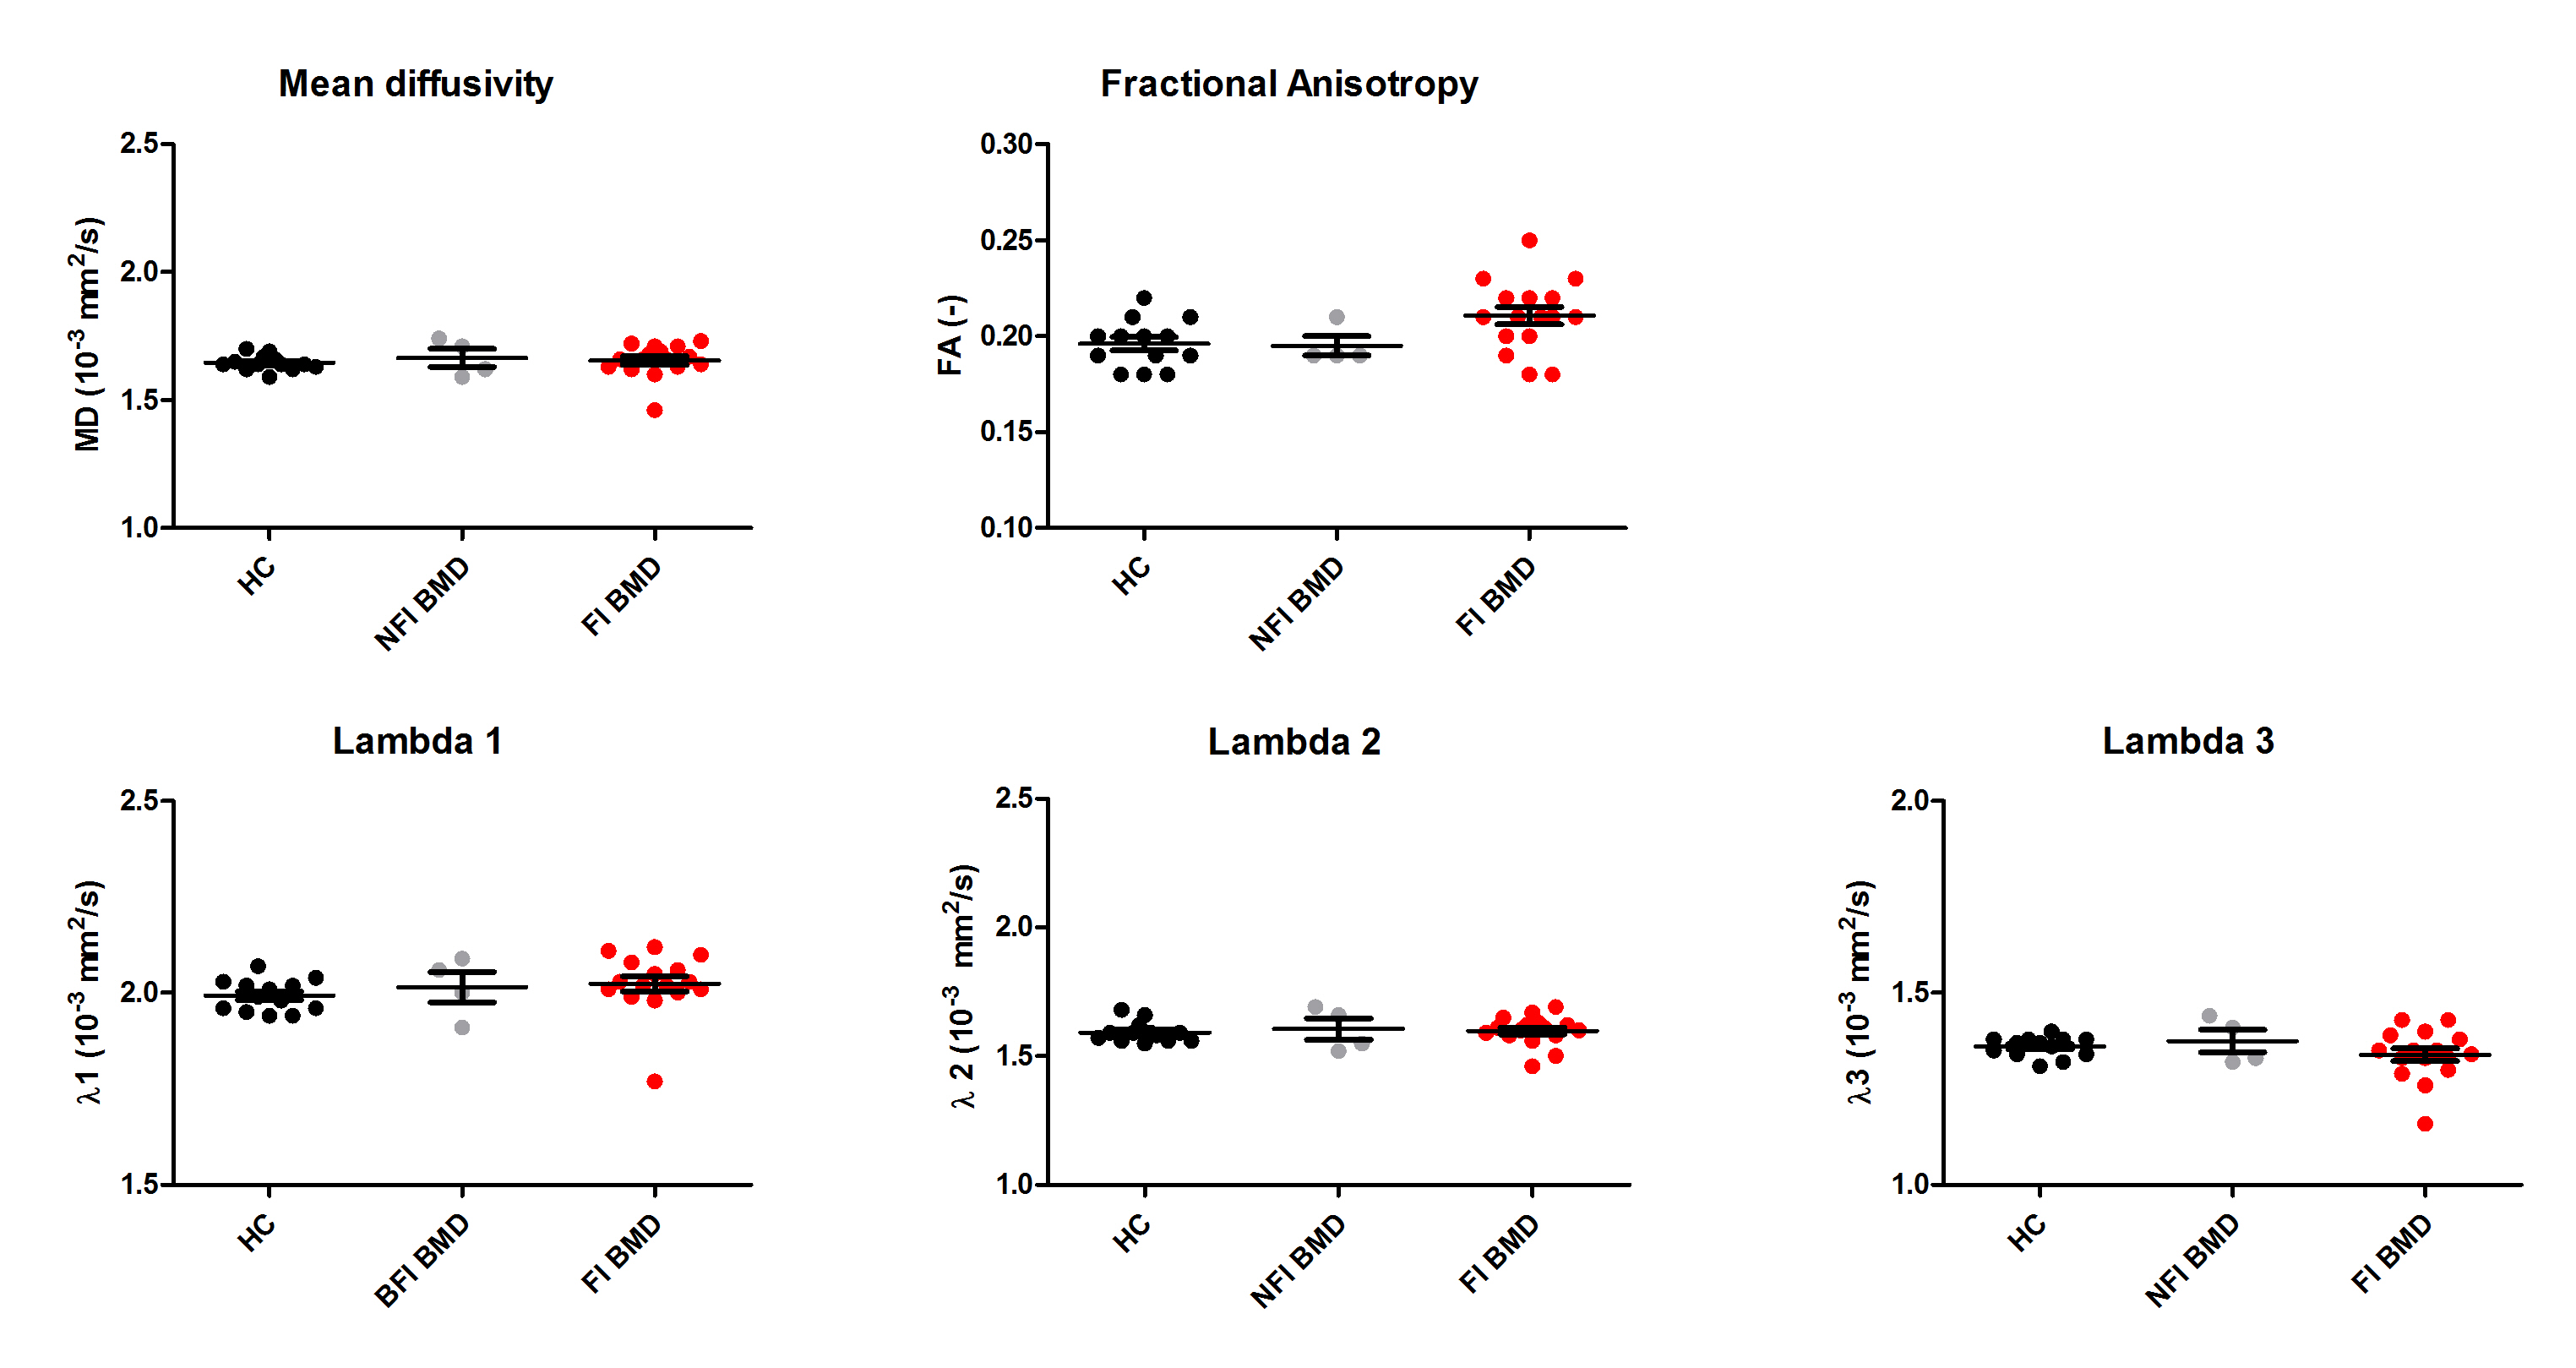
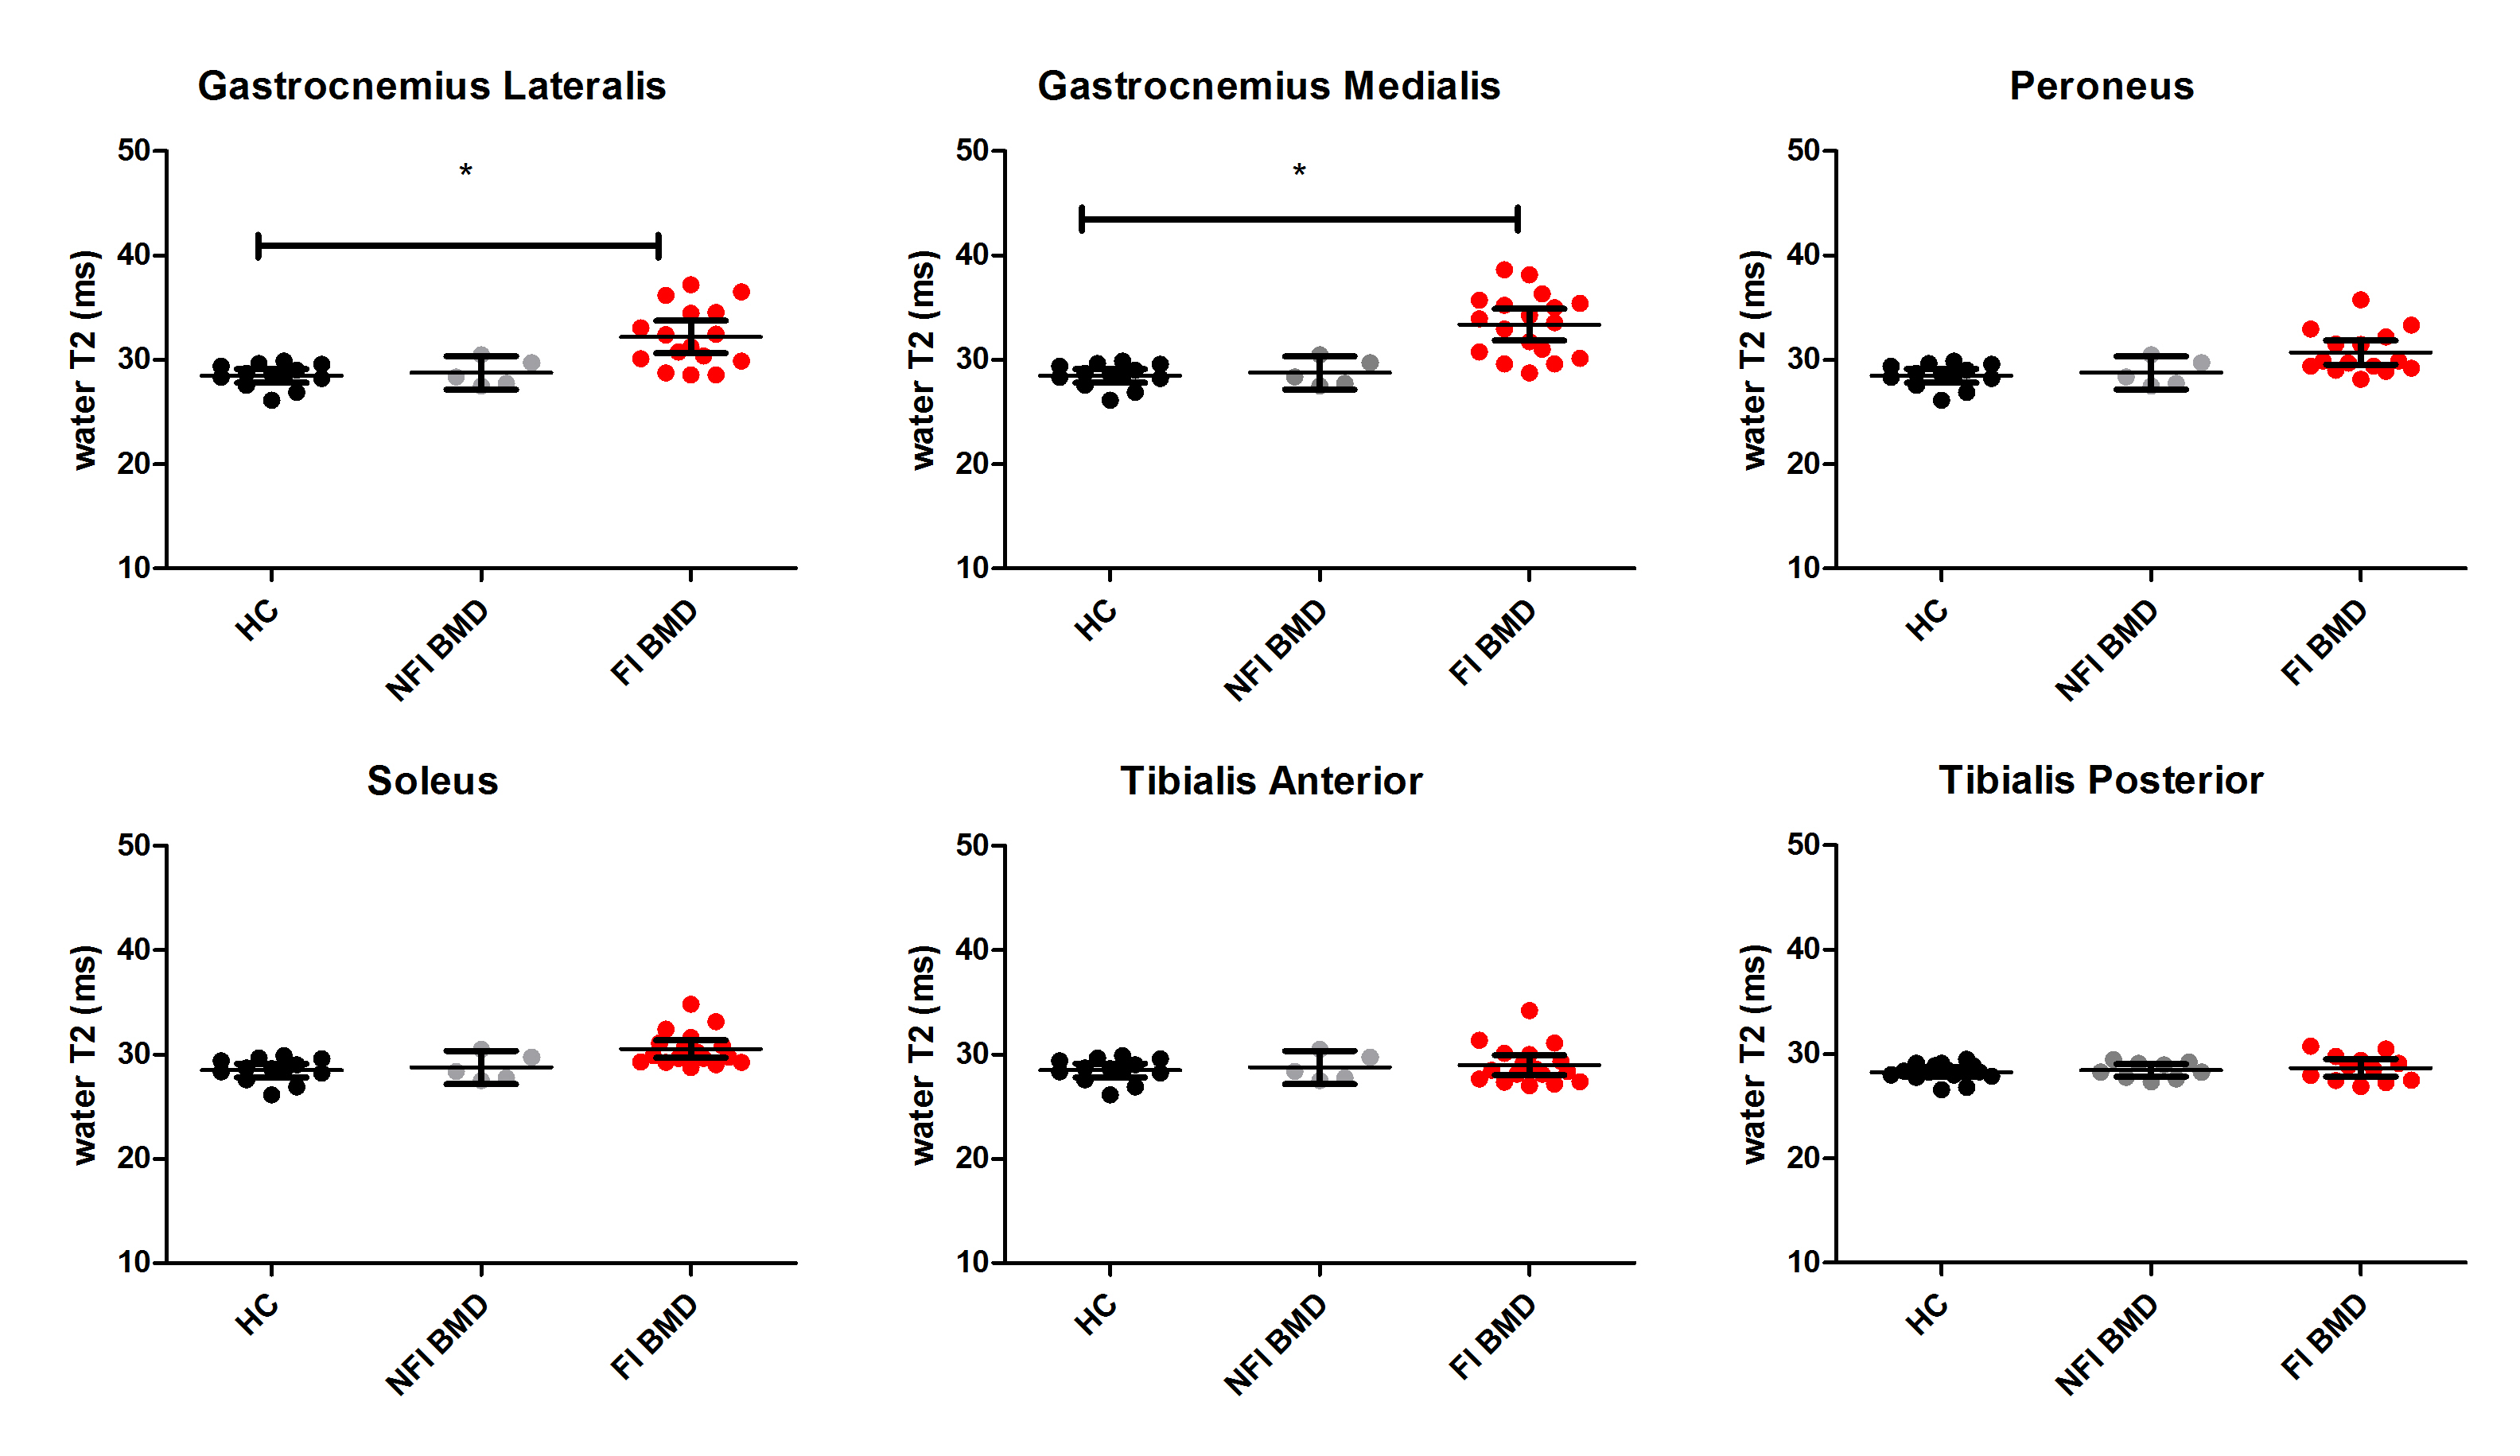
Multi-parametric axial images of a representative BMD patient are shown in figure 1. The NFI/FI BMD subgroups were divided as follows; GCM/TA/SOL n=4/18, GCL n= 5/17 PER n= 6/16, TP n=9/13. The distribution in %fat in the FI BMD group is shown in figure 1e. Error maps of the residual of the EPG fit were homogeneous and consistent in all datasets (Fig.2). Between group-analysis showed similar DTI and average water T2 values for all groups, except for a significantly elevated water T2 in the GCM and GCL muscle in FI BMD group compared to controls (p-value <0.0003)(Fig.3-4). The SD T2 was significantly elevated for all analysed muscles in the FI BMD group(p-value <0.0001), except for the TP muscle (p-value= 0.21)(Fig.5).Discussion:
Only muscles that are far in the disease process in BMD, as defined by elevated fat fractions, showed changes in our multi-modal MR protocol. The similar diffusion properties between the groups indicate that the possible changes in muscle microstructure cannot be detected by SE-DTI in BMD. This could be related to the partially functioning dystrophin protein, or to the limited sensitivity of the SE-DTI technique due to the short diffusion times. The minor increase in average T2 in two FI muscles suggests that there is no clear inflammatory component in BMD, which is in agreement with previous work13-14. Although an increase in T2 heterogeneity could be detected, it was only observed in highly infiltrated muscles. The consistency in error maps across FI and NFI datasets indicates that this increase is not likely to be confounded by fat but rather reflects an actual increase in heterogeneity. This could potentially be caused by the competing effects of fibrosis and inflammation on the water T215.Conclusion
Our results indicate that none of the proposed measures are sensitive to muscle tissue changes prior to the replacement of muscle tissue by fat and that only T2 heterogeneity is sensitive to muscle tissue changes in the presence of fat in patients with BMD.Acknowledgements
No acknowledgement found.References
1] Petrof BJ, Shrager JB, Stedman HH, Kelly AM, Sweeney HL. Dystrophin protects the sarcolemma from stresses developed during muscle contraction. Proc. Natl Acad Sci USA 1993;90(8):32710-3714 et al 1993
2] Willcocks RJ, Rooney WD, Triplett WT, Forbes SC, Lott DJ et al. Multi-center propective longitudinal study of magnetic resonance biomarkers in a large Duchenne muscular dystrophy cohort.Ann neurol. 2016 Apr;79(4):535-47
3] Janssen BH, Voet NB, Nabuurs CI, Kan HE, de Rooy JW, Geurts AC et al. Disitinct pahses in muscles of fasciosscapulohumeral dystrophy patients identified by MR detected fat infiltration. Plose one. 2014: Jan 14;9(1):e85416
4] Tasca G, Lannaccone E, Monforte M, Masciullo M, Bianco F, Laschena F et al. Muscle MRI in Becker Muscular Dystrophy. Neuromuscul Disord. 2012 Oct 1;22
5] Lokken N, Hedermann G, Thomsen C, Vissing J. Contractile properties are disrupted in Becker muscular dystrophy but not in limb girdle type 2I. Ann Neurol 2016; Sep;8(3):466-71
6] Zaraiskaya T, Kumbhare D, Noseworthy MD. Diffusion Tensor Imaging in evaluation of human skeletal muscle injury. J Magn Reson Imaging 2006; 24:42-408
7] Arpan I, Willcocks RJ, Forbes SC, Finkel RS, Lott DJ, Rooney WD et al. Examination of effects of corticosteroids on skeletal muscles of boys with DMD using MRI and MRS. Neurology 2014 Sep 9;83(11):974-80
8] Thibaud JL, Azzabou N, Barthelemy I, Fleury S, Cabrol L, Blot S, Carlier PG. Comprehensive longitudinal charecterization of canine muscular dystrophy by serial NRM imaging of GRMD Dogs. Nueromusc Disord. 2012 Oct 1;22
9] Williams SE, Heemskerk AM, Welch EB, Li K, Damon BM, park JH. Quantitative effects of inclusion of fat on muscle diffusion tensor MRI measurement. J Magn Reson Imaging 2013; 38±1292/1297
10] Marty B, Baudin PY, Reygnoudt H, Azzabou N, Araujo EC, Carlier PG, de Sousa PL. Simultaneous muscle water T2 and fat fraction mapping using transverse relaxometry with stimulated echo compensation. NMR in Biomed 2016 Apr; 29(4):431-43
11] Hooijmans MT, Damon, BM, Froeling M, Versluis MJ, Burakiewicz J, Vershuuren JJGM, et al. Evaluation of skeletal muscle DTI in patients with duchenne muscular Dystrophy NMR in Biomed. 2015 Nov; 28(11):1589:97
12] Wokke BH, Hooijmans MT, van den Bergen JC, Webb AG, Verschuuren JJGM, Kan HE. NMR in Biomed 2014 Nove;27(11):1371-7
13] Dennett X, Shield LK, Clingan LJ, Woolley DA. Becker and Duchenne muscular dystrophy: a comparative morphological study. Aust Paediatr. 1988; 24 Suppl1:15:20
14] Wokke BH, van den Bergen JC, Hooijmans MT, Verschuuren JJGM, Niks EH, Kan HE. T2 relaxation times are increased in skeletal muscle of DMD but not BMD patients. Muscle Nerve 2016; Jan;53(1):38-43
15] Hogrel JY, Wary C, Moraux A, Azzabou N, Decostre V, Ollivier G et al. Longitudinal functional and NRM assessment of upper limbs in Duchenne Muscular Dystrophy. Neurology 2016 Mar 15;86(11):1022-30
Figures