0815
Water T2 mapping in fatty infiltrated thigh muscles of patients with neuromuscular diseases using a T2-prepared 3D TSE with SPAIR1Department of Diagnostic and Interventional Radiology, Technical University of Munich, Munich, Germany, 2Department of Diagnostic and Interventional Neuroradiology, Technical University of Munich, Munich, Germany, 3Friedrich-Baur-Institut, Ludwig Maximilian University, Munich, Germany, 4Department of Neurology, Technical University of Munich, Munich, Germany
Synopsis
In patients with neuromuscular diseases muscle water T2 is an important biomarker to monitor disease activity and therapy effectiveness. Especially, the thigh is of interest showing disease-characteristic patterns of involvement. Different T2 mapping approaches, routinely based on MESE, have been developed to minimize the effect of confounding factors. An alternative method is the T2Prep 3D-TSE combined with SPAIR. However, it remains unknown, how T2Prep 3D-TSE performs in the presence of fat. This work simulates the effect of SPAIR and T2preparation on the 3D-TSE readout in the presence of fat and compares T2Prep 3D-TSE and 2D-MESE to MRS in 34 patients.
Purpose
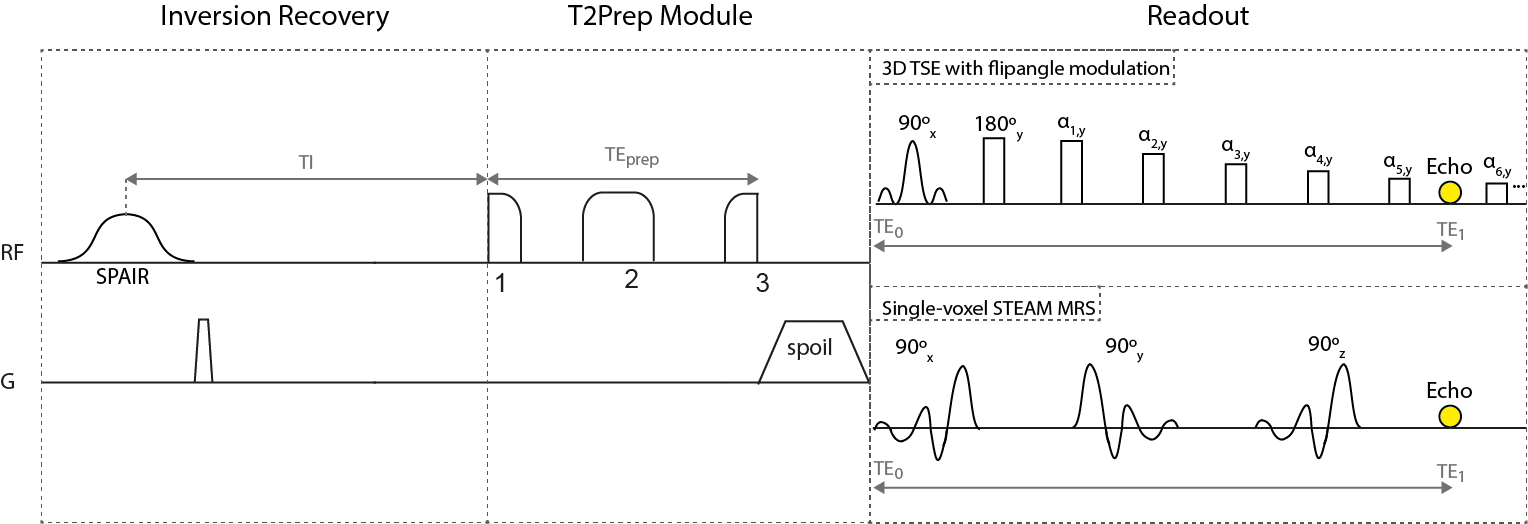
Muscle water T2 (T2w) has been proposed as an important biomarker in patients with neuromuscular diseases (NMD) to monitor disease activity and therapy effectiveness1-3. Especially the thigh is of high interest showing disease-characteristic patterns of involvement4. 2D-MESE sequences have been mostly used for T2 mapping with limitations including the sensitivity to B1-inhomogeneities and fat on T2 quantification1. Extended phase graph (EPG) techniques have been applied on 2D-MESE data to remove the effects of B1-inhomogeneities5,6. Techniques modeling the presence of fat based on Dixon MESE data7 or on MESE data combined with a multi-exponential T2 decay model without8 or with EPG6 have been proposed to remove the effect of fat. An alternative approach to reduce the effect of B1-inhomogeneities already during signal acquisition is the usage of an adiabatic BIR-4 T2preparation and a 3D turbo spine echo read-out (T2Prep 3D-TSE)9,10 (Figure 1). However, it remains unknown, how the T2 quantification based on T2Prep 3D-TSE is affected by the presence of fat. This work investigates the performance of the T2Prep 3D-TSE combined with spectral adiabatic inversion recovery (SPAIR) fat suppression in measuring T2w in fatty infiltrated thigh muscles of patients with NMD compared to 2D-MESE and MRS.Methods
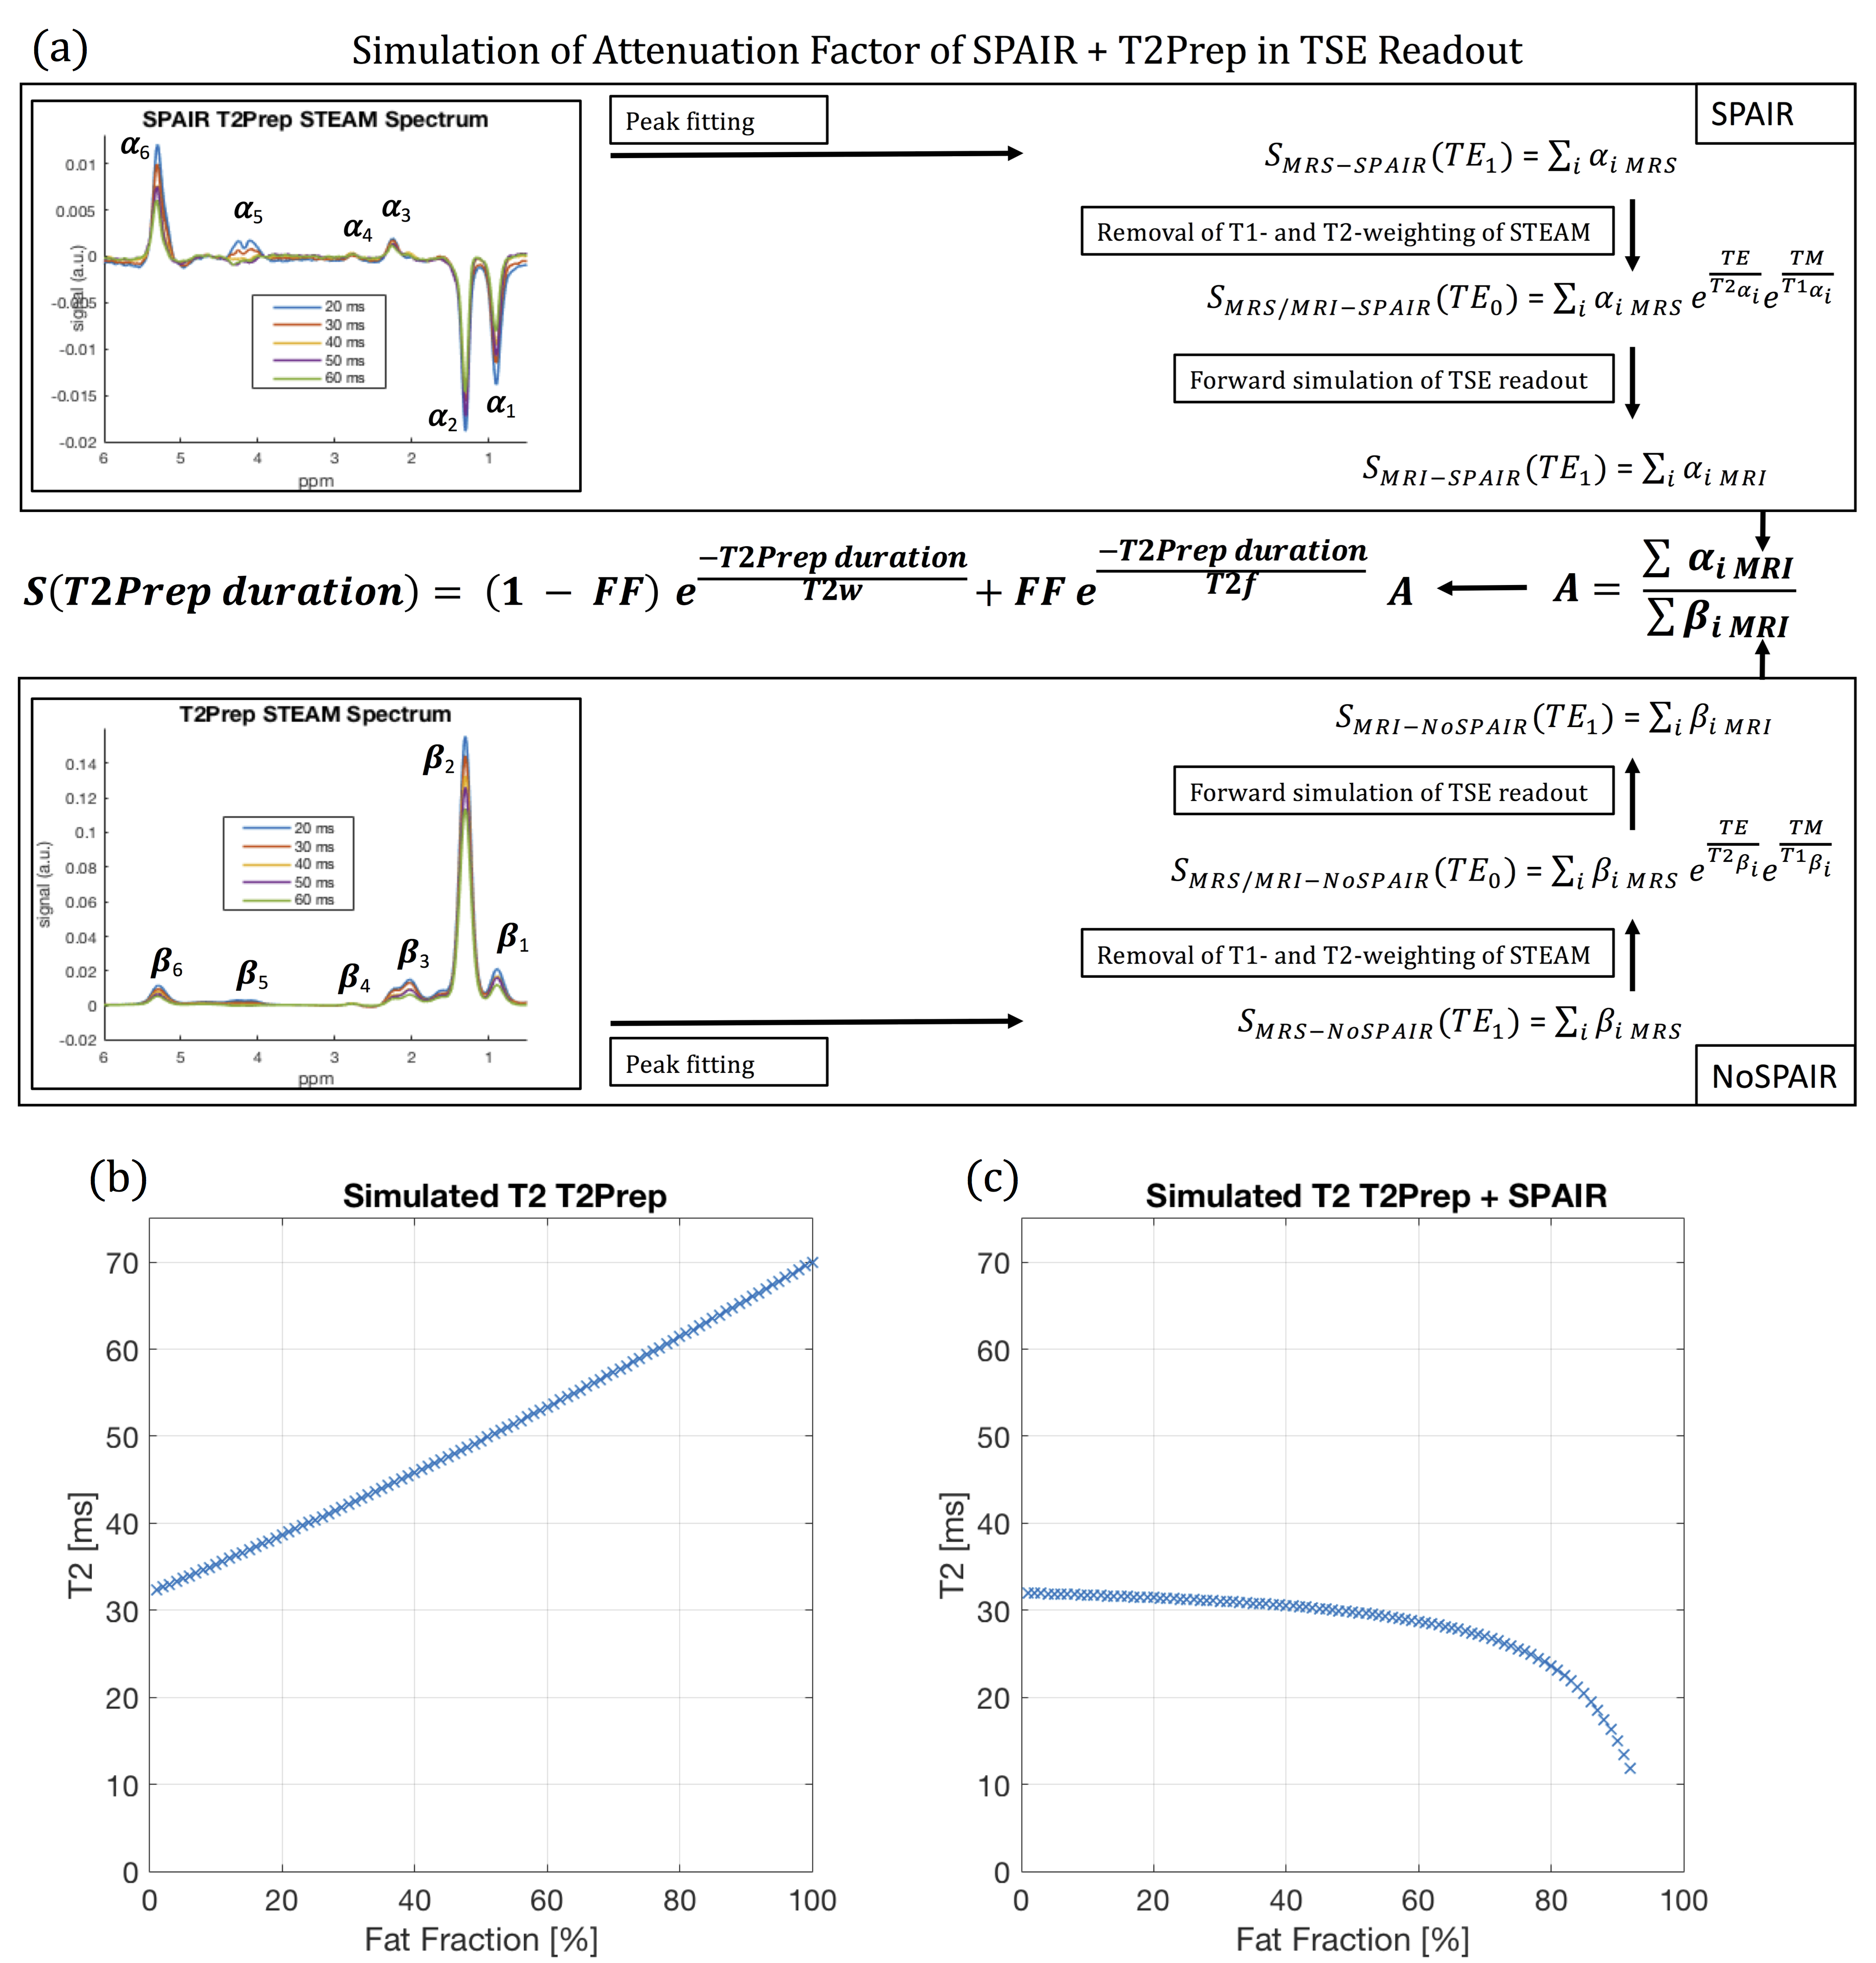
To model the performance of the T2Prep 3D-TSE with SPAIR in the presence of fat a two-step approach was used. First, the effect of SPAIR in combination with the T2preparation on single fat peaks was measured using STEAM-MRS. Secondly, the acquired MRS data was fed in a simulation, modelling the impact of the combination of SPAIR and T2preparation on the 3D-TSE readout.
MRS in volunteer (first step): A T2 prepared STEAM-MRS and a SPAIR+T2 prepared STEAM-MRS (Figure 1) were performed in the subcutaneous fat of a volunteer’s thigh. MRS peak areas were quantified considering six fat peaks11.
Simulation of T2Prep 3D-TSE (second step): For each fat peak the signal at TE0 (time after T2preparation) was calculated based on the MRS data and fed in a forward Bloch simulation of the 3D-TSE readout (Figure 2a). The attenuation factor A was calculated as the ratio of simulated imaging signal with SPAIR and T2preparation divided by simulated imaging signal without SPAIR and with T2preparation. The influence of A on the signal decay of a water-fat-mixture was calculated using the following equation:
$$S({{TE}_{prep}})=(1-FF)e^{-\frac{{TE}_{prep}}{T_{2,w}}}+FFe^{-\frac{{TE}_{prep}}{T_{2,f}}}A$$
with T2w/T2f = 32/70ms12.
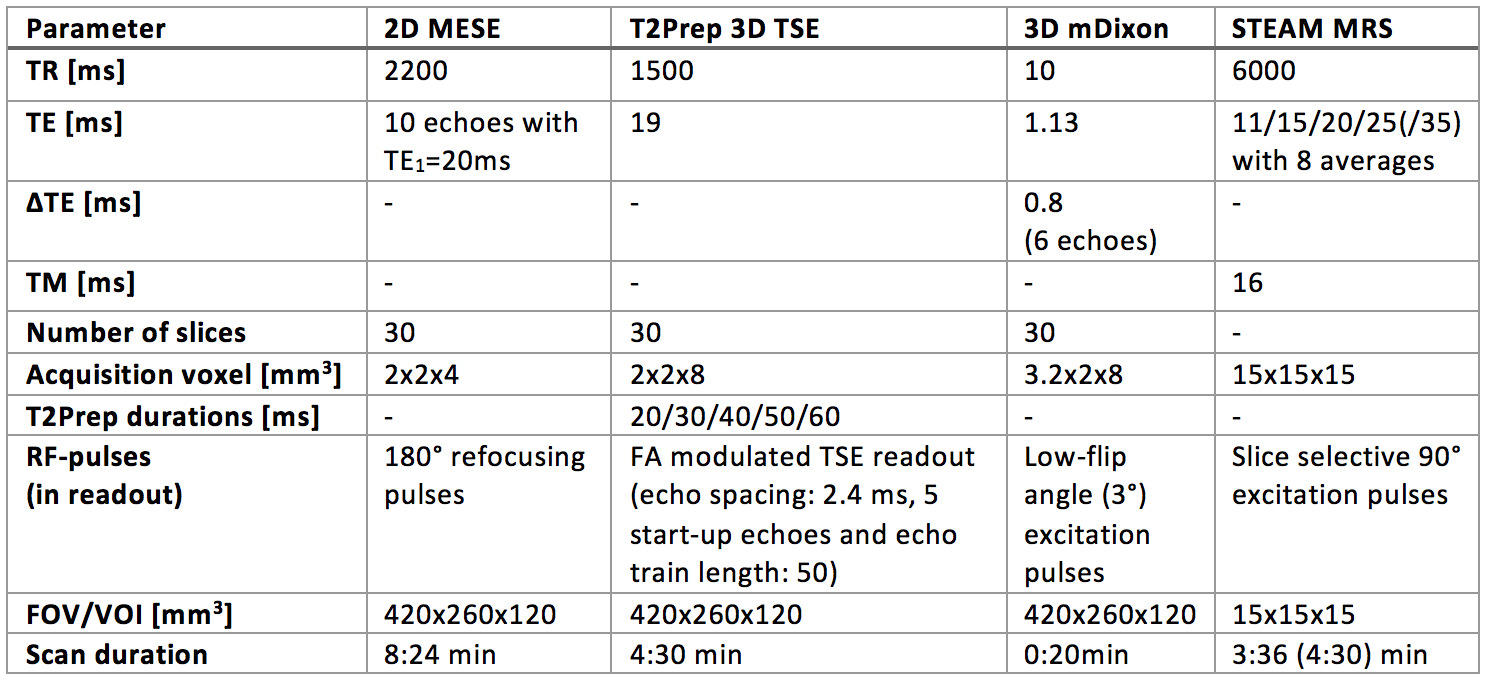
MR measurements in patients: To investigate the performance of the T2Prep 3D-TSE 34 patients (females/males = 23/11, 50±17.0) with NMD were examined on a 3T system (Ingenia, Philips, Best, The Netherlands) using the whole-body coil, the 12-channel posterior coil and the 16-channel anterior coil. T2 maps using a 2D-MESE and T2Prep 3D-TSE and PDFF maps using a mDixon quant sequence were acquired. Multi-TE STEAM-MRS was performed in regions of healthy, edematous and fatty muscle tissue (Table 1).
Results
Simulated performance of T2Prep 3D-TSE: Figure 2b&c show the simulated T2w values versus fat fraction for T2preparation and for T2preparation+SPAIR, respectively. Usage of T2preparation without SPAIR leads to an increasing T2w with increasing fat fractions, whereas the T2w value of T2preparation in combination with SPAIR stays constant up to a fat fraction of 60% and then is slightly decreasing.
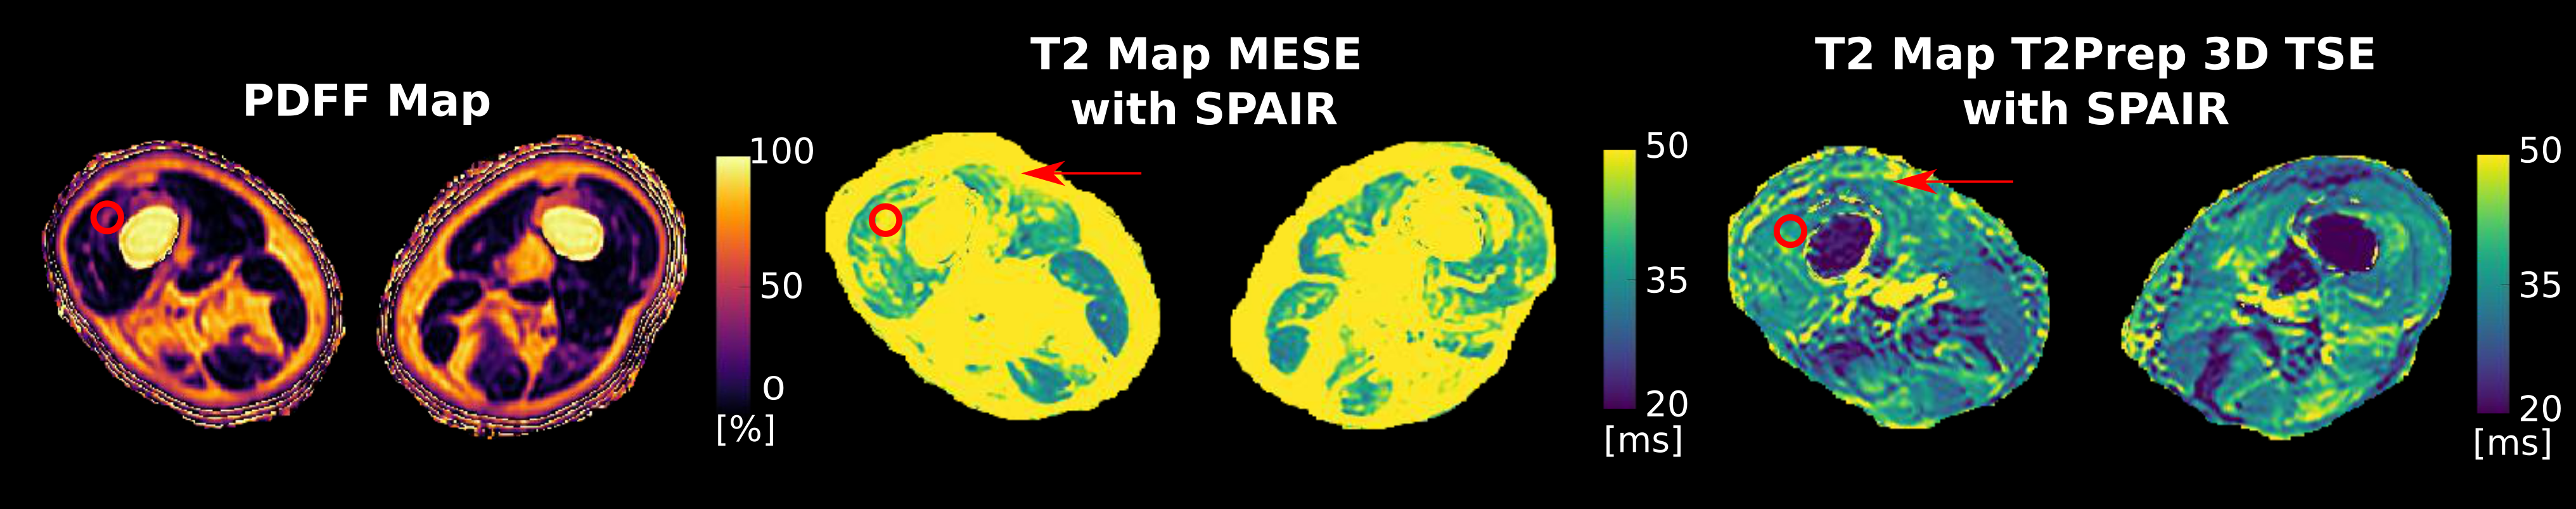
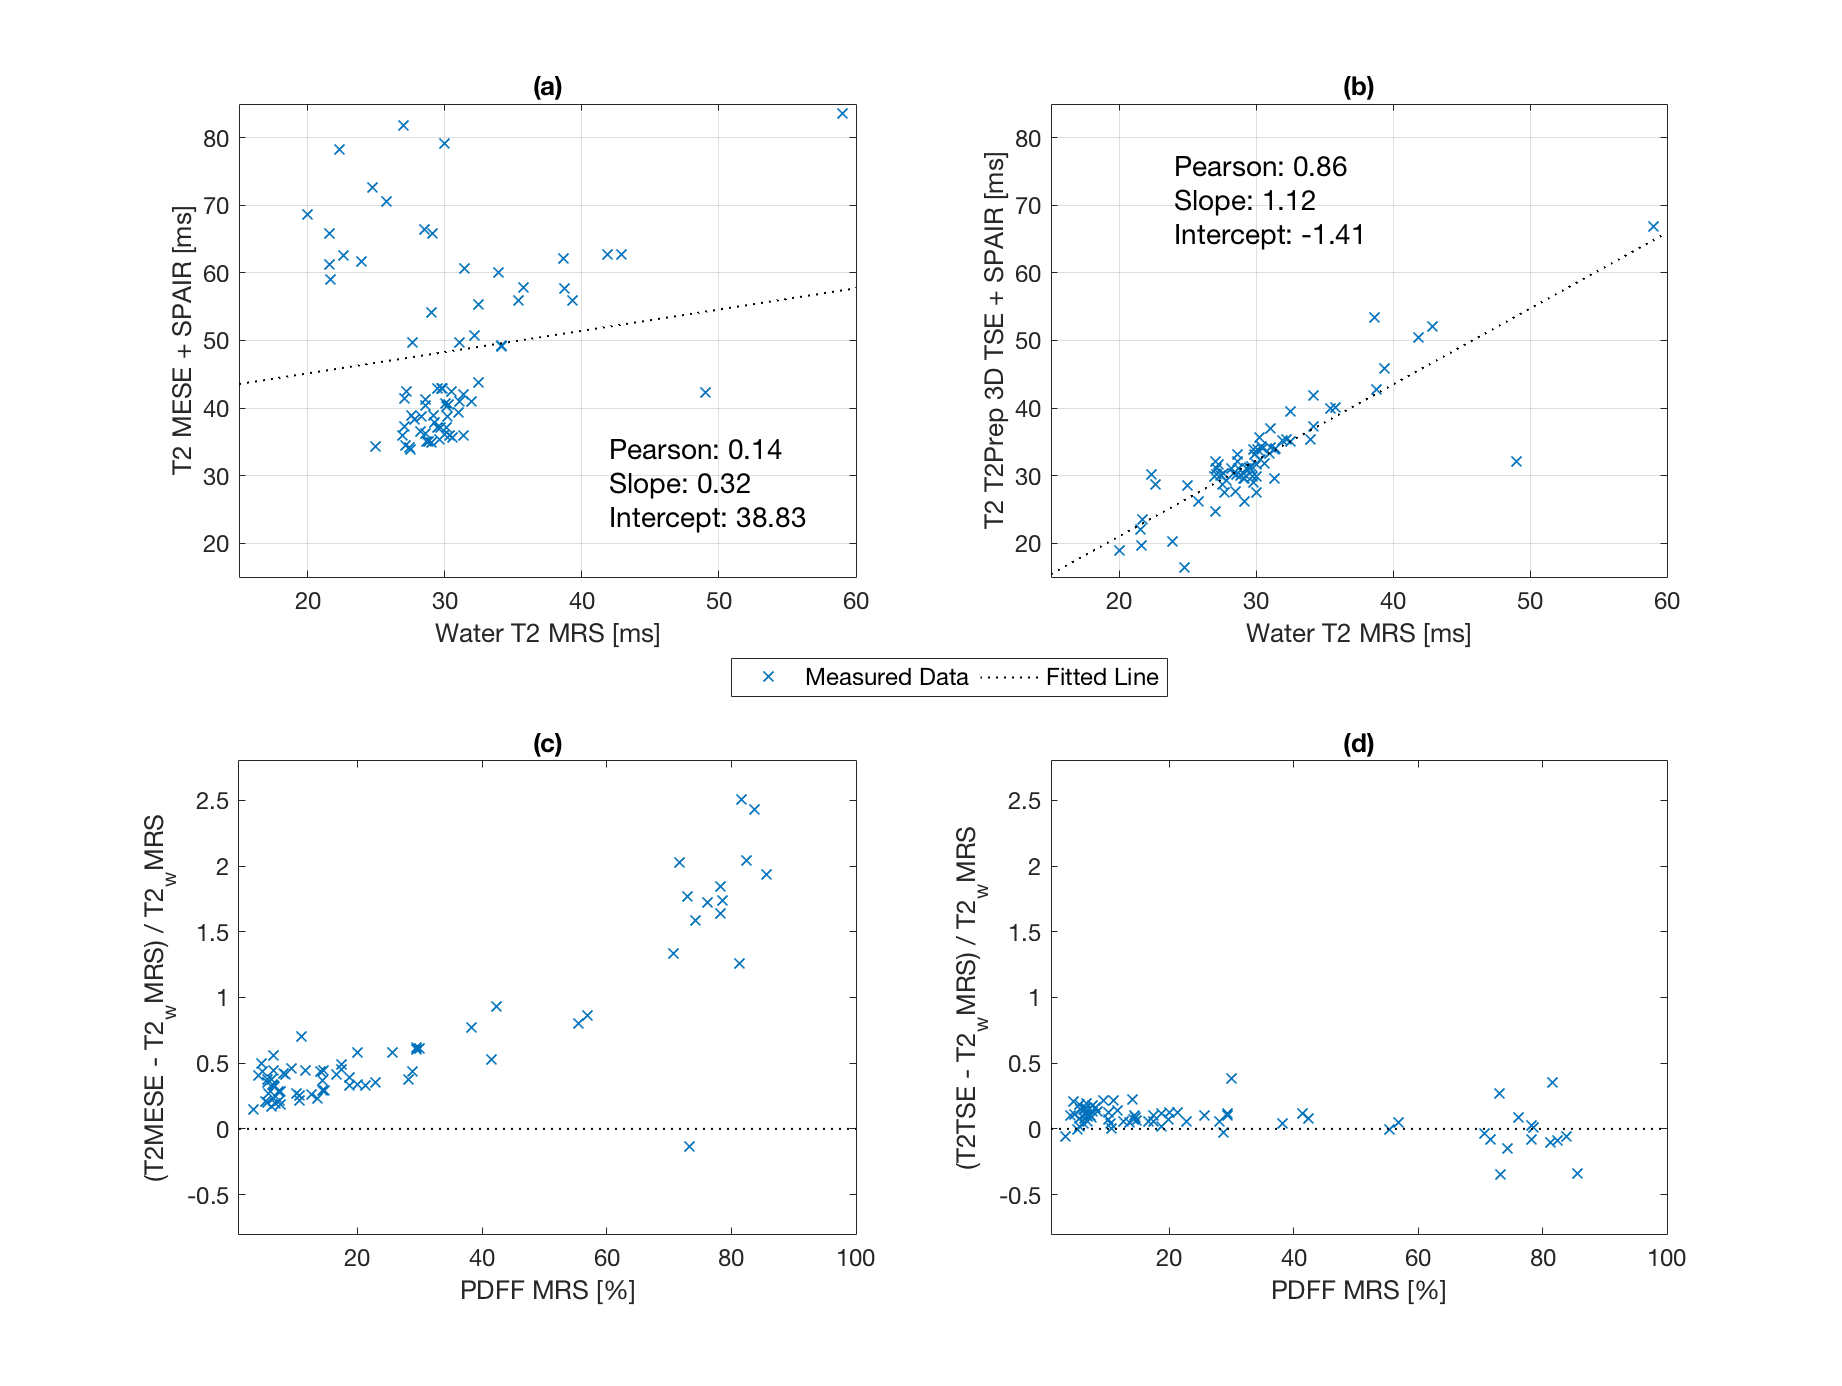
Clinical performance of T2Prep 3D-TSE: In Figure 3 T2 maps based on 2D-MESE and T2Prep 3D-TSE are opposed. The red arrow indicates T2 elevations in the 2D-MESE in contrast to a stable T2 in the T2Prep 3D-TSE in a region typically affected by B1 errors. In a moderately fatty infiltrated region (PDFF≈45% - circle) the T2 value of the 2D-MESE is ~50 ms, whereas the T2 value of the T2Prep 3D-TSE is ~30 ms. Figure 4 shows the results of the comparison of MRS and T2 mapping data. An excellent agreement between STEAM-MRS and T2Prep 3D-TSE is observable (R=0.86/p<10-3) whereas the 2D-MESE shows large deviations from STEAM-MRS (R=0.14/p<10-3). The relative error of the T2Prep 3D-TSE is below 25% whereas it exceeds 100% at PDFF>60% for the MESE.
Discussion & Conclusion
The present simulation and clinical results show that T2 mapping based on the T2Prep 3D-TSE sequence with SPAIR is insensitive to fatty-infiltration even at higher PDFF values. The confounding effects of B1 sensitivity and fat on T2w quantification are removed with the proposed sequence on the acquisition side and therefore do not relay on modeling of the signal evolution. A limiting factor of the proposed technique is the off-resonance sensitivity of SPAIR. However, off-resonance effects are small in the diagnostically important thigh4. In conclusion, the T2Prep 3D-TSE has been shown to be a good alternative for T2w mapping in patients with NMD due to its insensitivity to B1-inhomogeneities and fatty-infiltration.Acknowledgements
The present work was supported by the German Society for Muscle Diseases, the European Research Council (grant agreement No 637164 – iBack and grant agreement No 677661 – ProFatMRI) and Philips Healthcare.References
1Carlier PG, et al., J Neuromuscul Dis. 3(1):1-28, 20162Carlier PG, et al., J Inherit Metab Dis. 38(3):565-72, 2015
3Mankodi A et al., Neuromuscul Disord 27(8):705-714, 2017
4Wattjes MP, et al., Eur Radiol. 20(10):2447-60,2010
5Lebel RM, Wilman AH, Magn Reson Med. 64(4):1005-14, 2010
6Marty B, et al., NMR Biomed. 29: 431–443, 2016
7Janiczek RL, et al., Magn Reson Med. 66(5):1293-302, 2011
8Azzabou N, et al., J Magn Reson Imaging 41(3):645-53, 2015
9Klupp E, et al., PLOS ONE 12(2): e0171337, 2017
10Weidlich D, et al., NMR Biomed. 30:e3773, 2017
11Hamilton G, et al., J Magn Reson Imaging 34: 468–473, 2011
12Gold GE, et al., AJR AM J Roentgenol. 183(2):343-51, 2004
Figures