0814
3D-T1rho mapping of upper arm muscles in post-stroke patients1Center for Biomedical Imaging, New York University School of Medicine, New York, NY, United States, 2Rusk Rehabilitation, New York University School of Medicine, New York, NY, United States
Synopsis
In this study, we evaluate the use of 3D-T1rho (T1ρ) relaxation mapping of the upper arm muscle glycosaminoglycan (GAG) content in healthy controls, and post stroke patients with pre and post hyaluronidase injections. Healthy controls (n=5) and post-stroke patients (n=5, pre and post treatment) were recruited. Dixon based water-fat imaging and T1ρ mapping were performed. Mono- and bi-exponential modeling was used to process the data. While water-fat distributions were not significantly different between the two groups, significant differences were noted in T1ρ values using mono- and bi-exponential analysis. T1ρ imaging shows significant changes that reflect the reduction of GAG’s following the treatment with hyaluronidase injection.
Introduction
Following a stroke, many individuals develop spasticity in muscles which is associated with reduced functional independence and significant increases in health care costs1. Spasticity develops as a result of central nervous system injury2. In addition, secondary non-neural mechanisms may contribute to upper limb muscle stiffness1 , but the mechanisms are not fully understood. Hyaluronan, a high molecular weight glucosaminoglycan (GAG) acts as a lubricant and facilitates normal movement in muscles. The hyaluronan hypothesis proposed previously3 postulates that an increase in hyaluronan in the extra-cellular matrix (ECM) of muscles may contribute to muscle stiffness in patients with post stroke spasticity. It was recently shown that off-label intramuscular injections of an FDA approved enzyme, hyaluronidase, hydrolyzes hyaluronan and reduces muscle stiffness3. In this study, Dixon based water-fat imaging and 3D-T1rho relaxation mapping of upper arm muscles were used to determine intramuscular GAG content in healthy controls and post-stroke patients, pre-and post hyaluronidase injections.Methods
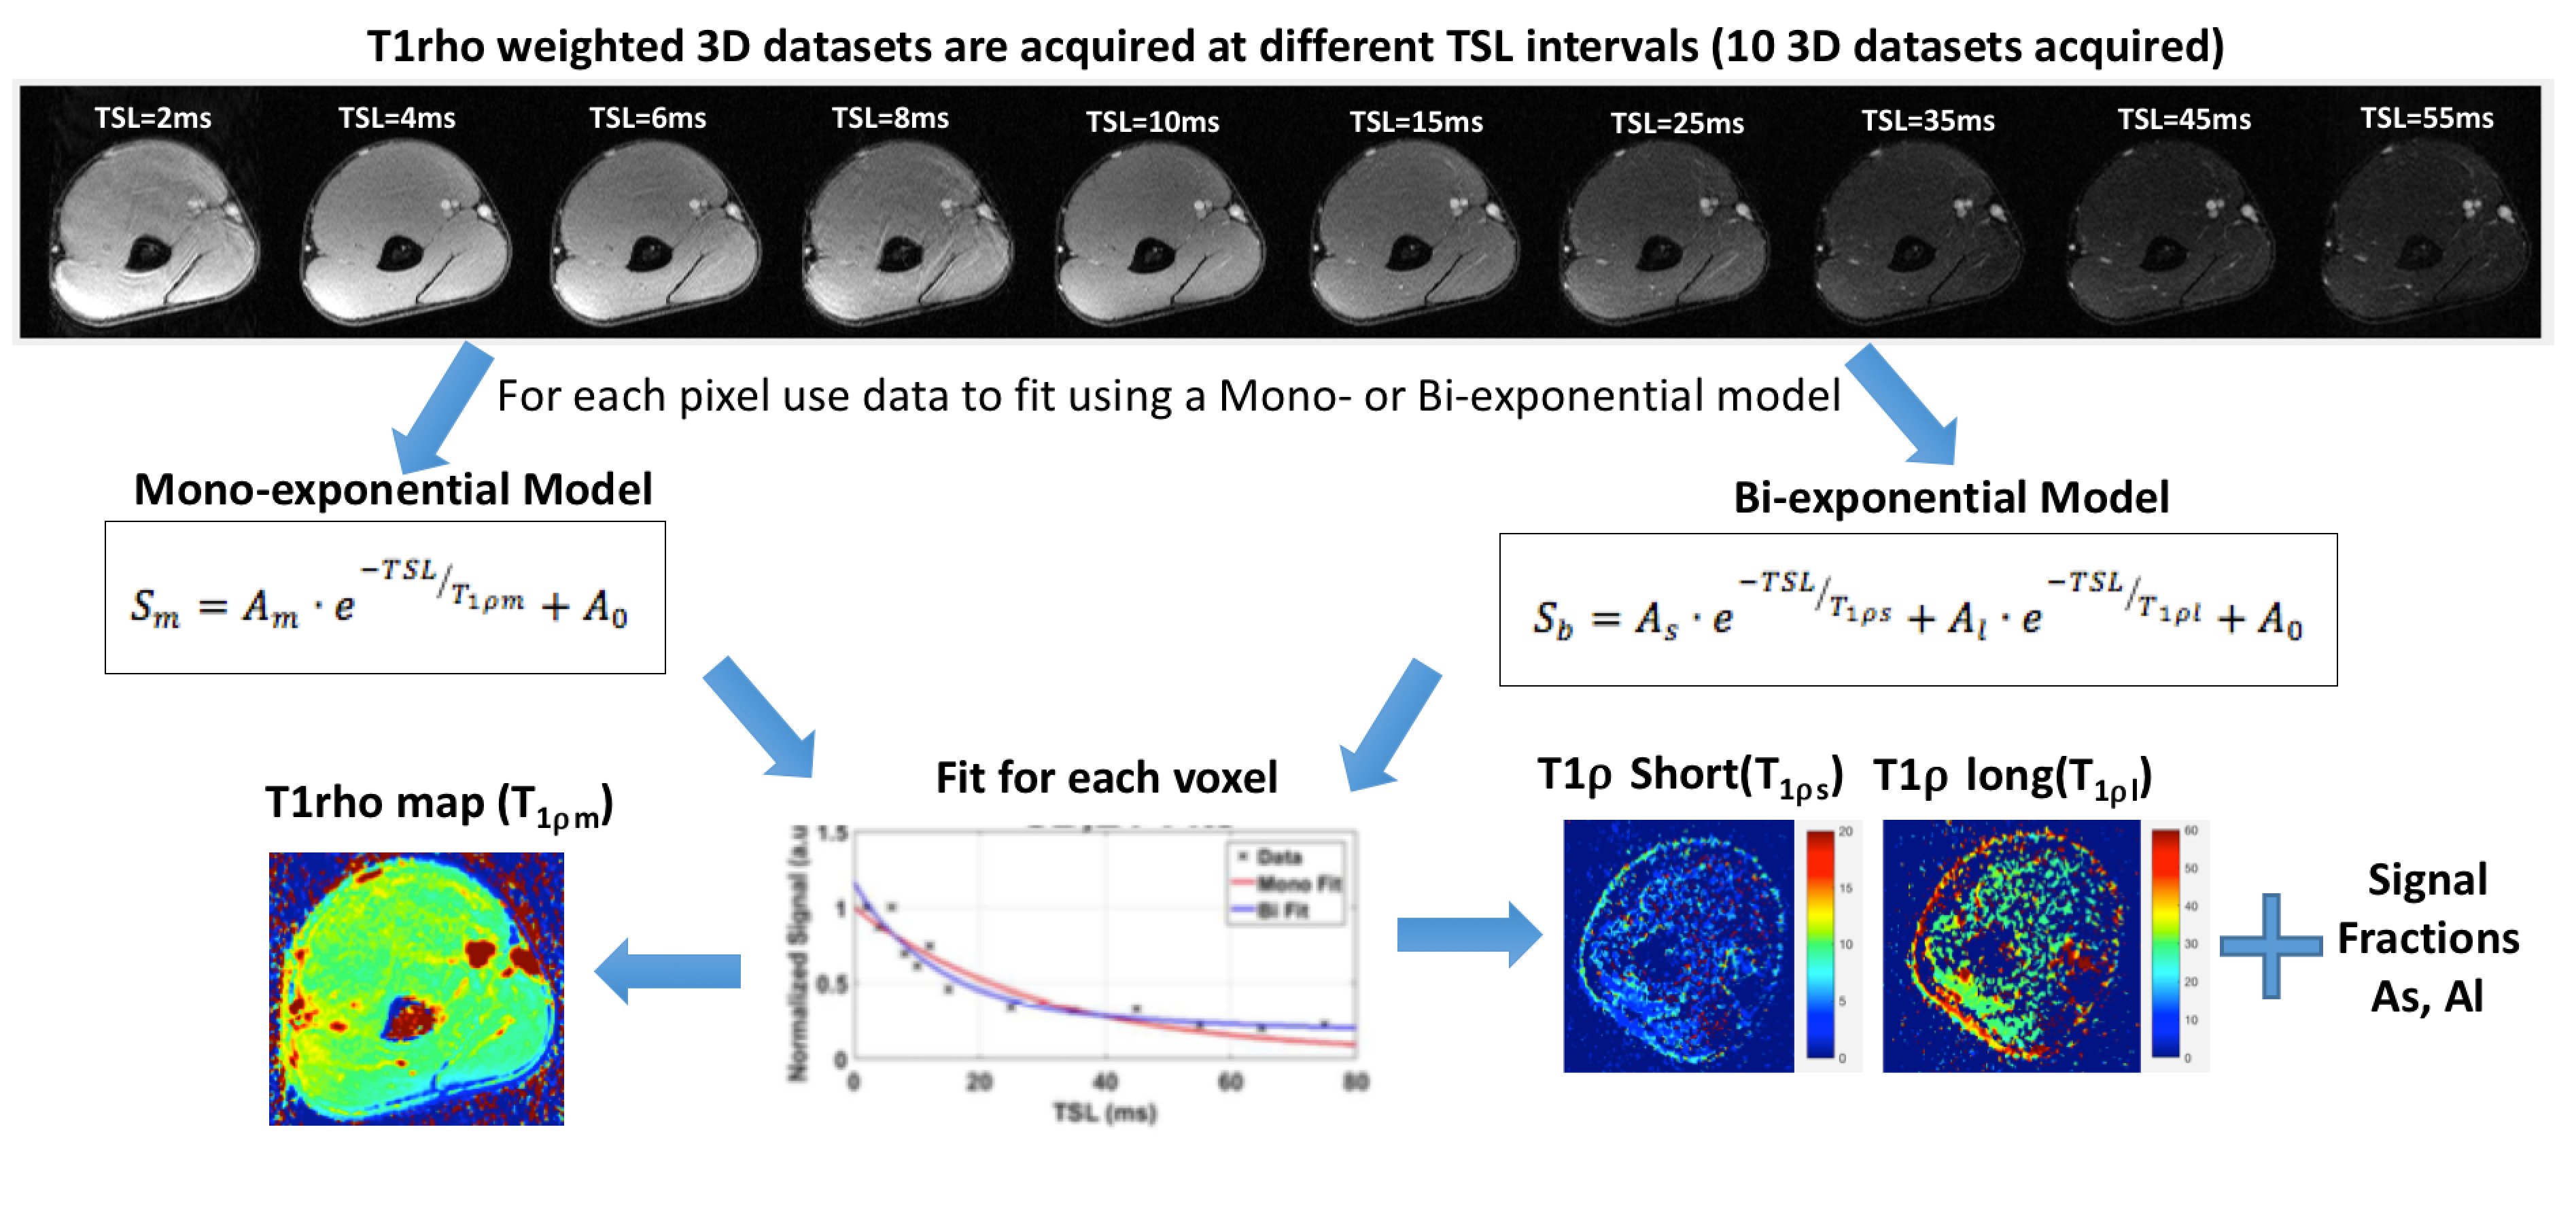
Five post-stroke patients (3 males, 2 females, age= 46 ± 15) and five healthy control subjects (3 males, 2 females, age = 27 ± 2) were recruited and informed consent was obtained. In patients, pre-injection MRI was conducted, followed by the administration of intramuscular hyaluronidase injections (Hylenex, Halozyme Therapeutics, Inc.). Finally, post-injection MRIs were conducted approximately two weeks after the injections. For control subjects, there was a single MRI scan. The MRI study was conducted on a 3T clinical scanner (Prisma, Siemens Healthcare, Germany). A 3D turbo-FLASH sequence with a customized T1rho preparation module was used to enable varying spin locks durations (TSL). A paired self-compensated spin-lock pulse was used to minimize B0 and B1 variations4. The sequence parameters included FOV=130 mm, matrix size=256x64x64, TR=1500ms, resolution = 0.5x2x2 mm2, spin-lock frequency = 500Hz, 10 TSL durations = 2,4,6,8,10,15,25,35,45,55 ms. acquisition duration = 10 minutes (Figure 2). The MRI body coil was used for transmission, and two vendor supplied flexible receive array coils (8 coil elements each) were wrapped around each arm for imaging. Additionally, Dixon based method were used to separate fat and water distribution to investigate fatty infiltration into the muscles.. The Dixon water/fat imaging parameters included: TR=9.3ms, TE= (2.26, 3.08, 3.90) ms, FOV=180mm, Matrix size=128x128, resolution=1.4x1.4 mm2, total acquisition time ~2 min. The mono-exponential T1r decay was obtained by fitting the signal at different spin-lock durations for each pixel:
$$S=Aexp\left(\frac{-TSL}{T_{1{\rho}m}} \right)+A_0,$$
The bi-exponential signal decay for each pixel was calculated by fitting the same data by modeling as components of two separate relaxation components as follows:
$$S=A_{s}exp\left(\frac{-TSL}{T_{1{\rho}s}} \right)+A_{l}exp\left(\frac{-TSL}{T_{1{\rho}l}} \right)+A_0,$$
Figure 1 summarizes the data acquisition and processing pipeline. Two tailed student t-tests were used for comparing the groups. A paired t-test was used for the pre- and post-injection comparison. A P-value of less that 0.05 was considered significant.
Results
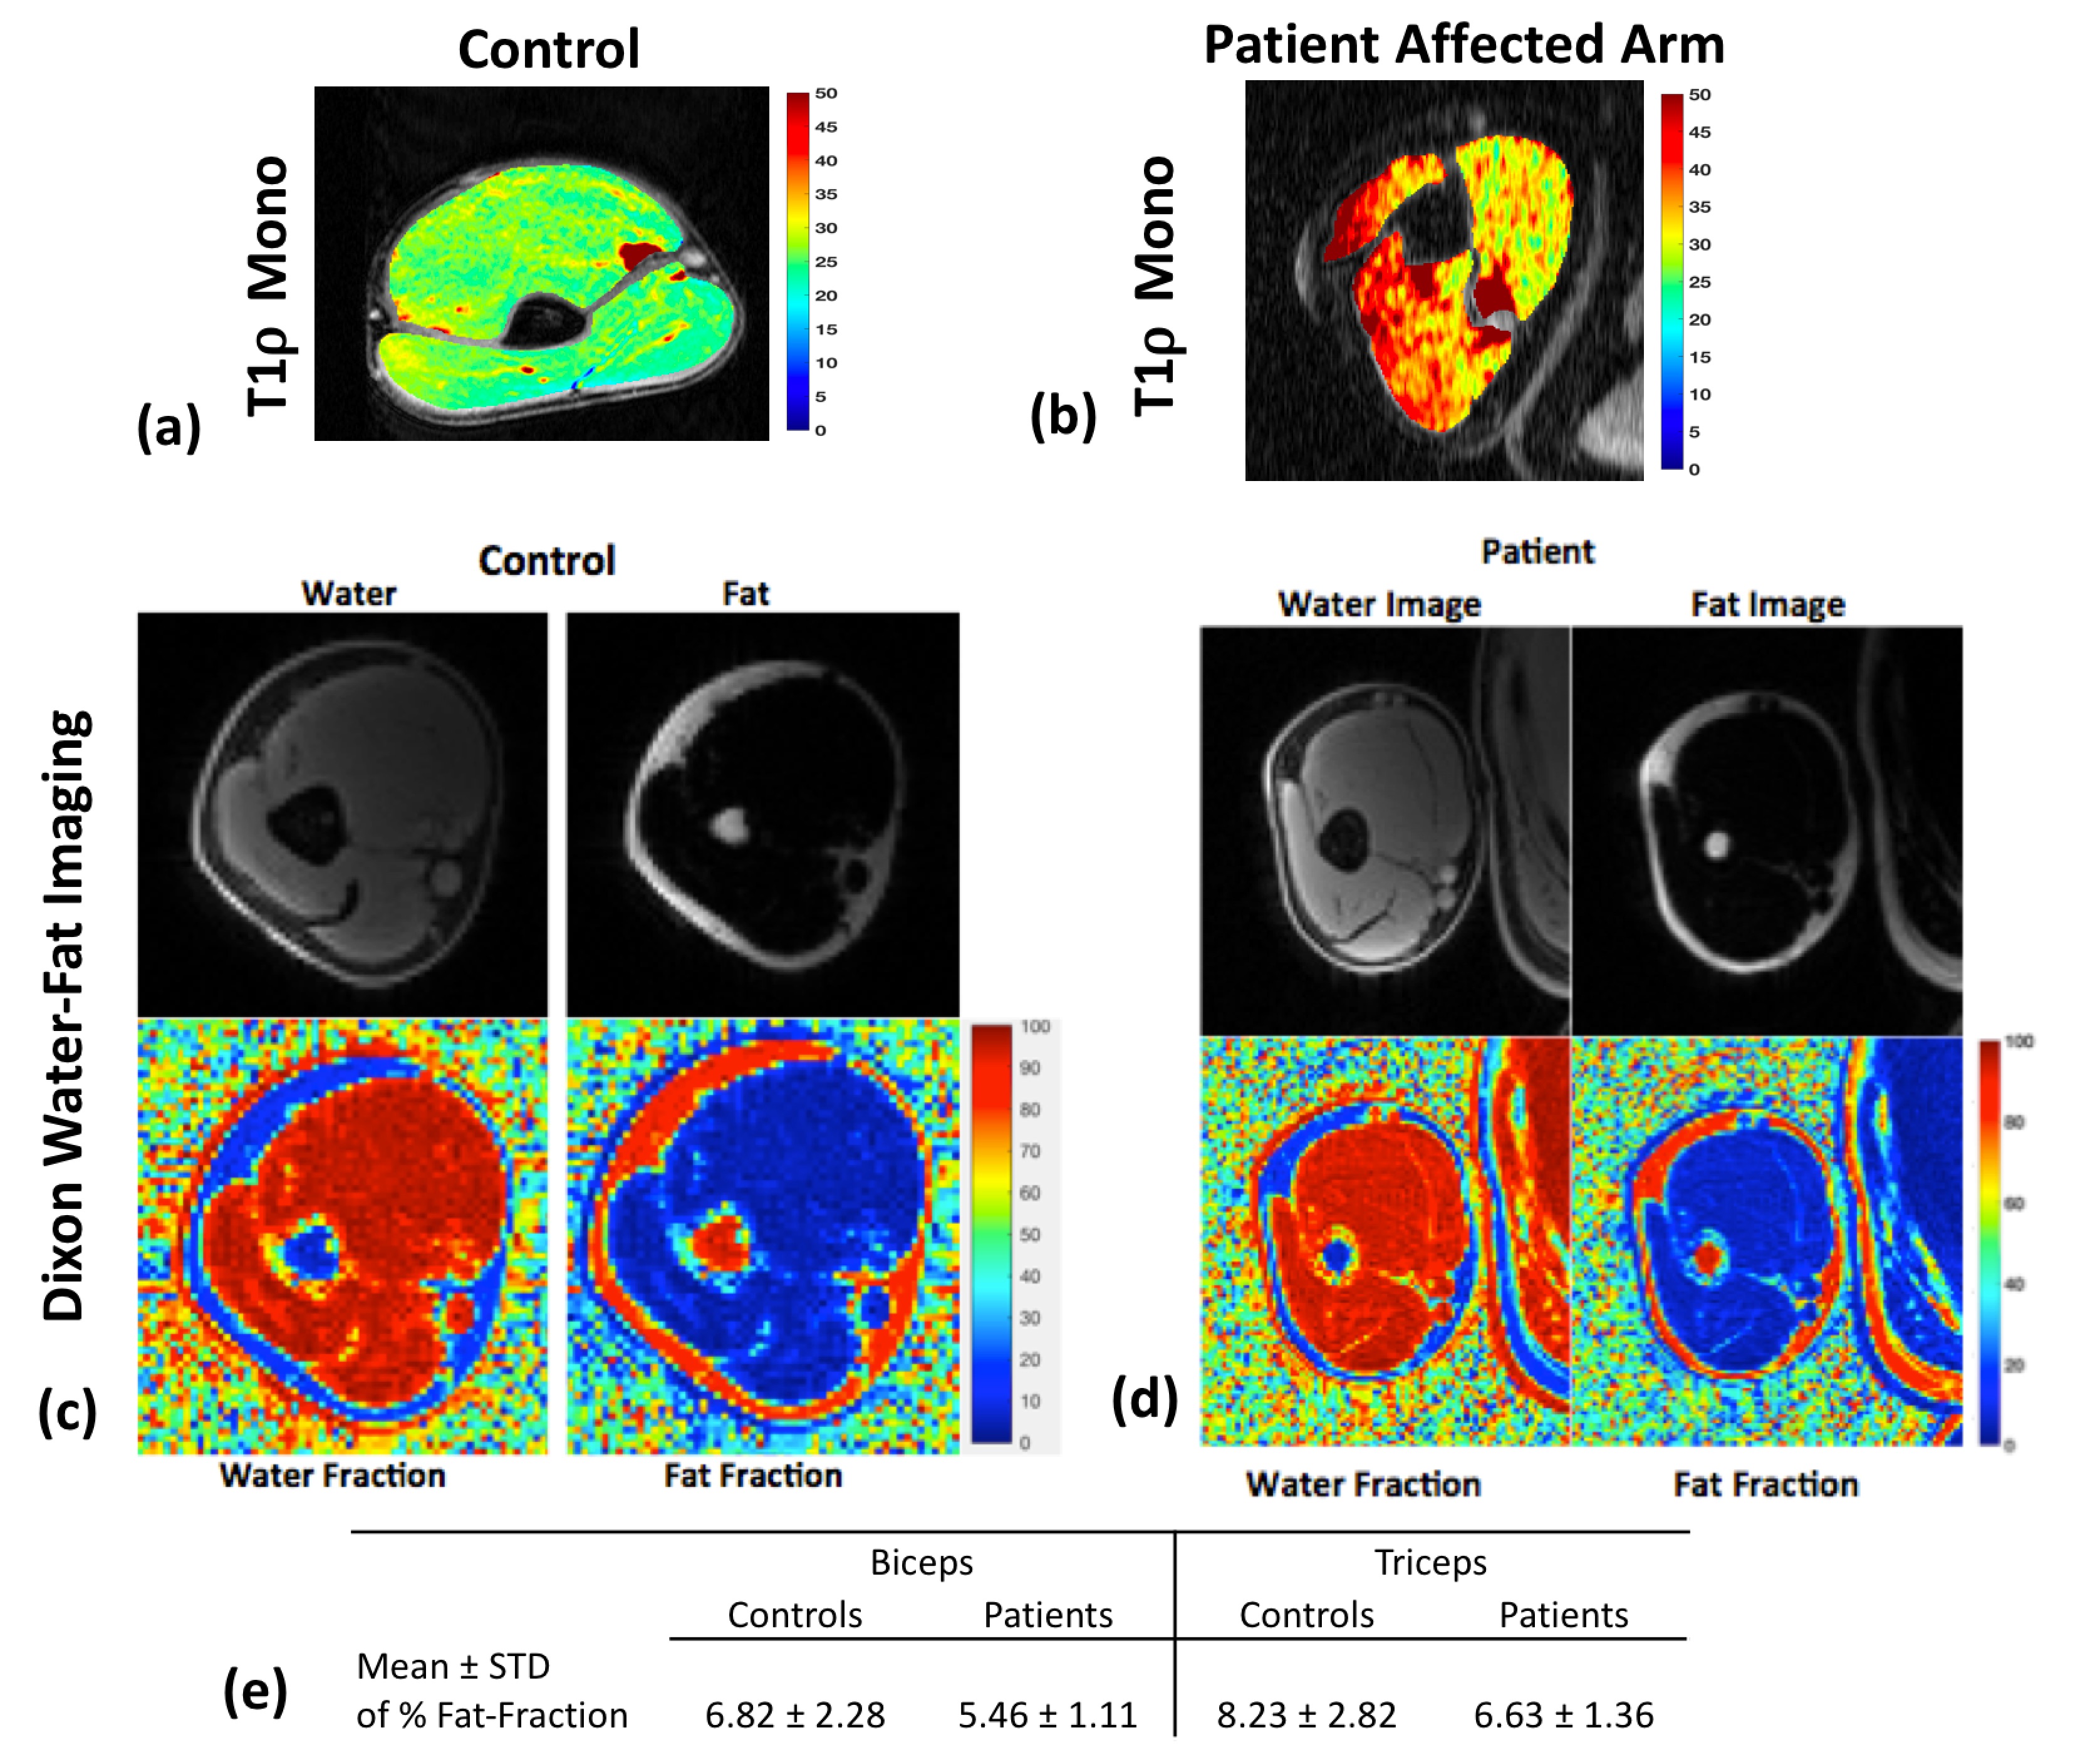
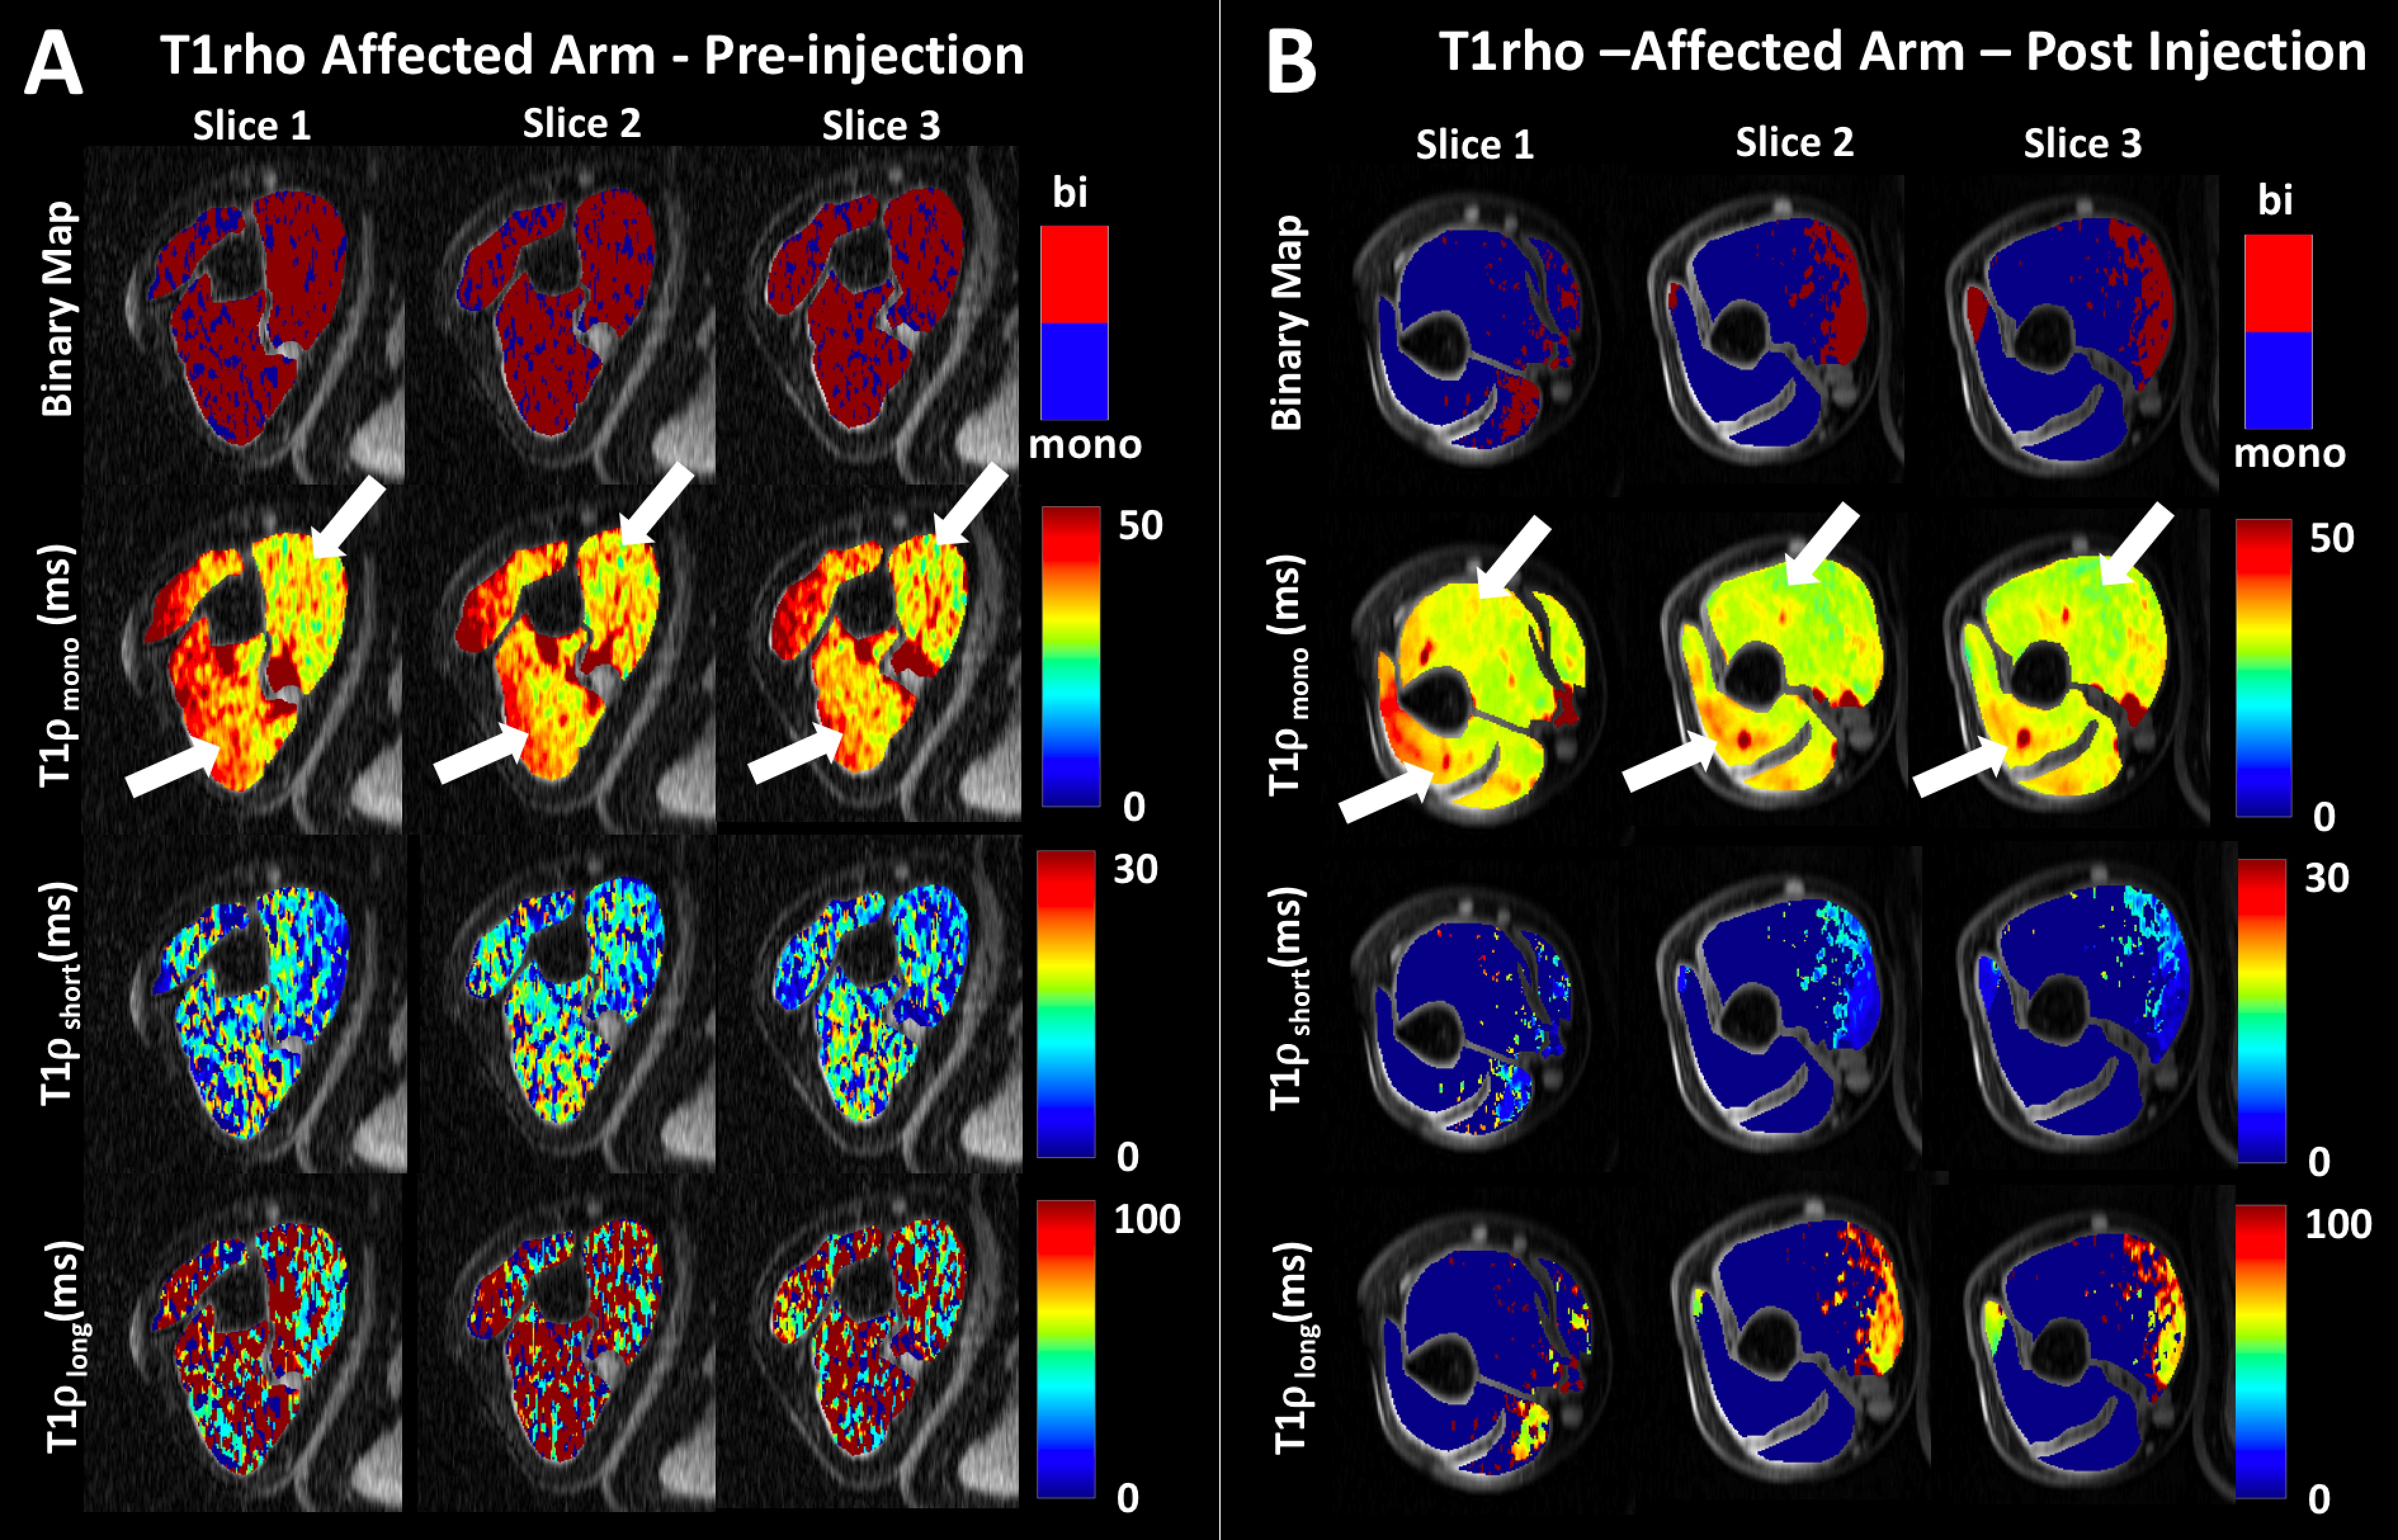
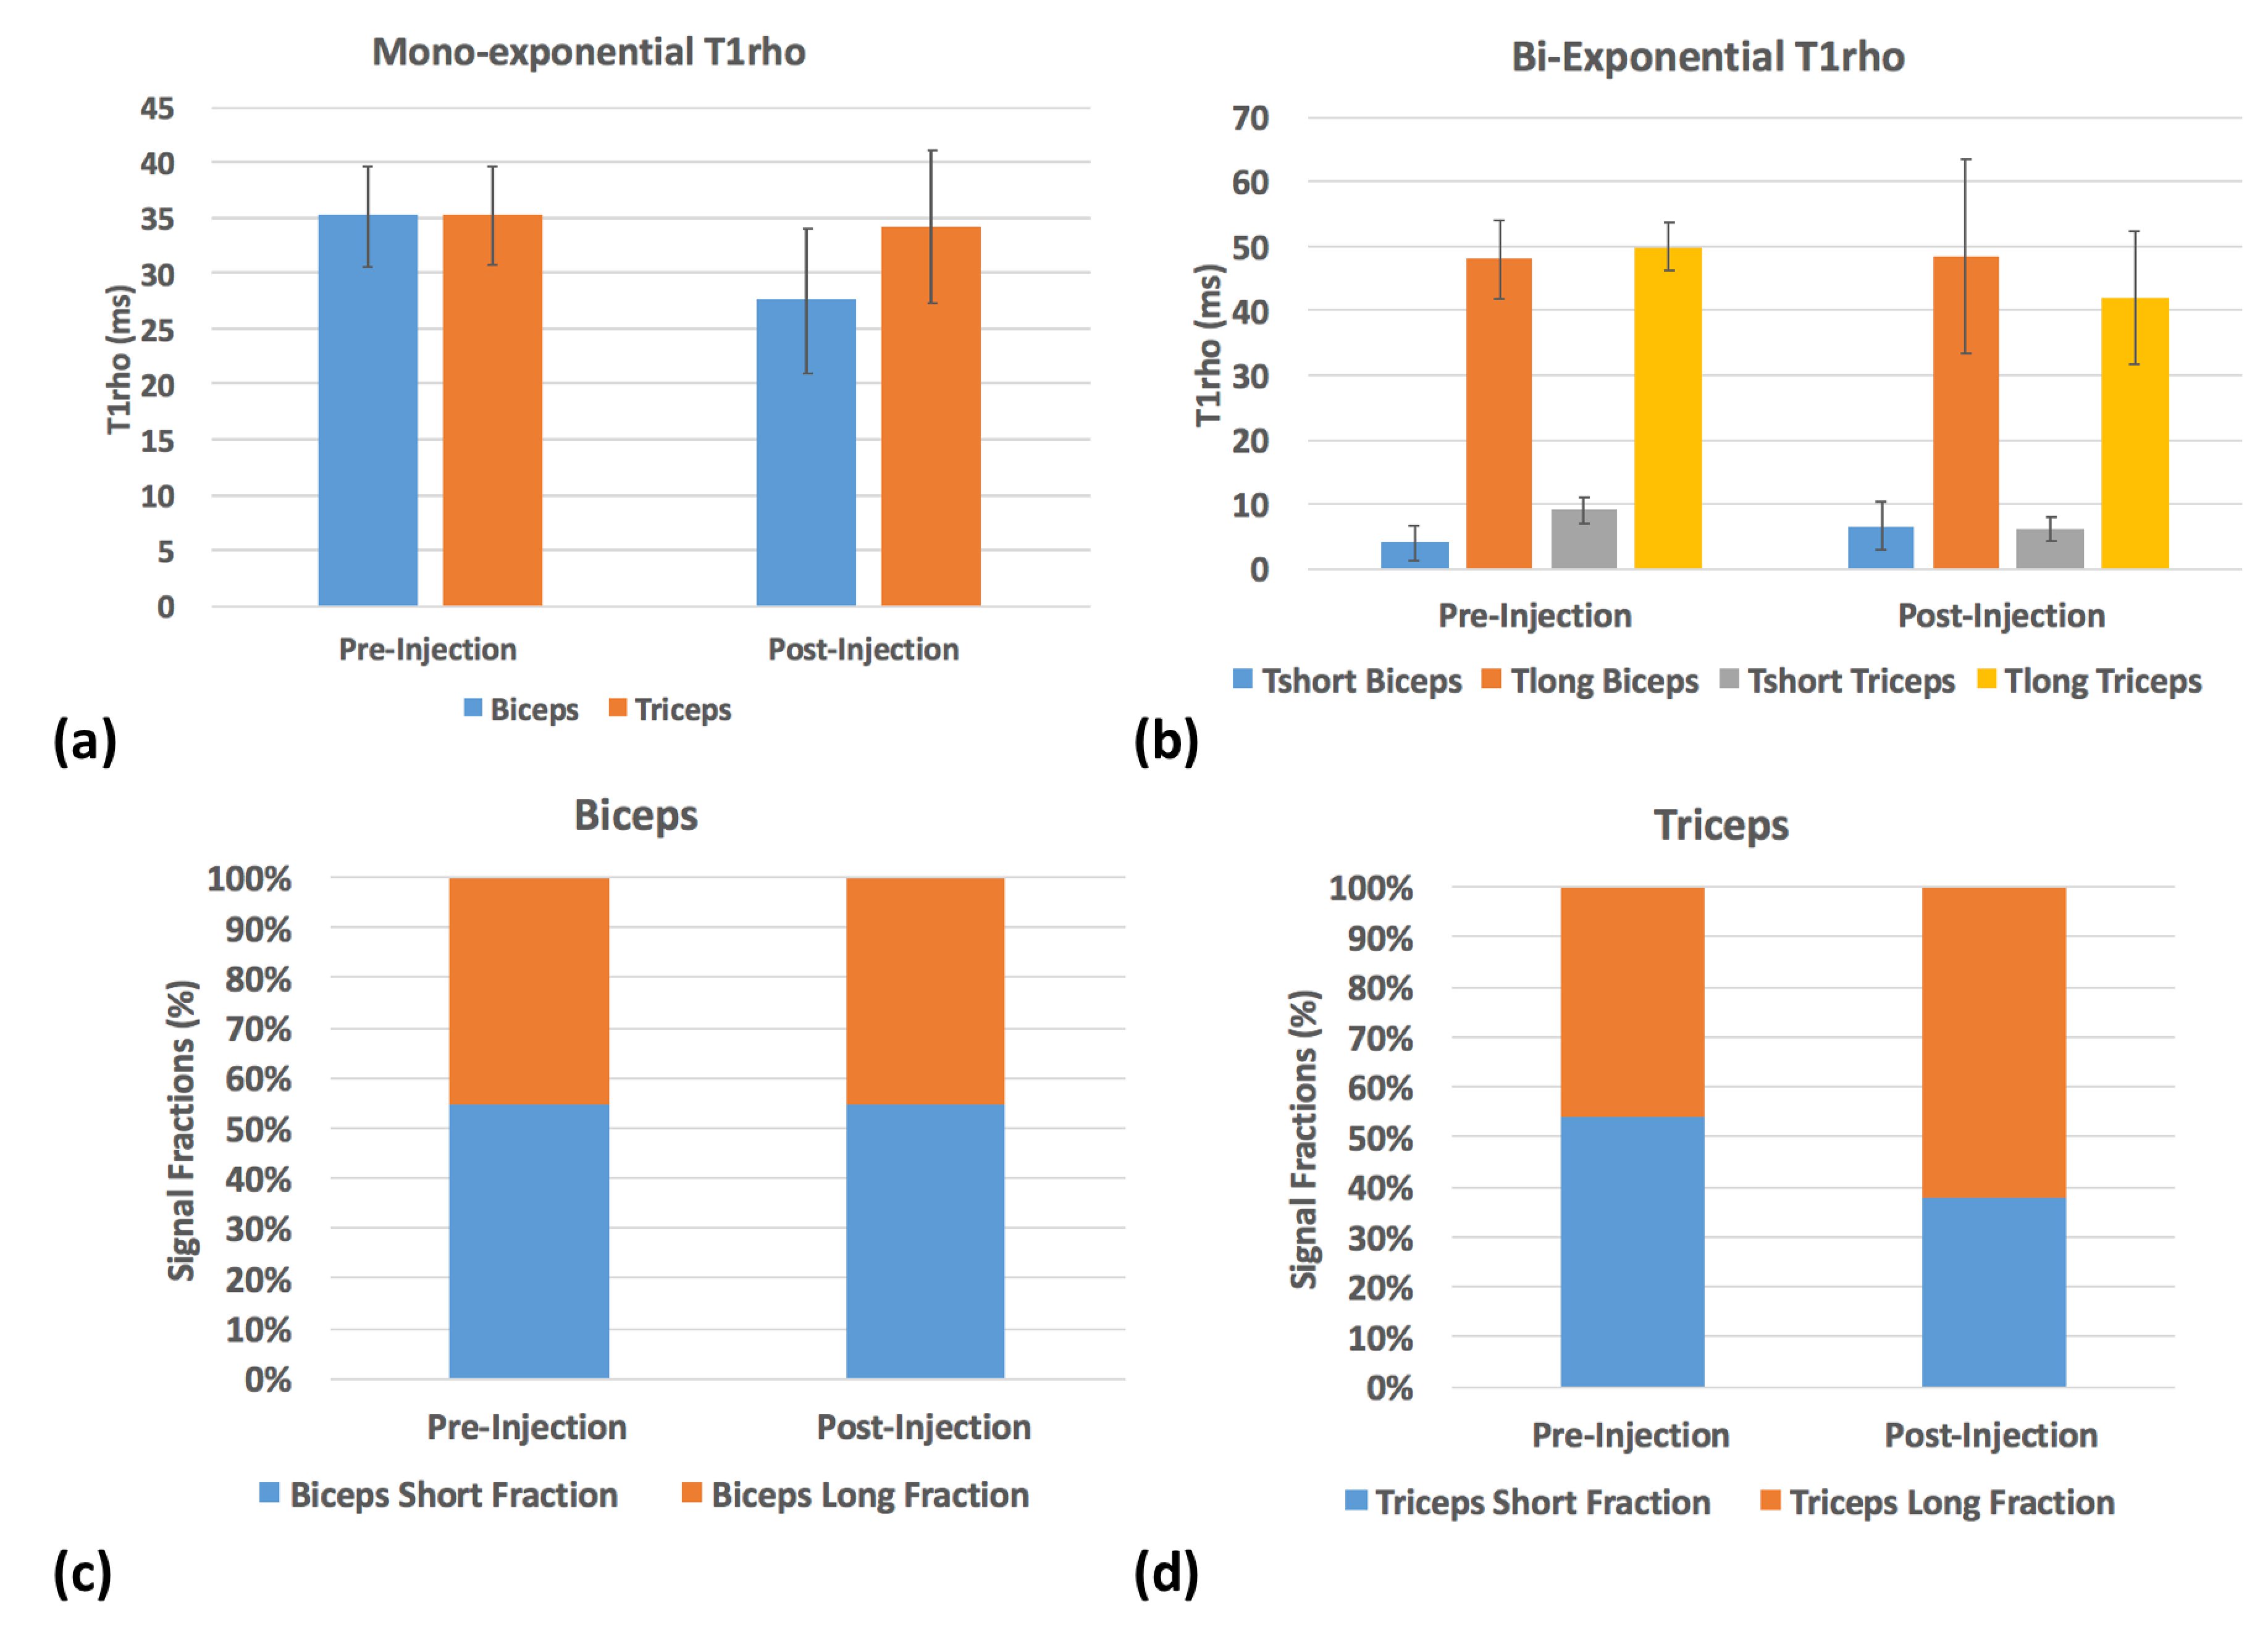
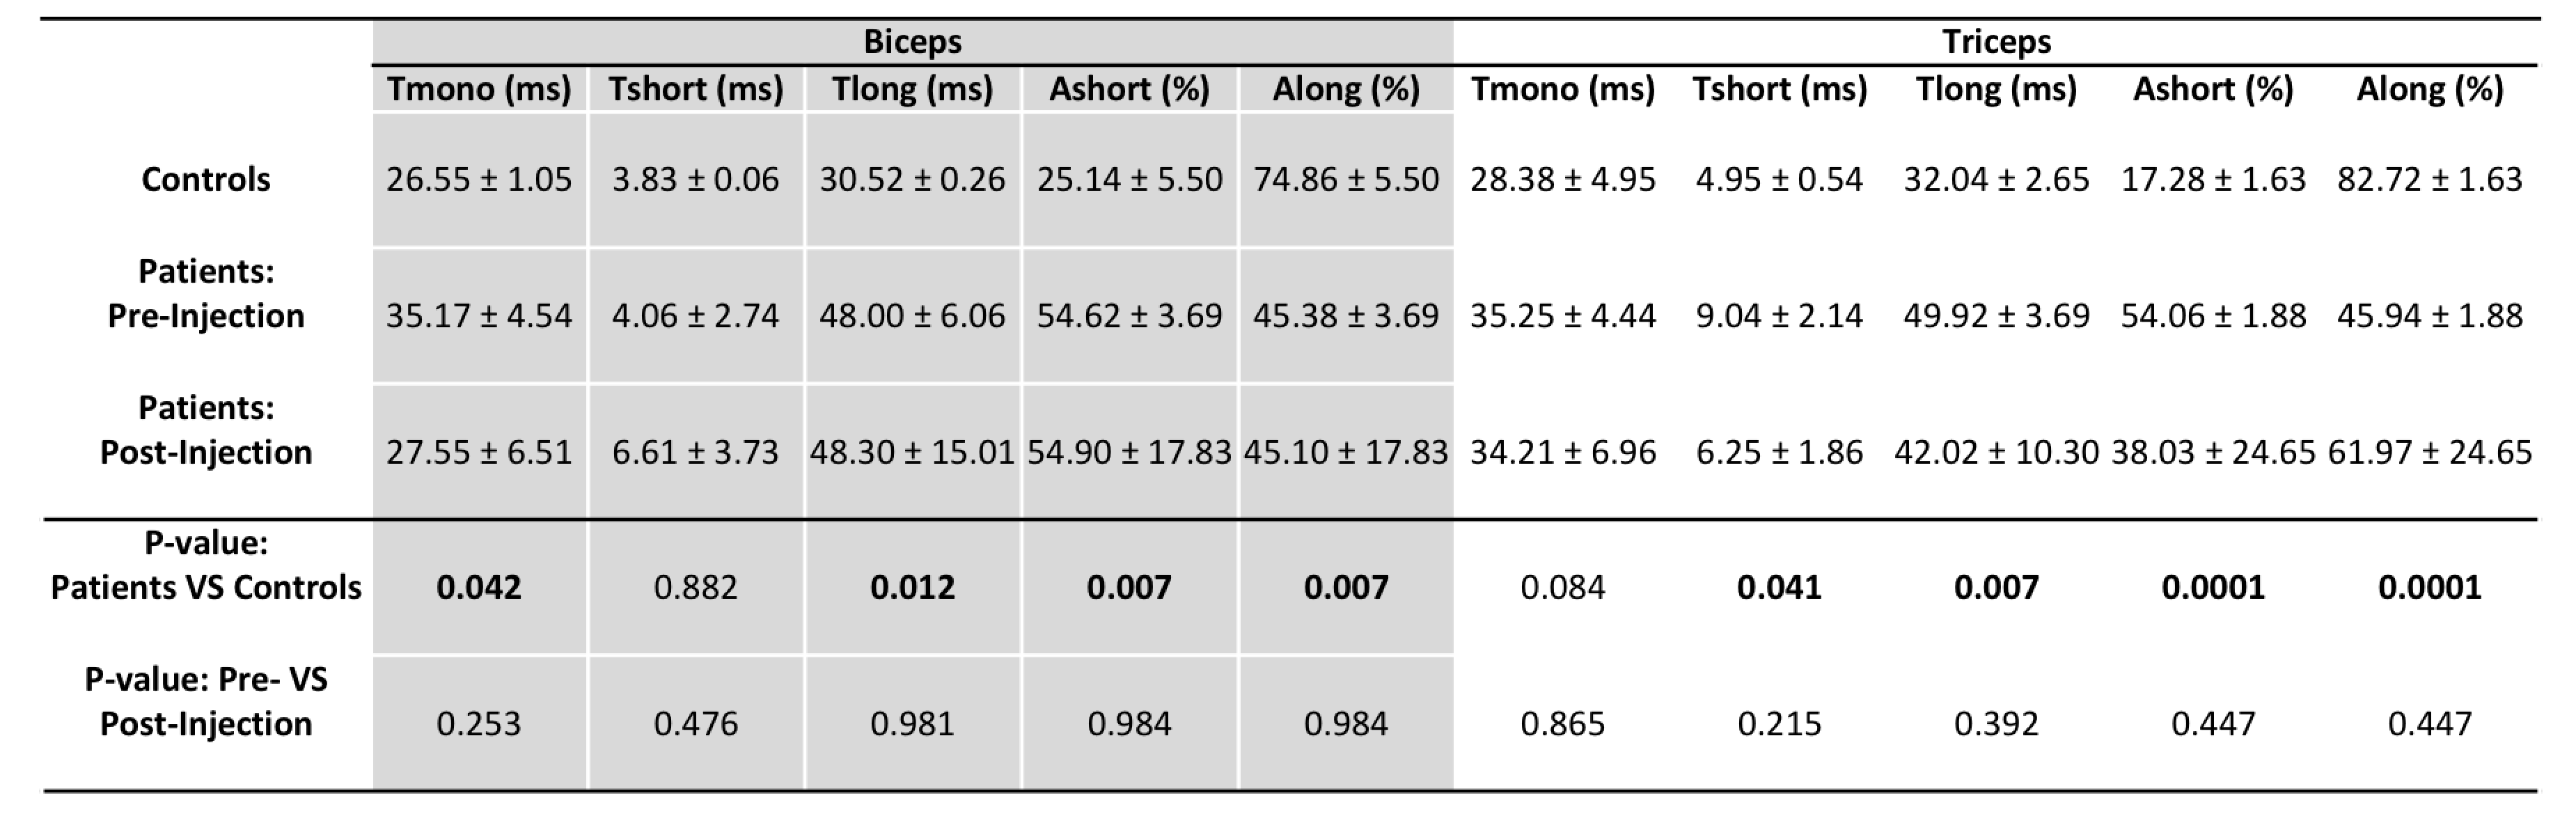
Following the hyaluronidase injections patients reported significant relief from muscle stiffness. Figure 2(a, b) shows a representative T1ρ map in control subject and stroke patient respectively. Figure 2(c,d) show the results from the Dixon water-fat imaging in controls and patients. Figure 2(e) shows the mean and standard deviations of percent fat fractions in patients and controls. Panels A and B in figure 3 show the resulting T1ρ maps obtained using mono-exponential and bi-exponential fitting models of a representative stroke patient with pre and post treatment with hyaluronidase injections respectively. The graphs in figure 4 and 5 show the mean ± standard deviations of the T1ρ numbers for control subjects and pre- and post-injection conditions in patients. There were significant changes in a number of values between stroke patients and control subjects. In the biceps, the T1ρm (P=0.042), and T1ρl (P=0.012) was significantly lower in controls. The short and long fractions were significantly different from the patients too (P=0.007). In the triceps, the T1ρs (P=0.041), and T1ρl (P=0.007) were significantly lower in controls. The short and long fractions were also different in the controls (P=0.0001).Discussion and Conclusion
In this study, we show that 3D T1ρ mapping of the muscle can be used to detect intramuscular GAG content (hyaluronan) non-invasively. The short relaxation component is related to the macromolecular (high molecular weight hyaluronan and collagen ) water compartments while the long component is related to the loosely bound macromolecular water (inflammation). Mono-exponential and bi-exponential modeling of the data is useful to gain complementary insights regarding the micro-environments resulting in muscle stiffness.Acknowledgements
This study was supported by NIH grants R01-AR060238, R01 AR067156, and R01 AR068966, and was performed under the rubric of the Center of Advanced Imaging Innovation and Research (CAI2R), a NIBIB Biomedical Technology Resource Center (NIH P41 EB017183).References
- Lundstrom E, Terent A, Borg J. Prevalence of disabling spasticity 1 year after first-ever stroke. Eur J Neurol. 2008; 15(6): 533-9
- Zorowitz RD, Gillard PJ, Brainin M. Poststroke spasticity: sequelae and burden on stroke survivors and caregivers. Neurology. 2013; 80(3 Suppl 2): S45-52.
- Raghavan P, Lu Y, Mirchandani M, Stecco A. Human Recombinant Hyaluronidase Injections For Upper Limb Muscle Stiffness in Individuals With Cerebral Injury: A Case Series. EBioMedicine. 2016; 9: 306-13.
- Sharafi A, Xia D, Chang G, Regatte RR. Biexponential T1rho relaxation mapping of human knee cartilage in vivo at 3 T. NMR Biomed. 2017 (In Press)
Figures