0813
Elastography, T2-mapping, and Dixon MRI of the gluteus maximus muscle in spinal cord injured and able-bodied subjects1Biomedical Engineering, Eindhoven University of Technology, Eindhoven, Netherlands, 2Biomedical Engineering and Physics, Academic Medical Center, Amsterdam, Netherlands, 3Radiology and Nuclear Medicine, Academic Medical Center, Amsterdam, Netherlands, 4Reade, Centre for Rehabilitation and Rheumatology, Amsterdam, Netherlands, 5Center for Extreme Bionics, Media lab, MIT, Cambridge, MA, United States, 6Department of Rehabilitation, Academic Medical Center, Amsterdam Movement Sciences, Amsterdam, Netherlands, 7Image Sciences & Biomedical Engineering, King’s College London, London, United Kingdom, 8Human Movement Sciences, VU University, Amsterdam, Netherlands
Synopsis
Gluteus maximus biomechanical properties and composition are altered in spinal cord injured (SCI) subjects and increase the risk of deep tissue injury type of pressure ulcers. For this purpose, a multi-parametric MRI study of the gluteus maximus of SCI and able-bodied subjects was performed. The protocol consisted of MRE, T2-mapping, and Dixon. The gluteus maximus of SCI subjects had a lower stiffness, which was accompanied by a higher fat fraction, as compared to the able-bodied subjects. The proposed protocol has great potential in providing personalized information on deep tissue injury risk.
Purpose
The gluteus maximus muscle, covering the ischial tuberosities and coccyx, is a high-risk location for the development of deep tissue injury type of pressure ulcers, especially in spinal cord injured (SCI) subjects. Muscle atrophy, fat infiltration, decrease in muscle tone, reduced microcirculation, and impaired sympathetic nervous function affect the soft tissue biomechanical properties (e.g. shear modulus) of spinal cord injured subjects. This change in biomechanical properties and muscle composition increase the risk of deep tissue injury [1,2]. Biomechanical properties can be quantified non-invasively in vivo by elastography. For this purpose, a multi-parametric MRI study of the gluteus maximus of spinal cord injured and able-bodied subjects was performed. The multi-parametric MRI protocol consisted of elastography, T2-mapping, and Dixon.Materials & Methods
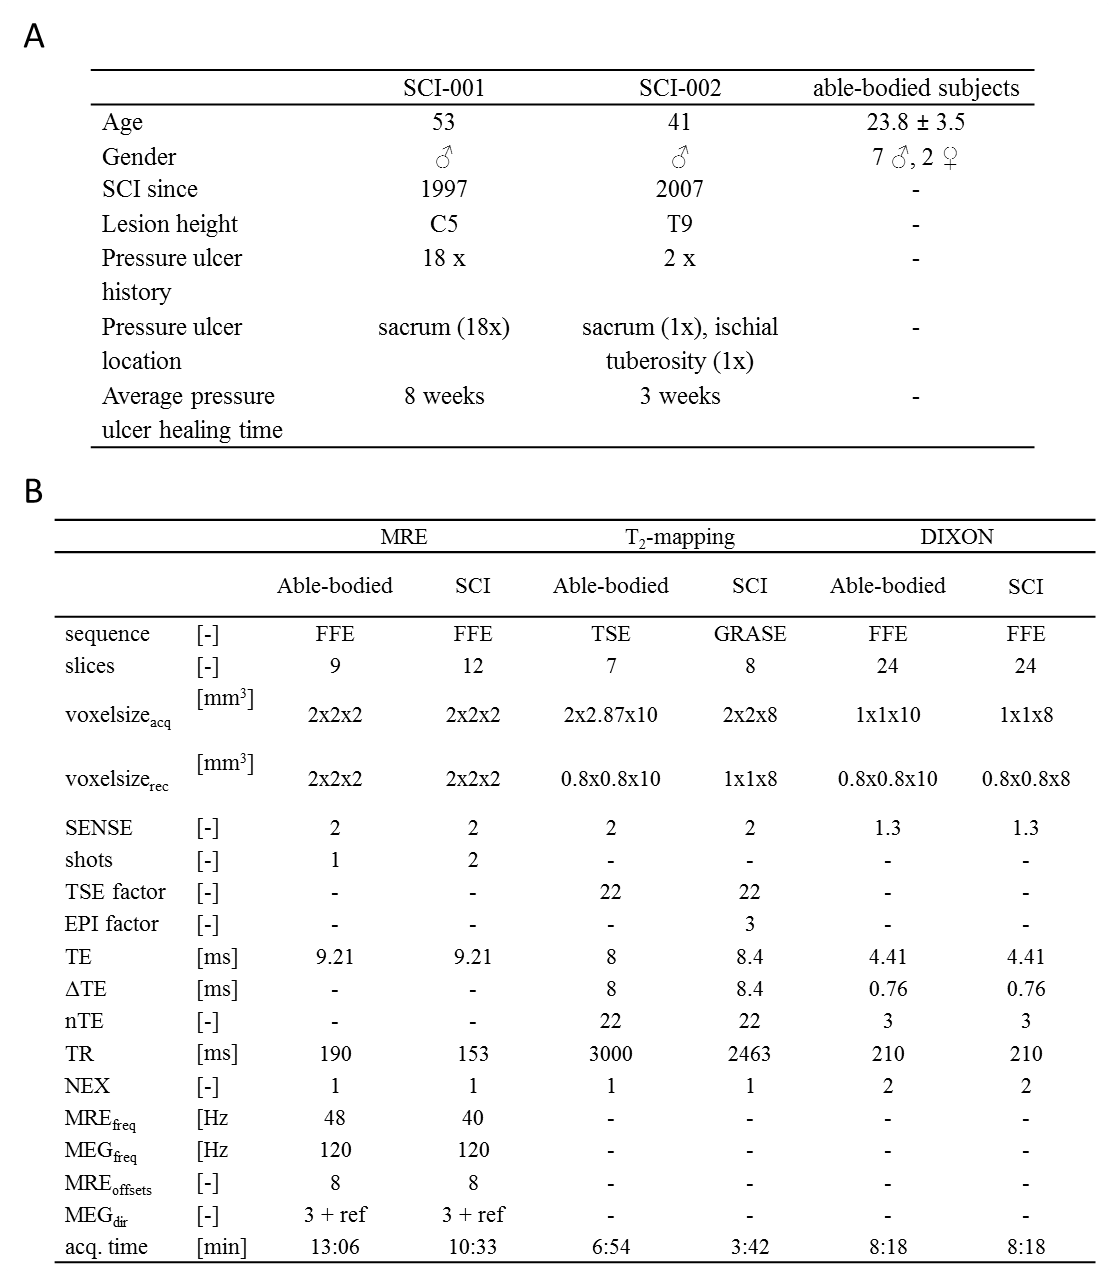
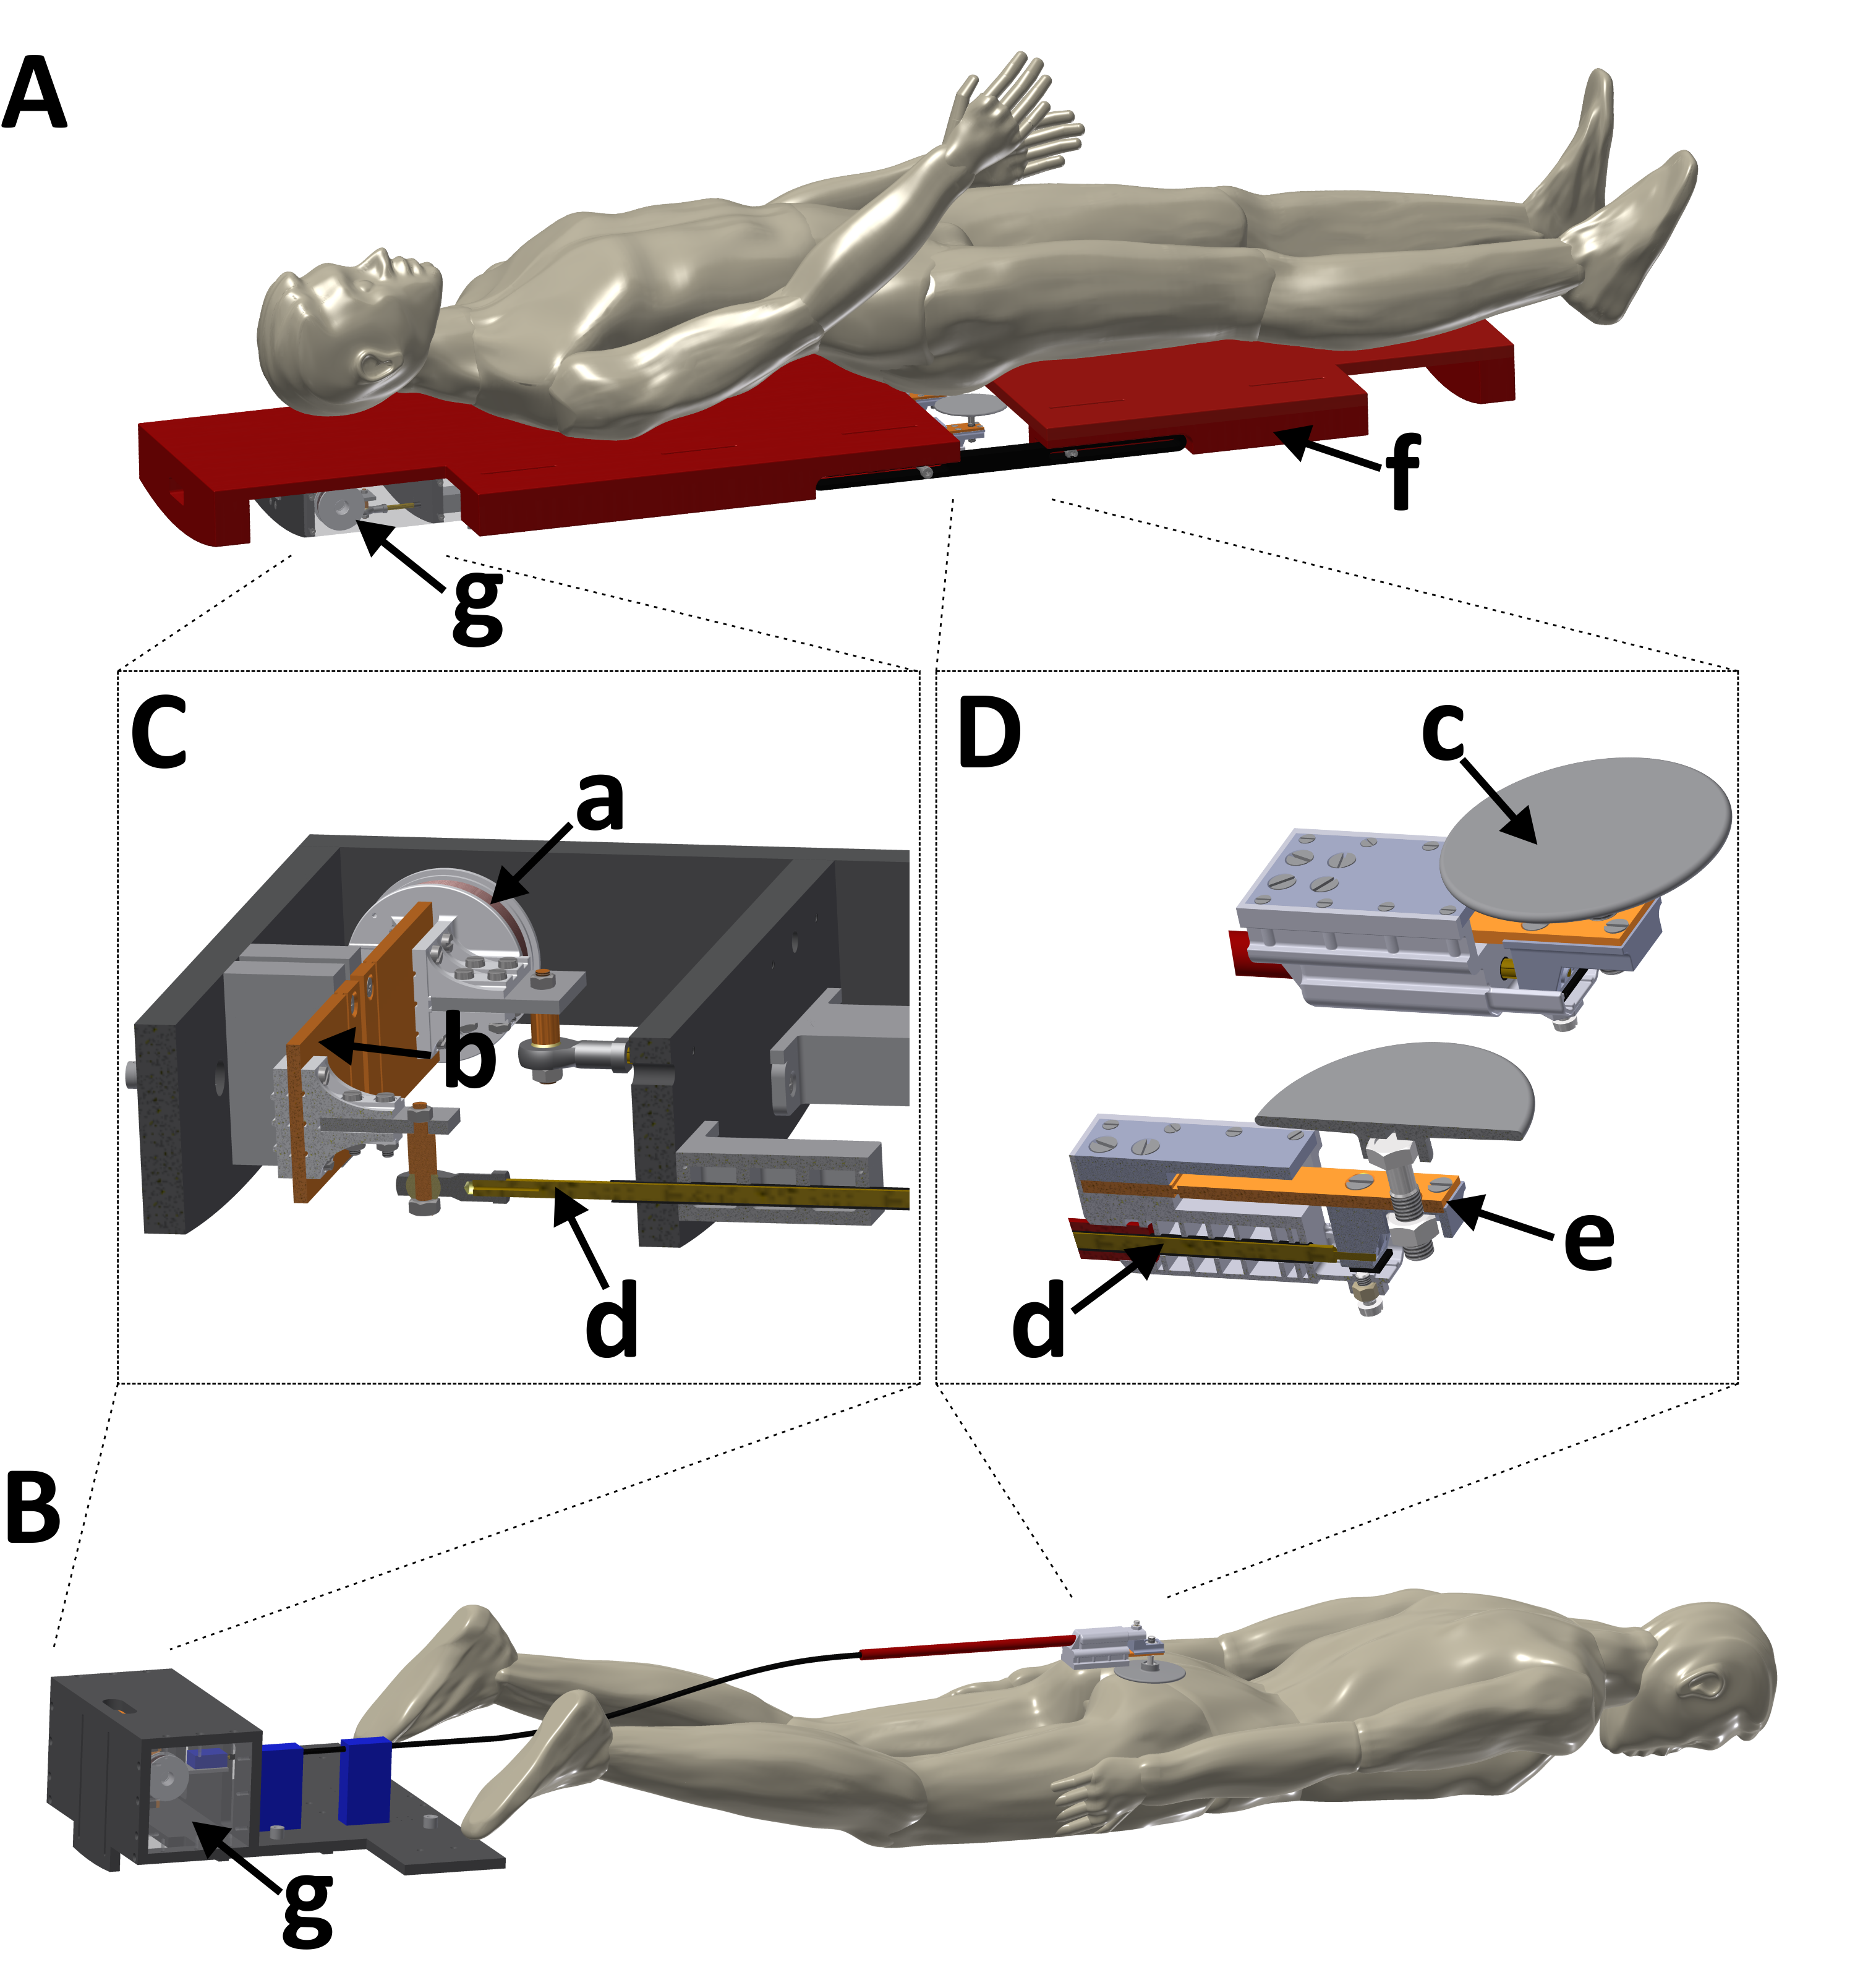
Study design: MRI of the gluteus maximus muscle was performed in 2 SCI and 9 able-bodied subjects (see fig.1A for characteristics). The multi-parametric MRI protocol consisted of MRE to determine G*, Gl, and Gd shear moduli, T2-mapping to assess the global T2mono, muscle water T2tri, and T2 based fat fraction FFT2tri,, and Dixon for fat fraction (FFdix) calculation. For the able-bodied subjects MRE images were acquired with a fractionally encoded FFE MRE sequence and foot-end MRE transducer (fig2.B). T2 quantification was performed with a Turbo Spin Echo (TSE) sequence. Dixon water, fat, in-phase, and out-phase images were acquired with a three-point FFE Dixon sequence. To reduce scan time the multi-parametric MRI protocol was slightly adapted for the SCI subjects compared to the able-bodied subjects, e.g. the T2-mapping was performed using a GRASE sequence. To allow more comfortable supine positioning a tabletop MRE transducer (fig2.A) was used in all SCI subjects. Detailed sequence parameters for both groups are shown in fig.1B. The imaging volume covered both gluteus maximus muscles in coronal orientation (fig.3ABC), MRE shear wave vibration (curl displacements in x,y,z direction shown in fig.3DEF) was performed on both, left, or right muscle(s). All MR measurements were performed with a 3 T MRI scanner (Philips). Data analysis: Elastography images were reconstructed to obtain quantitative G*, Gd, and Gl-maps [3]. Quantitative T2-maps were obtained by pixel-wise fitting the MR signal mono-exponential and tri-exponential to estimate the global T2mono and the muscle water T2tri , respectively [4]. Quantitative fat fraction maps were calculated from the Dixon fat and water image (FFdix) and using the fat and muscle fractions of the T2tri tri-exponential fit (FFT2tri) [4,5]. ROI based analysis was performed on a central slice of the calculated FFdix, FFT2tri, T2tri, T2mono, G*, Gd, and Gl-maps. The ROI was defined by manually outlining the gluteus maximus muscle in a central slice of the Dixon out-of-phase image. MV ± SD of FFdix, FFT2tri, T2tri, T2mono, Gd, Gl, and G* were determined in this ROI.Results and Discussion
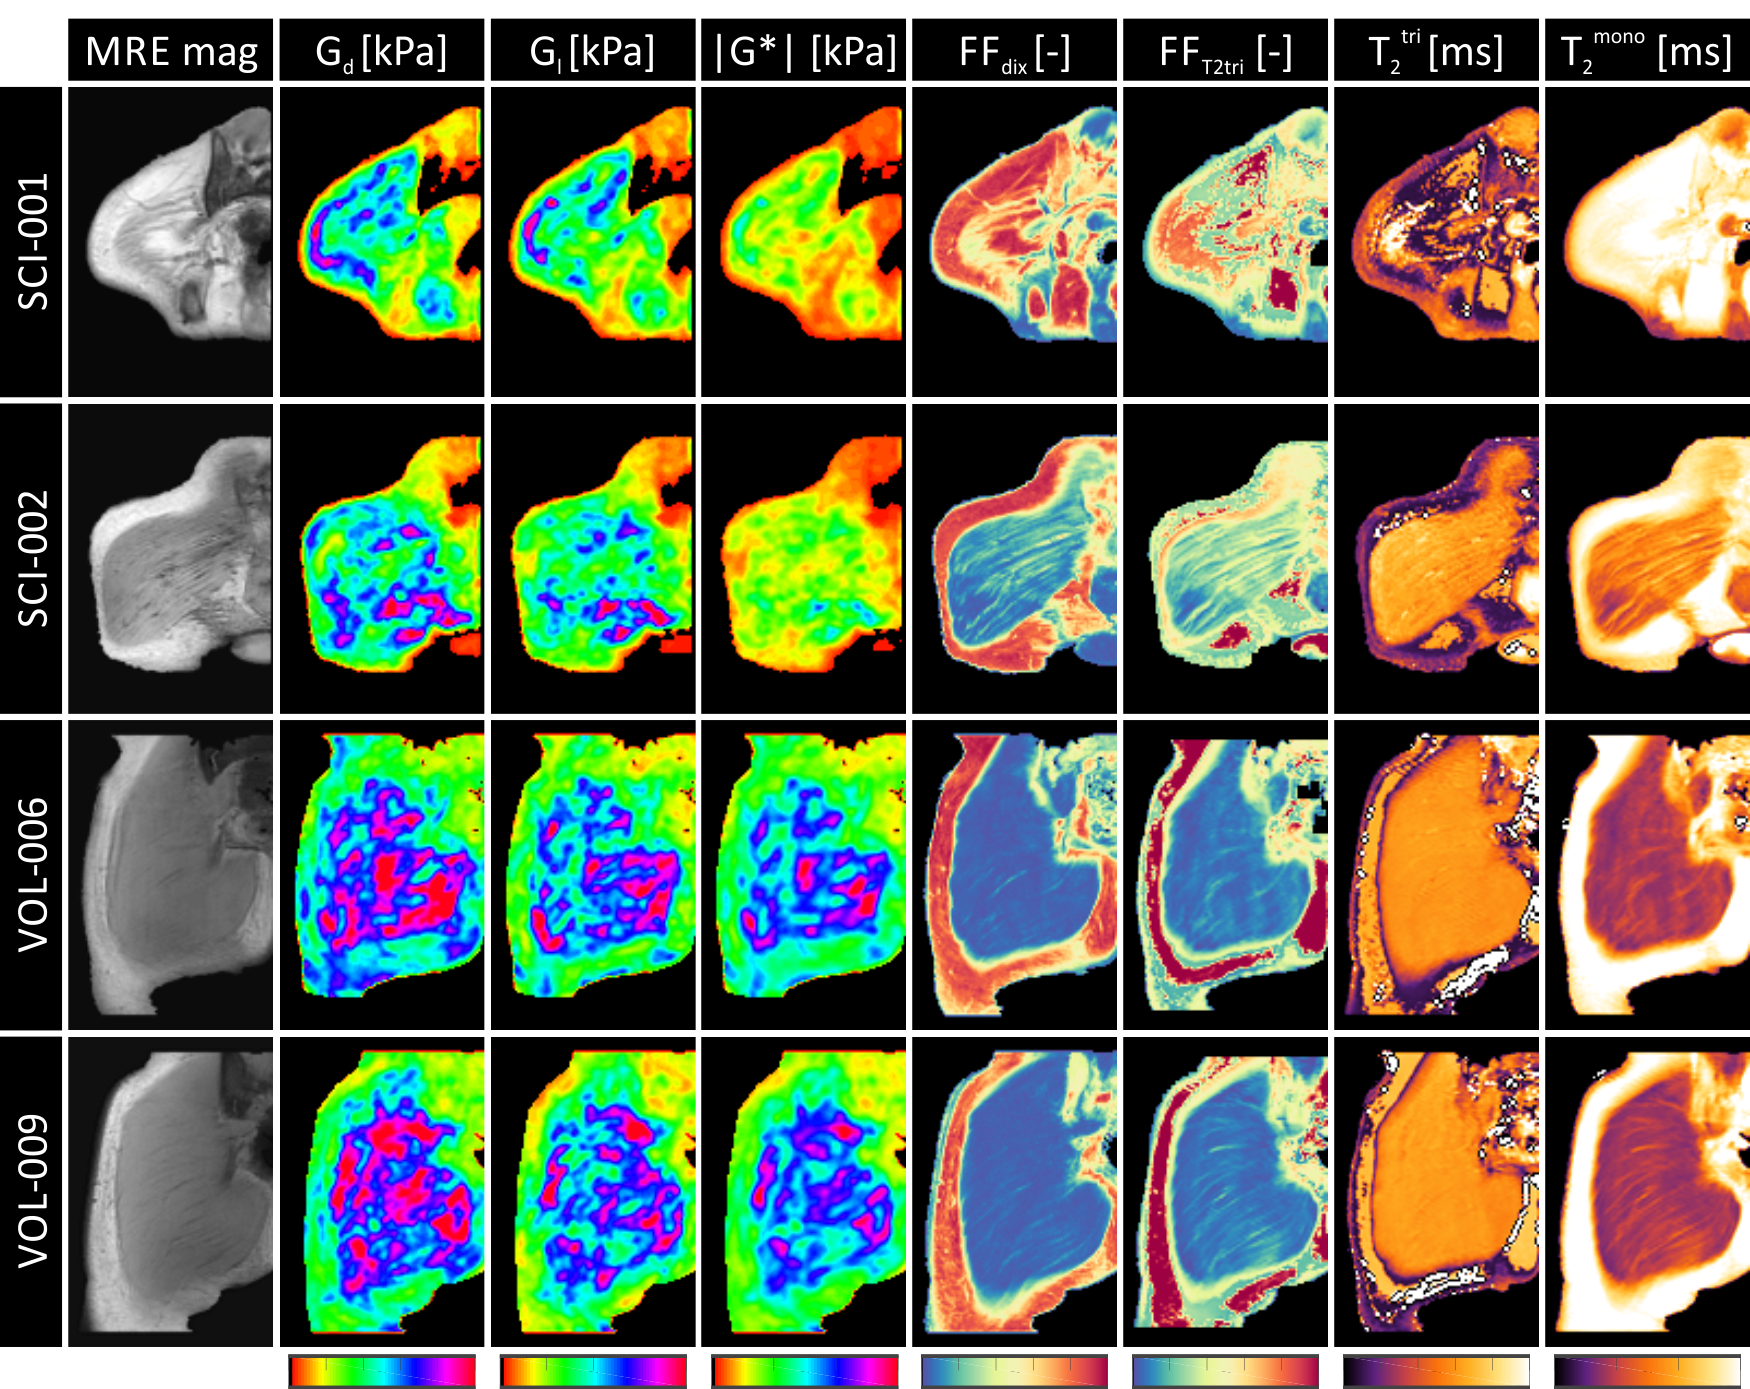
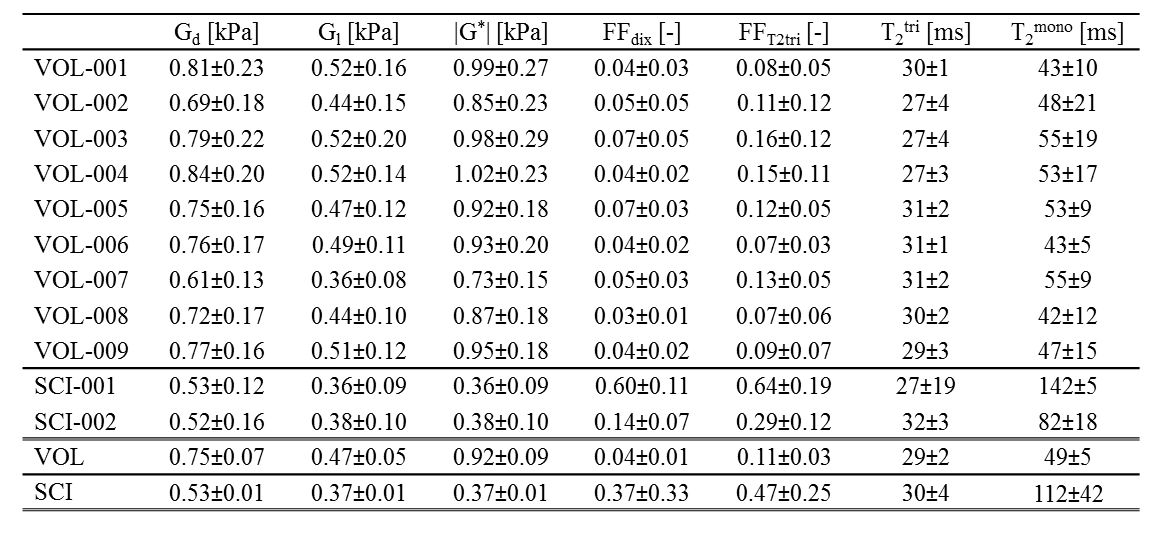
The multi-parametric readouts for two able-bodied and two SCI subjects are presented in fig.4. Distinct differences between able-bodied and SCI subjects were apparent. Able-bodied subjects (last 2 rows) showed normal muscle with little intramuscular fat surrounded by a distinct layer subcutaneous fat. SCI subjects show moderate (SCI-002) to severe (SCI-001) intramuscular fat infiltration and muscle atrophy. Compared to the able-bodied subjects the SCI subjects displayed lower stiffness on G*, Gd, and Gl-maps in muscle, together with less difference in stiffness between muscle and subcutaneous fat. On the G*-maps of the SCI subjects no differences between muscle and subcutaneous fat were observed. Dixon (FFdix) and T2tri (FFT2tri) fat fraction maps showed a higher fat fraction and higher T2mono in muscle compared to the able-bodied subjects. Multi-parametric MRI mean ± SD gluteus maximus muscle ROI measurements are summarized in fig.5 for each SCI and able-bodied subject. Gd, Gl, and G* were lower in SCI compared to able-bodied subjects. The T2tri for both SCI and able-bodied subjects was close to each other. As expected the T2mono depended on the amount of fat infiltration. FFT2tri and FFdix fat fraction estimations follow each other, with FFT2tri always higher than FFdix (paired sample t-test, P < 0.001). Both SCI subjects were dissimilar in fat fraction to each other, while no difference in shear moduli was observed. The T2tri SD of SCI subject SCI-001 was remarkable high compared to the SCI-002 subject.Conclusion
The presented multi-parametric MRI protocol provided detailed structural and biomechanical information of the gluteus maximus muscle. Clear differences in the multi-parametric readouts between SCI and able-bodied subjects were found. SCI subjects showed a lower stiffness and higher fat fraction compared to the able-bodied subjects. The proposed multi-parametric MRI protocol has great potential in providing personalized information on deep tissue injury risk in SCI subjects.Ethical approval
The study was approved by the ethics committee of the AMC,Amsterdam,and the scientific committee of READE,Amsterdam. All subjects signed an informed consent form.Acknowledgements
This research was supported by the Dutch Technology Foundation STW (NWO) and COST BM1304 MYOMRI action.References
1. Sopher R, Nixon J, Gorecki C, Gefen A. Effects of Intramuscular Fat Infiltration, Scarring, and Spasticity on the Risk for Sitting-Acquired Deep Tissue Injury in Spinal Cord Injury Patients. J Biomech Eng. American Society of Mechanical Engineers; 2011;133: 21011. doi:10.1115/1.4003325
2. Loerakker S, Solis LRR, Bader DL, Baaijens FP. PT, Mushahwar VKK, Oomens CWJWJ. How does muscle stiffness affect the internal deformations within the soft tissue layers of the buttocks under constant loading? Comput Methods Biomech Biomed Engin. 2012; 37–41. doi:10.1080/10255842.2011.627682
3. Sinkus R, Lorenzen J, Schrader D, Lorenzen M, Dargatz M, Holz D. High-resolution tensor MR elastography for breast tumour detection. Phys Med Biol. 2000/06/28. 2000;45: 1649–64.
4. Azzabou N, Loureiro de Sousa P, Caldas E, Carlier PG, Sousa PL de, Caldas E, et al. Validation of a generic approach to muscle water T2 determination at 3T in fat-infiltrated skeletal muscle. J Magn Reson Imaging. 2014;0: 1–9. doi:10.1002/jmri.24613
5. Berglund J, Johansson L, Ahlström H, Kullberg J. Three-point dixon method enables whole-body water and fat imaging of obese subjects. Magn Reson Med. Wiley Subscription Services, Inc., A Wiley Company; 2010;63: 1659–1668. doi:10.1002/mrm.22385
Figures