0812
Evaluating Therapeutic Response of Glioblastoma (GBM) with Chemical Exchange Saturation Transfer (CEST)1Physical Sciences, Sunnybrook Research Institute, Toronto, ON, Canada, 2Radiology & Biomedical Imaging, University of California, San Francisco, San Francisco, CA, United States, 3Radiation Oncology, Sunnybrook Health Sciences Centre, Toronto, ON, Canada
Synopsis
Early assessment of glioblastoma (GBM) response to standard 6-week chemo-radiation enables changing or adjusting therapy in patients with progressive tumors. Chemical Exchange Saturation Transfer (CEST) probes the concentration and exchange of labile proteins and peptides in ht tumor and is more sensitive to treatment-induced effects. CEST was capable of differentiating progressors from non-progressors as early as two weeks into the treatment. Moreover, certain CEST metrics (i.e. MTRNOE, MTRAmide, CESTNOE) were capable of characterizing GBM aggressiveness even before the start of the treatment.
Purpose
To characterize GBM response to concurrent radiotherapy and chemotherapy with chemical exchange saturation transfer (CEST).Introduction
GBM is the most common malignant primary brain tumor in adults and has a dismal survival rate1,2. GBM patients are treated with a combination of surgical resection, radiotherapy and chemotherapy3. Advanced CEST biomarkers may identify non-responders and allow for change or adjustment of the therapy early.Materials & Methods
Patients: 19 patients were recruited (REB approved) and were treated for six weeks with concurrent radiation (2Gy/day) and daily Temozolomide. Patients were MRI-scanned 4 times:
1. before treatment (Day0),
2. After 10 treatment sessions (Day14),
3. After 20 treatment sessions (Day28),
4. One month after last treatment day (Day70).
MRI: was performed on a 3T Philips Achieva scanner. An axial slice passing through the tumor was imaged with TFE (TR/TE=7.78/4.5ms, Matrix=144×144, FOV=20×20cm, slice=3mm).
CEST imaging covered offsets between -5.9ppm and 5.9ppm with 0.2ppm increments, with 4 references at ~780ppm at the beginning and another 4 references at the end of the spectrum. RF saturation included 4 block pulses of 242.5ms each (970ms total), and B1=0.52µT4,5. CEST imaging was repeated twice for a total of 4.8min.
Analysis: All images (CEST, T1, T2, post Gd-T1w, FLAIR were co-registered to the first acquired CEST image. Tumor ROI was identified at each scan on the post-Gd T1w. Metrics were calculated voxel-by-voxel and then averaged over ROI.
CEST: B0 and Drift correction was performed4 followed by decomposition of CEST spectrum into a constant MT (for ‑5.9ppm to 5.9ppm) and four Lorentzian line-shapes (Amide, NOE, Amine, bulk water). Area under the curve of NOE & Amide CEST peaks (CESTNOE & CESTAmide), the constant MT, MTR at -3.5ppm (MTRNOE) and -3.5ppm (MTRAmide) were used as CEST metrics.
Results
Tumor progression was determined by an oncologist blinded to the MRI analysis at 3-8 months after the end of the 6-week chemo-radiation treatment based on clinically used RANO criteria. Data of three patients were discarded due to incomplete scans or presence of imaging artifacts. Six patients had tumor progression (progressors cohort) and 10 patients did were classified as non-progressors.
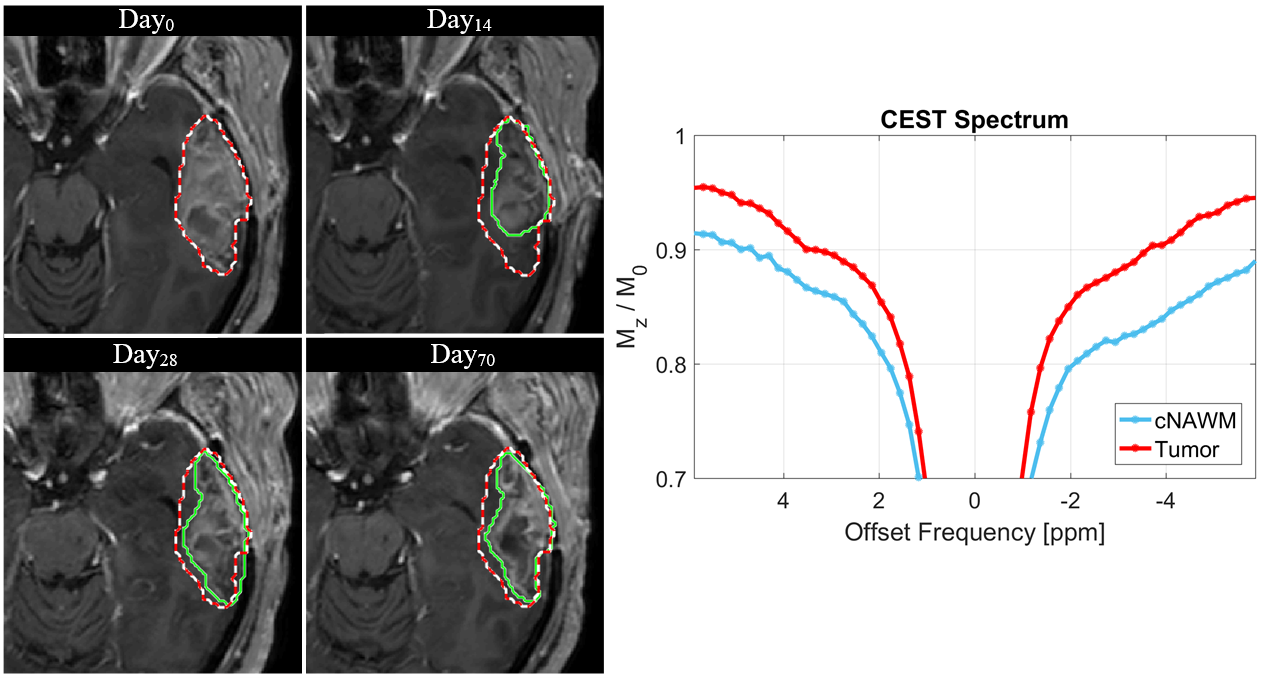
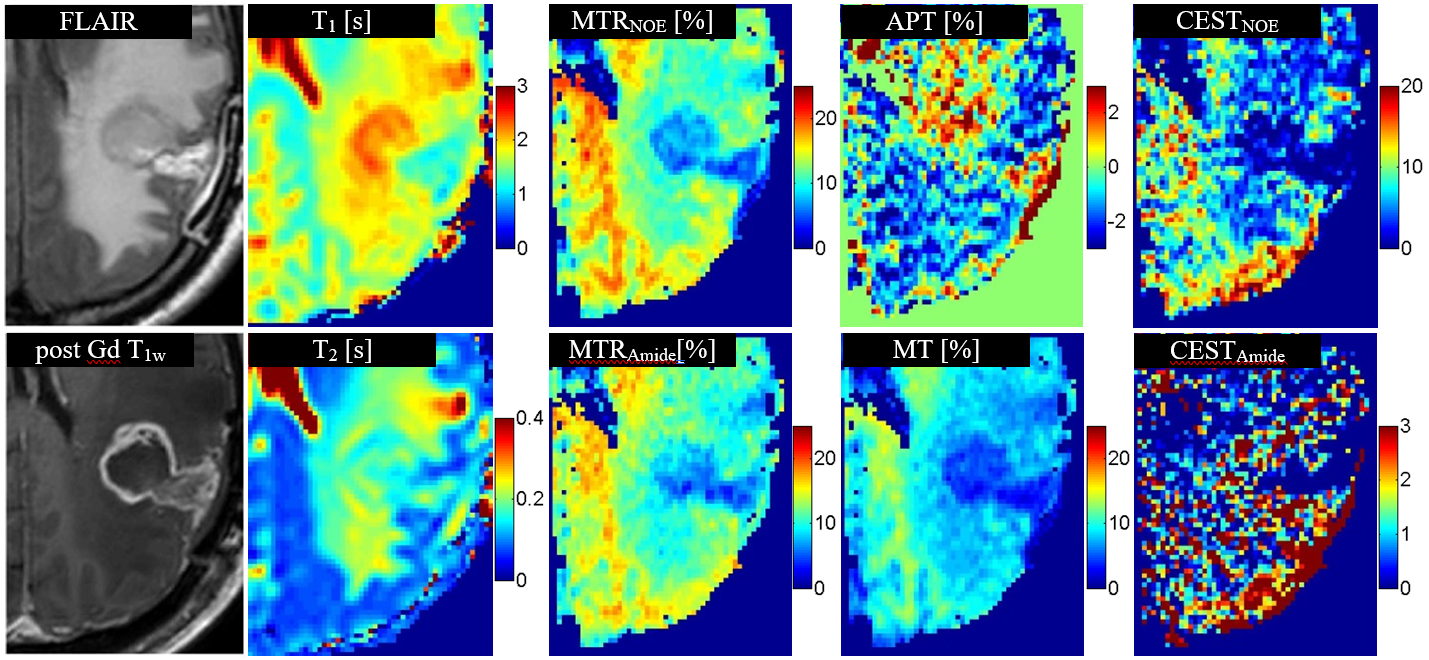
Figure1 shows CEST spectrums of tumor and contralateral normal appearing white matter (cNAWM) of a representative patient. Figure2 shows the parametric maps of CEST metrics Day0 scan of one patient along with the T1 and T2 relaxation time maps.
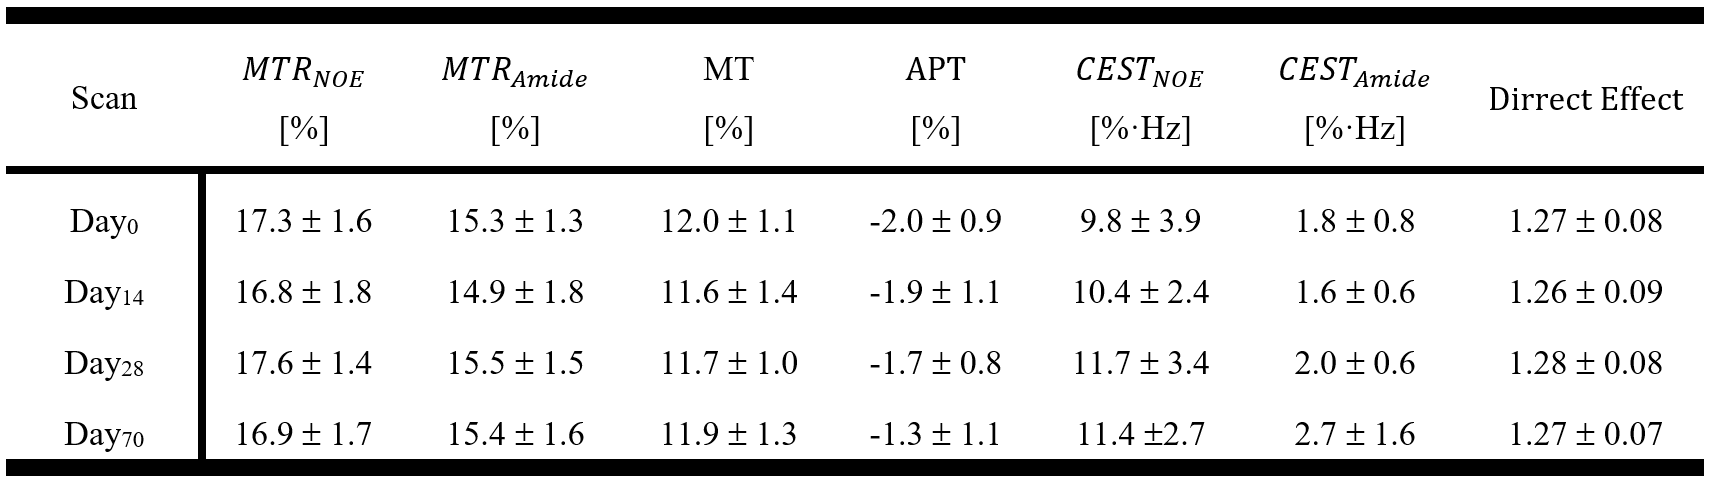
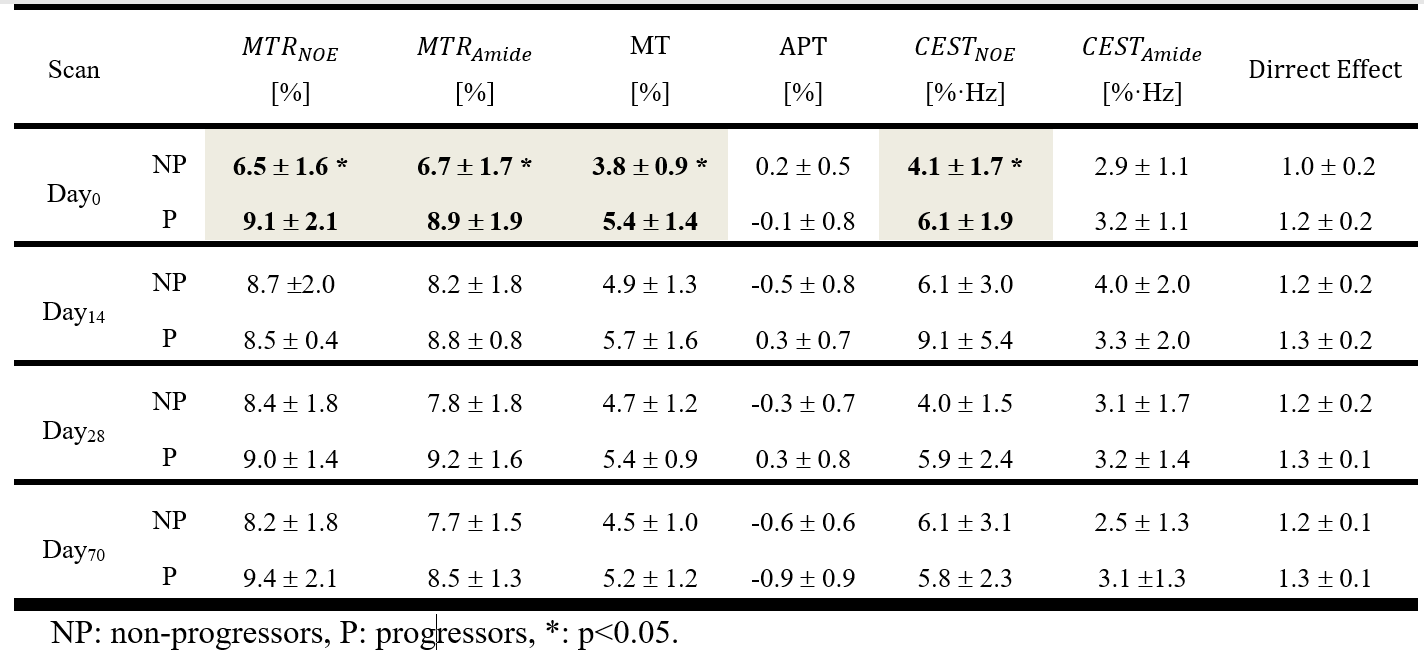
Table1 reports the CEST metrics parameters for cNAWM averages over all patients. Table2 reports CEST metrics for tumor ROI showing at Day0 the MTRNOE (p=0.015), MTRAmide (p=0.028), MT (p=0.019), and CESTNOE (p=0.044) at baseline (Day0) were statistically significantly different between the progressors and non-progressors.
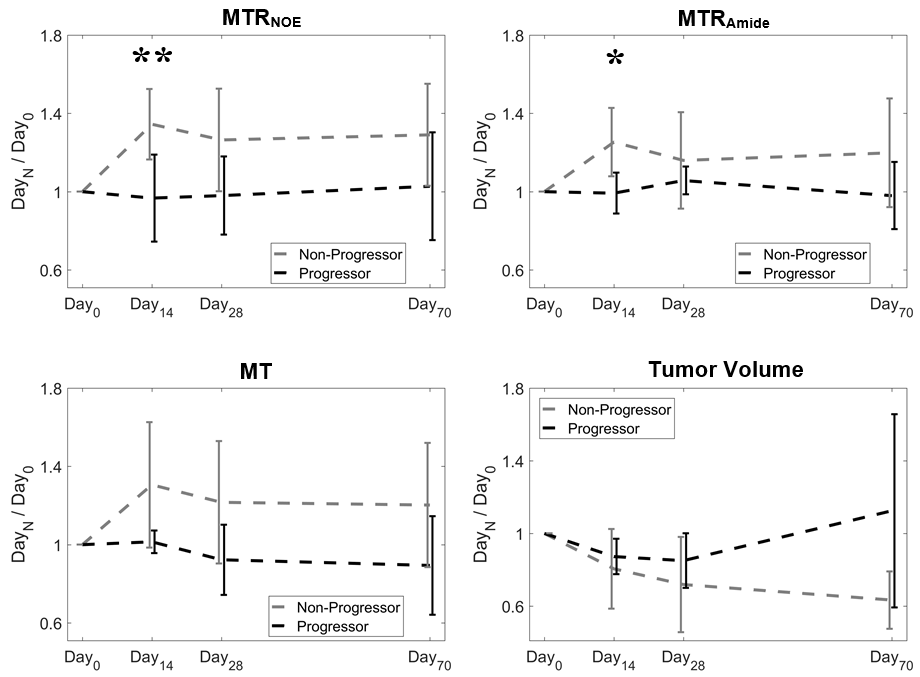
Figure3 plots the ratio of each metric at each time point over its value at Day0 (which represents the change in these parameters) for MTRNOE, MTRAmide, MT, and tumor volume.
Discussions
All the CEST metrics reported in Table2 for Day0 of non-progressors were lower (except for APT) showing they have lower metabolic activity compared to progressors. Several of these metrics were able to differentiate progressor from non-progressor before the start of the treatment. Thus, CEST is capable of characterizing GBM tumor aggressiveness and identifying patients that will not benefit from standard chemo-radiation therapy, even before treatment.
When considering the changes in metrics during treatment (shown in Figure3 by the ratio of each metric over its Day0 value), there was statistically significant difference between progressors and non-progressors (for changes between Day0 and Day14) for MTRNOE (Non-progressors=1.35±0.18, Progressors=0.97±0.22, p=0.006), and MTRAmide (Non-progressors=1.25±0.17, Progressors=0.99±0.10, p=0.017). Furthermore, although there were large differences in the CEST metrics at baseline, at later time-points there were no statistically significant differences between the two cohorts. Thus, two weeks into treatment is the best time-point to evaluation GBM response to chemo-radiation. The lack of statistical significance at later time points could also be associated with the fact that fewer progressors participated in the later scans (3 at Day70 compared to 6 at Day0).
It is worth noting that tumor volume or its changes were not capable of differentiating the two cohorts at any time points which emphasizes on the need for longer follow-ups when relying on clinically used response evaluation markers (which are based on tumor size).
Conclusions
CEST can provide imaging-based biomarkers of GBM response as early as two weeks into the treatment. Certain CEST metrics can characterize tumor aggressiveness and identify progressors even before beginning the treatment. Such early biomarker of response may allow for adjusting GBM treatment planning for adaptive radiotherapy in progressors and more confidently continuing standard adjuvant treatment for non-progressors.Acknowledgements
This study was funded by Terry Fox Research Institute (TFRI project 1034), Canadian Cancer Society Research Institute (CCSRI 701640) and Brain Canada grant (CCSRI 705083).References
1. Ryken, T. C. et al. The role of imaging in the management of progressive glioblastoma: A systematic review and evidence-based clinical practice guideline. J. Neurooncol. 118, 435–460 (2014).
2. Koshy, M. et al. Improved survival time trends for glioblastoma using the SEER 17 population-based registries. J. Neurooncol. 107, 207–212 (2012).
3. Olson, J. J. & Ryken, T. Guidelines for the treatment of newly diagnosed glioblastoma: introduction. Journal of neuro-oncology 89, 255–258 (2008).
4. Mehrabian, H., Desmond, K. L., Soliman, H., Sahgal, A. & Stanisz, G. J. Differentiation between radiation necrosis and tumor progression using chemical exchange saturation transfer. Clin. Cancer Res. 23, clincanres.2265.2016 (2017).
5. Desmond, K. L. et al. Chemical exchange saturation transfer for predicting response to stereotactic radiosurgery in human brain metastasis. Magn. Reson. Med. 78, 1110–1120 (2017).
Figures