0810
Efficacy of oral CKD-516 in combination with sorafenib on hepatocellular carcinoma using MRI and optical imaging1Radiology, Asan medical Center, Seoul, Republic of Korea, 2GangNeung Asan Medical Center, Gangneung, Republic of Korea, 3Chong Kun Dang Research, Seoul, Republic of Korea, 4MR Core Laboratory, Asan medical Center, Seoul, Republic of Korea
Synopsis
We used an oral form of CKD-516 and designed a combination experiment with sorafenib. BLI tumor viability measurement showed CKD-516 was effective in combination with sorafenib, but there was only a slight improvement when treated alone. By MRI, the CKD-516 group showed notable intratumoral hemorrhage and central necrosis from the early stage of treatment. By IHC, CKD-516 was advantageous in collapsing blood vessels in tumor tissue, and was more effective when treated in combination with sorafenib. Therefore, oral CKD-516 was advantageous over sorafenib in terms of vascular disrupting ability, and combination of CKD-516 with sorafenib reduced the rebound phenomenon.
Introduction
CKD-516 is a vascular disrupting agent (VDA), meaning it has the unique property of selectively disrupting the vasculature of tumor endothelium.[1] In order to overcome the inconveniences of intravenous injection and to prevent the rebound phenomenon of CKD-516, we used an oral form of CKD-516. Since sorafenib has shown an advantageous effect on the survival rate of hepatocellular carcinoma,[2] we designed a combination experiment of oral CKD-516 and sorafenib. We aimed to assess the efficacy of oral CKD-516 in combination with sorafenib on hepatocellular carcinoma using MRI and optical imaging.Methods
Experiment design: Hep3B-Luc cells were engrafted into Balb/c-nude mice. CKD-516 (Chong Kun Dang Pharm, Seoul, Korea) and Sorafenib (Woburn, MA, USA) were dissolved in saline and Cremophor EL/ethanol.
Acquisition of bioluminescence imaging: Bioluminescence imaging (BLI) was performed using the IVIS spectrum (PerkinElmer, MA, USA). Signals within ROIs were measured using Living Image® 4.2 software (PerkinElmer).
Acquisition of MRI and tumor volume measurement: All MR imaging was performed on a 9.4 T/160 mm small animal system (Agilent Inc., CA, USA). Axial T2-weighted fast spin echo (FSE) images were used to cover the tumor regions completely. Tumor volumes were measured on MR images using ImageJ software (NIH, Bethesda, MD, USA).
Histologic evaluation: All animals were euthanized on day 21 after treatment. H&E staining, TUNEL assay for apoptosis measurement, and immunohistochemistry for CD31 (endothelial cell marker) and meca-32 (panendothelial cell marker) for micro vessel area (MVA) measurement were performed.
Statistical analysis: Repeated measures ANOVA and one-way ANOVA test were performed. (SPSS, version 21.0 for Windows, SPSS, Chicago, IL).
Results
In the CKD-516 group, the BLI signal intensity decreased in the tumor at the early stage of treatment and then continuously increased in the remaining treatment period due to a rebound phenomenon. In the sorafenib group, the signal intensity gradually decreased over the whole treatment period. In contrast, in the combination group, the signal intensity rapidly decreased in the early stage of treatment and then remained at the decreased level during the remaining treatment period (Fig. 2).
MRI findings showed intratumoral hemorrhage in the periphery regions in the early stage of treatment in the CKD-516 group. In the sorafenib group, cystic degeneration occurred in multifocal areas within the tumors. The combination group showed extensive necrosis over all tumor regions from the early stage of treatment (Fig. 3). Two mice in the combination group died during the treatment period, but the surviving mice showed no signs of debilitation during the treatment period (Fig. 1A, 1B).
By H&E staining and TUNEL assay, severe central necrosis was observed in the combination group (Fig. 4). In IHC with CD31 and meca-32, the CKD-516 group showed severely collapsed blood vessels in the tumor tissue, suggestive of a vascular disrupting effect. In the sorafenib group, the number of blood vessel was not affected, but a reduction of the tumor microvessel area (MVA) was observed. The combination group showed both collapsed and diminished diameter blood vessels (Figure 4).
A correlation existed between tumor volumetry by MRI and volume measurement by caliper in the control and CKD-516 groups (R2=0.9975, 0.9816), but not in the sorafenib and combination groups. In comparing volumetry measurement by MRI and BLI, there were fewer or no correlations among all groups (Figure 5).
Discussion
Oral CKD-516 had a marginal advantage over the sorafenib or combination groups in tumor size measurements. However, in assessing anticancer drug efficacy, classical studies, like measuring tumor size by caliper, may not be good biomarkers, because CKD-516 and sorafenib cause cystic change and central necrosis. Sorafenib is known to cause cystic degeneration in tumors,[3, 4] and this was observed by high SI fluid in MRI T2 resulting in increasd tumor size caused by water-filled tumor tissues. The CKD-516 group showed notable intratumoral hemorrhage in the periphery regions and central necrosis from the early stage of treatment. Cystic degeneration or hemorrhage may result in increased tumor volume, which may not accurately represent the efficacy of the drugs. In both correlation analyses, R2 decreased from control to CKD, sorafenib and combination groups. This phenomenon implies that volumetry measurement alone does not represent tumor viability when vascular disturbing drugs are used and intratumoral necrosis and apoptosis occur.Conclusion
Our study showed that oral CKD-516 may have advantages over sorafenib in terms of vascular disrupting ability, and the combination of CKD-516 with sorafenib may reduce the rebound phenomenon. For future pre-clinical practice dealing with anti-cancer drugs, BLI may have advantages in measuring the actual tumor viability, and MRI can present the evidence supporting the BLI results.Acknowledgements
This study was supported by C-BiND of asan medical center and Chong Kun Dang Pharmaceutical Corporation.References
1. Lee, J., et al., Identification of CKD-516: a potent tubulin polymerization inhibitor with marked antitumor activity against murine and human solid tumors. J Med Chem, 2010. 53(17): p. 6337-54.
2. Adnane, L., et al., Sorafenib (BAY 43-9006, Nexavar), a dual-action inhibitor that targets RAF/MEK/ERK pathway in tumor cells and tyrosine kinases VEGFR/PDGFR in tumor vasculature. Methods Enzymol, 2006. 407: p. 597-612.
3. Maataoui, A., et al., Transarterial chemoembolization alone and in combination with other therapies: a comparative study in an animal HCC model. Eur Radiol, 2005. 15(1): p. 127-33.
4. Kim, K.W., et al., Vascular disrupting effect of CKD-516: preclinical study using DCE-MRI. Invest New Drugs, 2013.
Figures
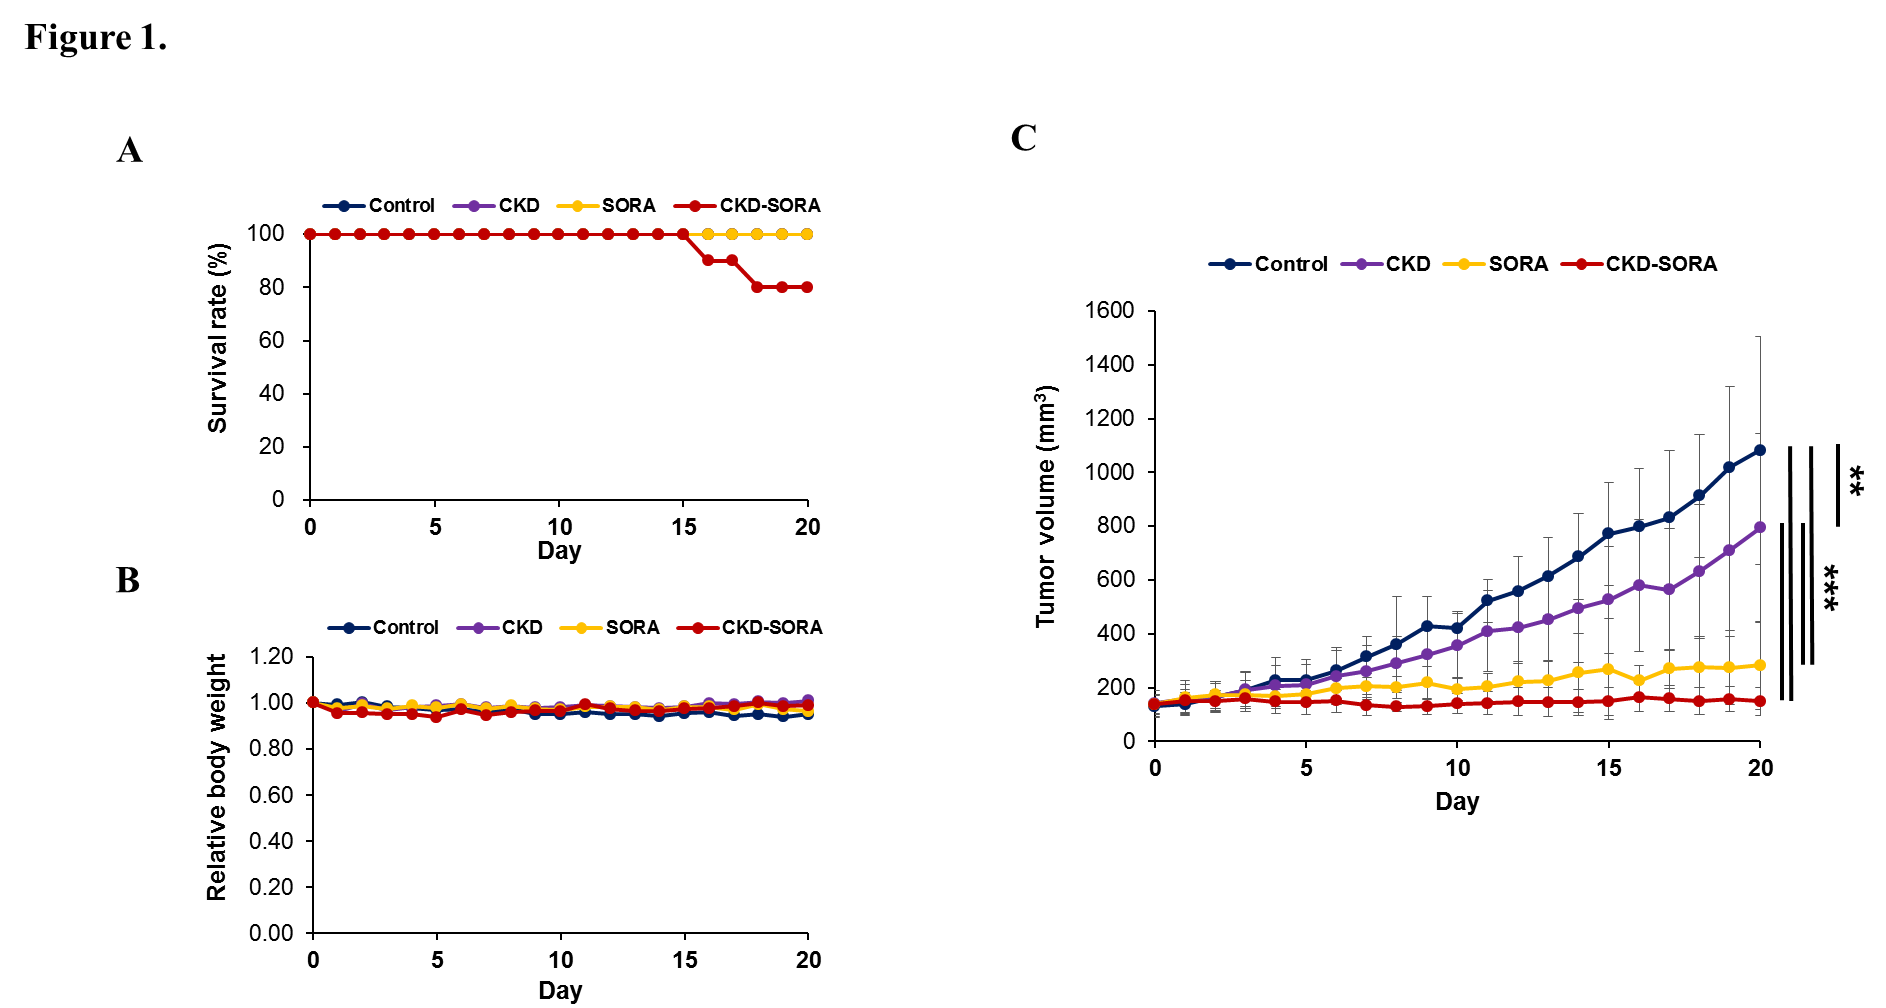
Figure 1. Animal model and monitoring after single or combination administration of therapeutic agents.
(A) Survival rate of all four groups (control, n = 8; CKD-516, n = 11; sorafenib, n = 8; and combination, n = 10).
(B) Body weight of all four groups. (C) Volumetry results of all four groups with caliper (** p < 0.01, *** p < 0.001).
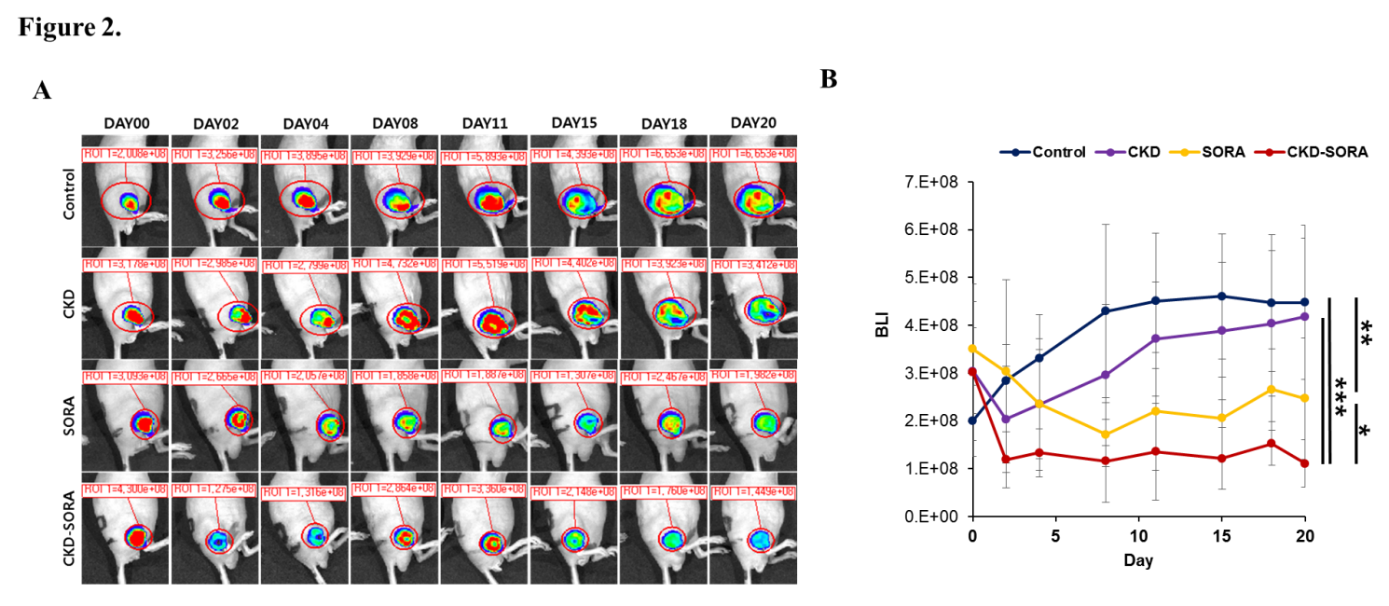
Figure 2. Tumor viability measurements by BLI.
(A) Representative bioluminescence image.
(B) Analysis of BLI signals of each group over the treatment period (* p < 0.05, ** p < 0.01, *** p < 0.001).
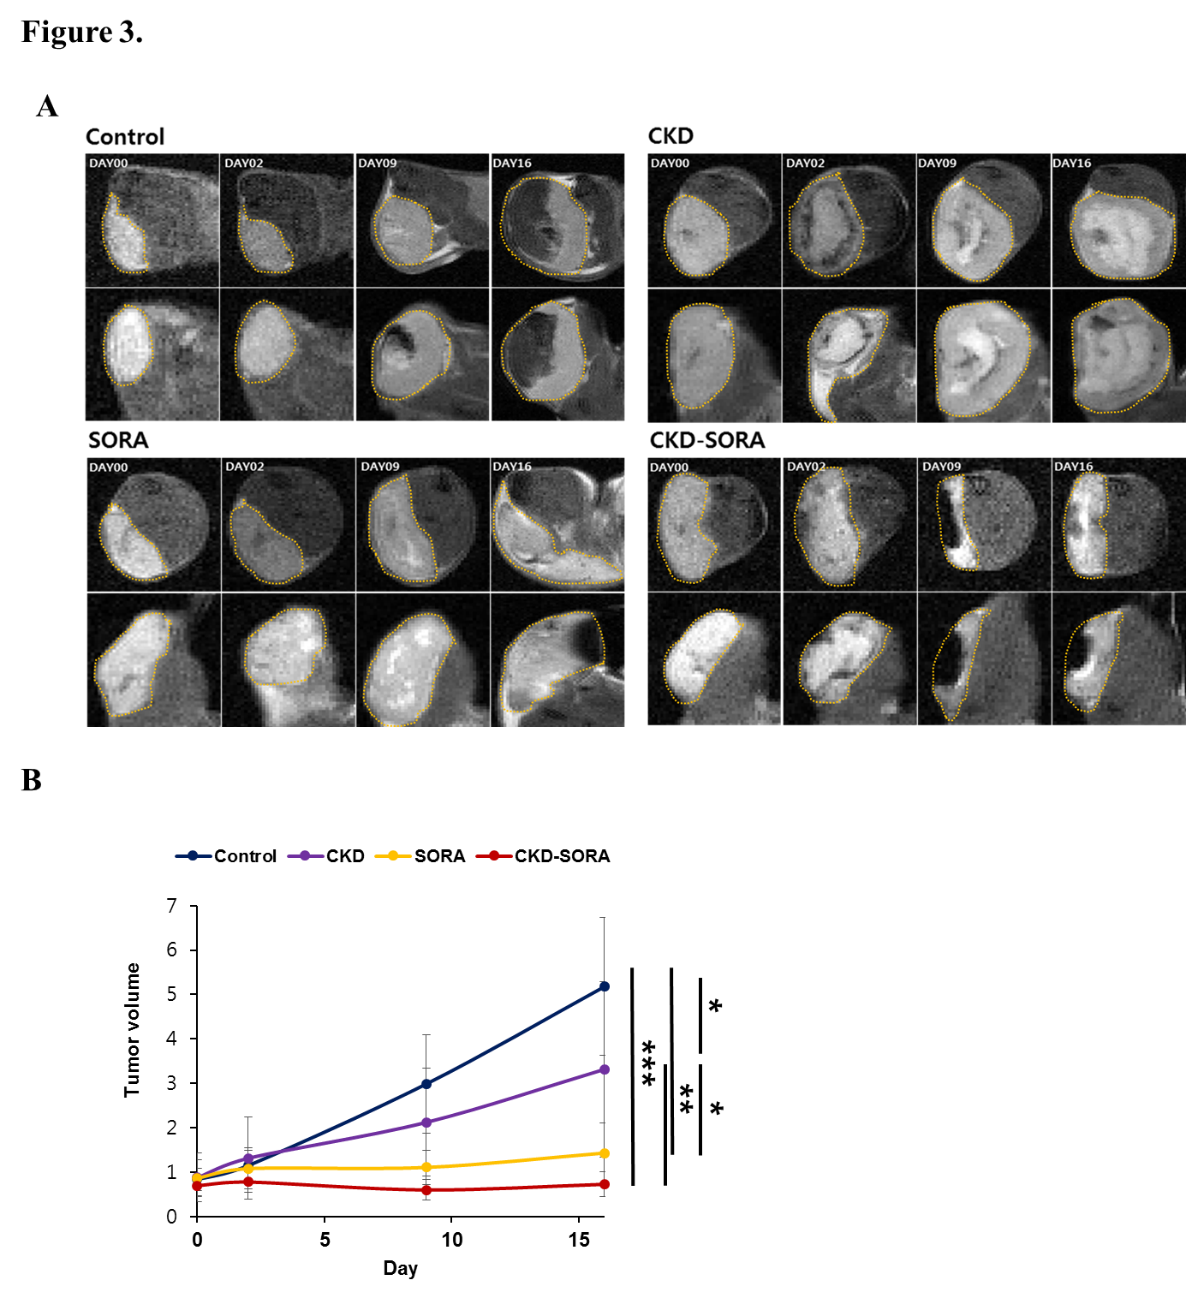
Figure 3. Tumor volumetry measurements by MRI.
(A) Representative MRI T2-weighted images of each group at each time point. Tumor is indicated by the yellow dotted line.
(B) Analysis of tumor volume of each group (* p < 0.05, ** p < 0.01, *** p < 0.001).
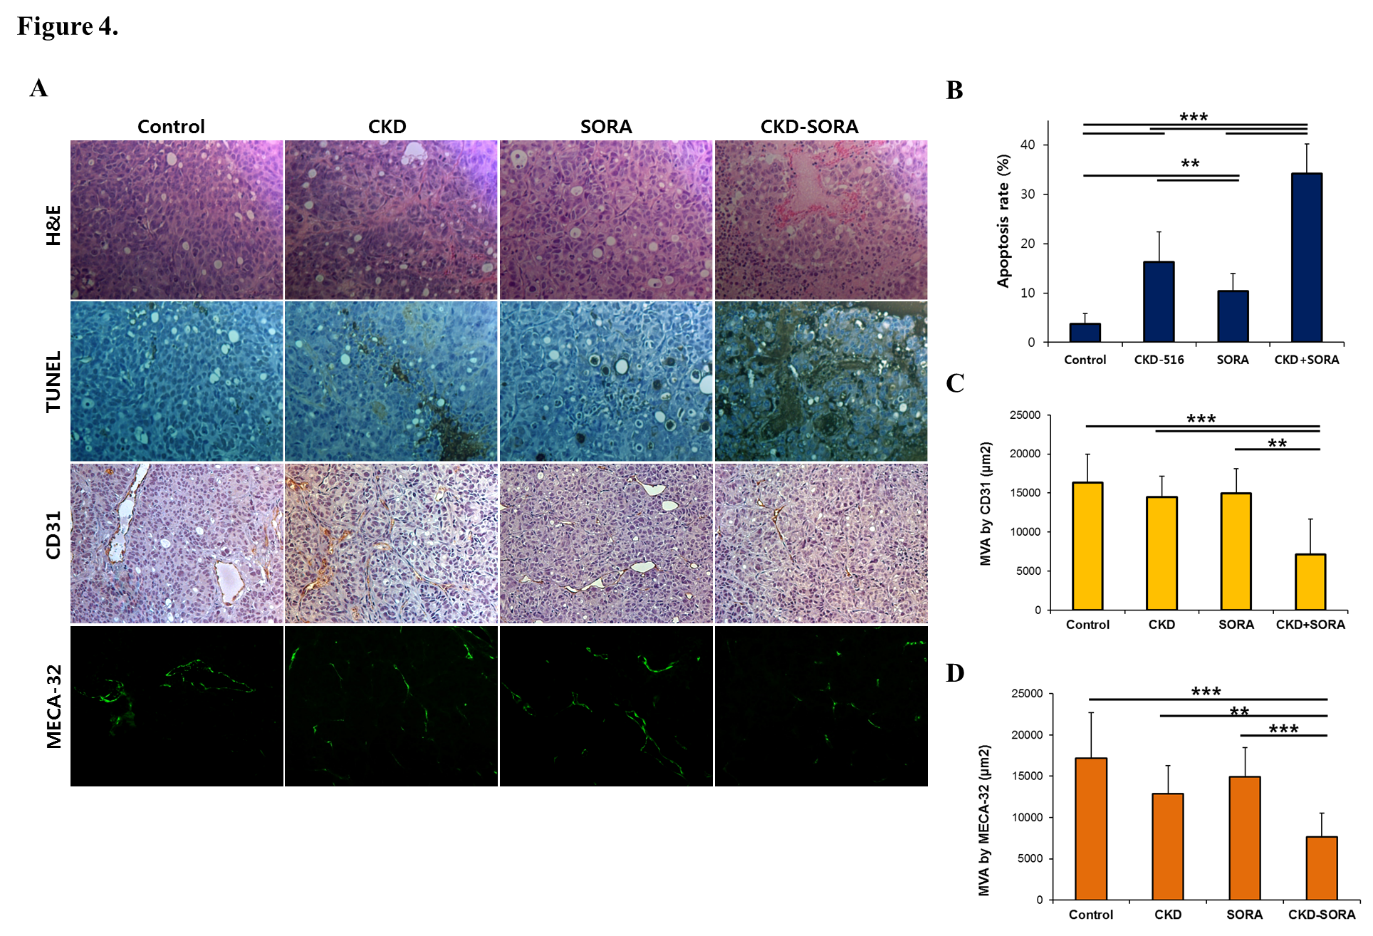
Figure 4. Histological analysis of H&E, TUNEL staining, and MVA by CD31 and MECA-32.
(A) Representative images of H&E, TUNEL staining, IHC staining for anti-CD31 and MECA-32.
(B) Apoptosis rate of each group (** p < 0.01, *** p < 0.001).
(C, D) Quantitative analysis of micro vessel area (MVA) by CD31 and MECA-32 (** p < 0.01, *** p < 0.001).
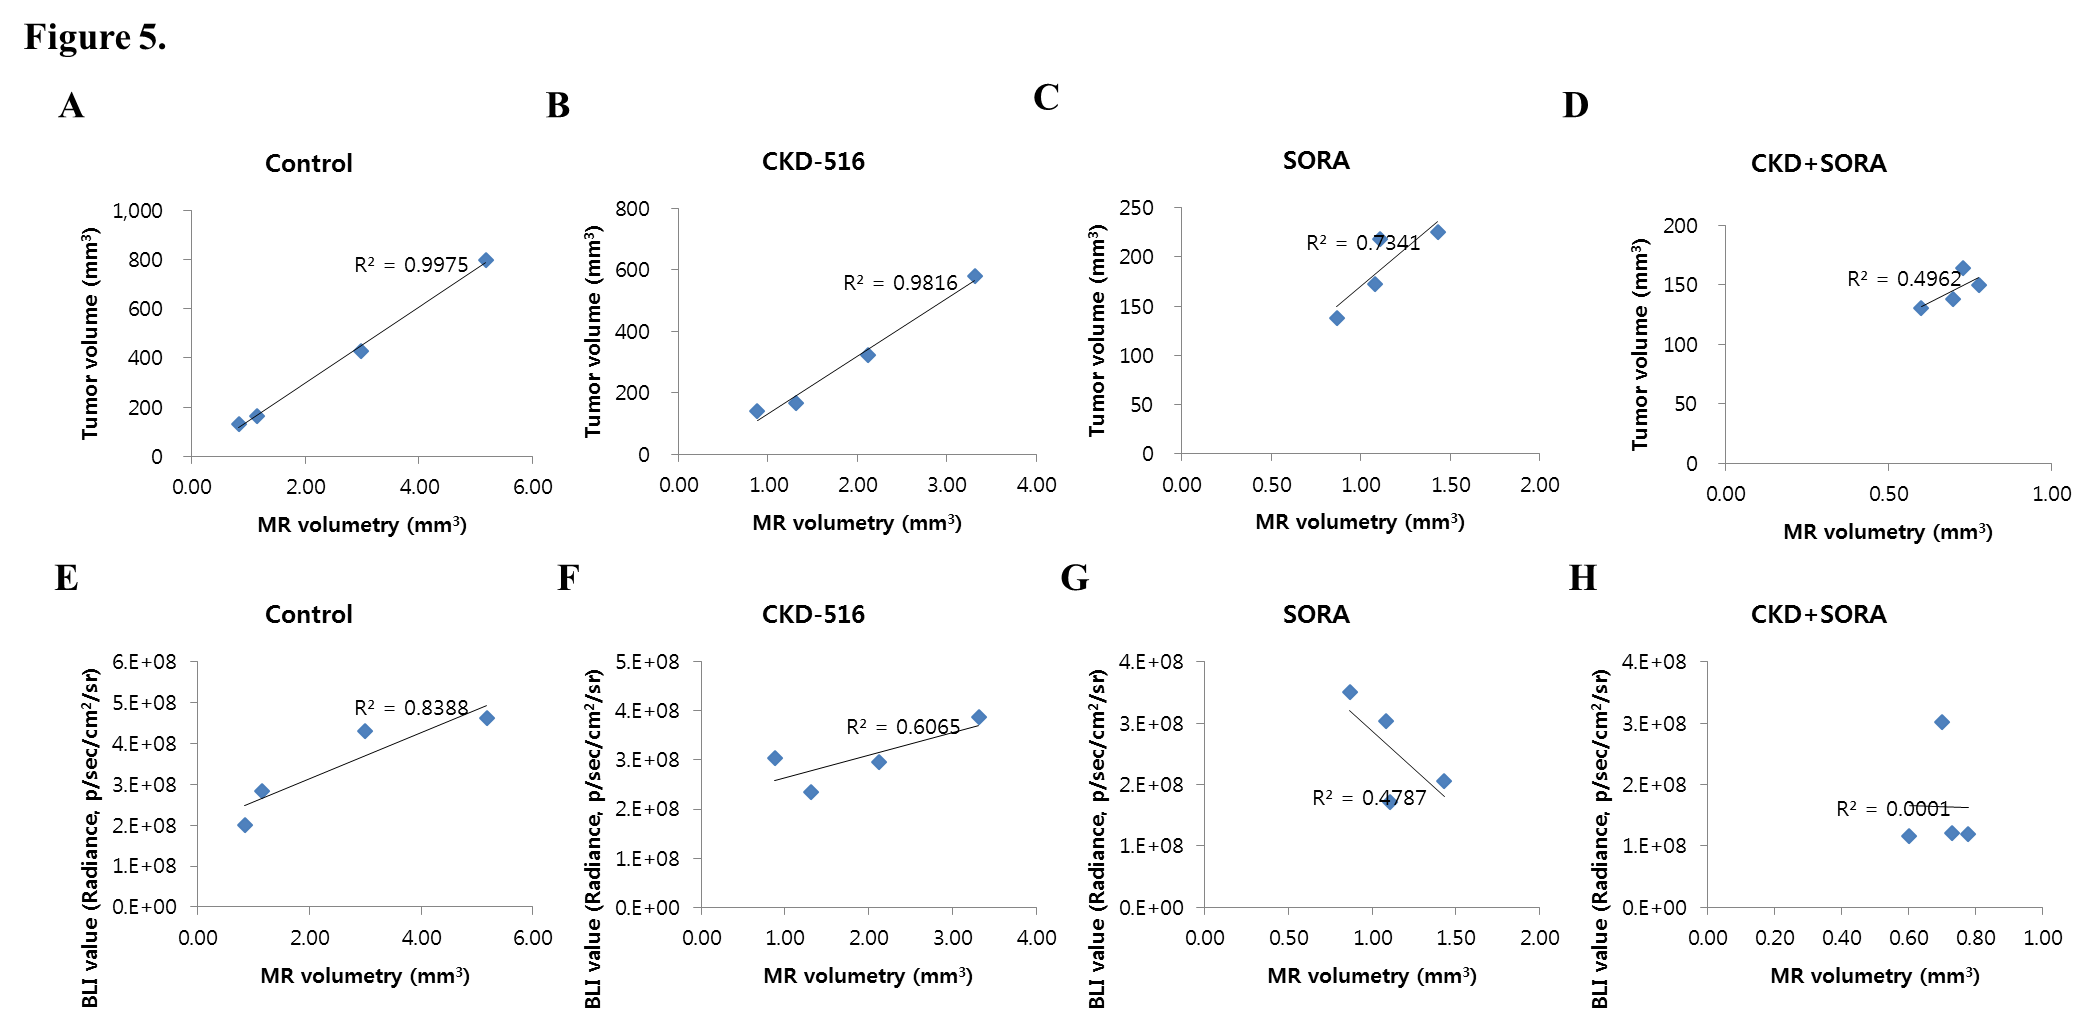
Figure 5. Correlation analysis between all groups.
(A, B, C, D) Correlation analysis between tumor volumetry by MRI and volume measurement by caliper.
(E, F, G, H) Correlation analysis between volumetry by MRI and BLI signals.