0809
Hyperpolarized 13C MRSI monitoring of response to HDAC inhibition in glioblastoma1Radiology and Biomedical Imaging, University of California San Francisco, San Francisco, CA, United States, 2Physical Therapy and Rehabilitation Science/Radiology and Biomedical Imaging, University of California San Francisco, San Francisco, CA, United States, 3Pharmaceutical Chemistry, University of California San Francisco, San Francisco, CA, United States, 4Neurological Surgery, University of California San Francisco, San Francisco, CA, United States
Synopsis
Treatment of glioblastoma (GBM) is comprised of maximum safe surgical resection, radiotherapy and chemotherapy with Temozolomide. Nonetheless, the median survival of GBM patients is only 15 months with five-year survival rate of only 5.5%. Vorinostat, the clinically relevant histone deacetylase (HDAC) inhibitor, is a novel drug that inhibits cell proliferation and induces apoptosis in solid tumors. Following Vorinostat treatment, we show a significant decrease in hyperpolarized [1-13C] lactate-to-pyruvate ratio that was associated with enhanced survival of glioblastoma-bearing mice. This highlights the potential of hyperpolarized 13C MRSI for monitoring response to a type of anticancer therapy previously unexplored in GBM patients.
Introduction
Glioblastoma (GBM) is one of the most aggressive and lethal types of brain tumor with a median survival of less than 15 months.1 Thus, novel drugs that improve the outcome of GBM patients are being considered. Vorinostat, a drug that inhibits histone deacetylases (HDACs), is now in clinical trials for GBM. However, early indicators of response are not available. Dynamic Nuclear Polarization (DNP) combined with hyperpolarized 13C Magnetic Resonance Spectroscopic Imaging (MRSI) is a promising imaging method shown to provide an early indication of tumor response following treatment with other drugs. Specifically, decreased lactate production from hyperpolarized pyruvate was detected in GBM responsive to a dual PI3K/mTOR inhibitor and to Temozolomide.2-4 The goal of this study was therefore to assess the applicability of advanced hyperpolarized 13C MRSI for monitoring HDAC inhibition in GBM.Methods
13C MRS bioreactor studies: Treated (10μM Vorinostat, 48h) and untreated U87 GBM cells were grown on beads, transferred into a bioreactor and placed in an Agilent 500MHz spectrometer. 6μl of hyperpolarized [1-13C]-pyruvate dissolved in 6mL of TRIS/EDTA buffer (pH 7.8) was then injected into the perfusion system to a final concentration of 5mM. 13C spectra were acquired using a 10mm broadband probe with 5° pulses every 3sec for 300sec (40k data points, SW=20kHz). Data was analyzed using Mnova, and kPL, the pseudo-rate constant, was determined using modified Bloch equations.
13C MRSI in vivo: For tumor implantation athymic nude mice were injected intracranially with 3x10⁵ U87 cells. Mice were treated daily p.o. with either Vorinostat (50 mg/kg) or Ora-plus (control). For MR studies animals were placed in a vertical wide-bore Agilent 600MHz scanner. Hyperpolarized [1-13C]-pyruvate was injected via i.v. tail-vein catheter over 12sec. 13C MRSI spectra were recorded 17sec after injection using 2D-CSI (TE/TR=0.58/66ms, 256, 16x16). Data was processed using Sivic.5
1H MRS of cell extracts: ~1x10⁷ untreated control or Vorinostat-treated cells were extracted using the dual-phase extraction method.6 Lyophilized aqueous phase was resuspended in 600μL of D2O and 1H MRS spectra recorded on a Bruker 500MHz spectrometer using a 90°pulse, 3sec relaxation delay, 8 dummy scans, 16K datapoints, 256 acquisitions with water pre-saturation using the ZGPR sequence.7 All studies were repeated at least three times and the significance of differences (p<0.05) was assessed using a student’s t test.
Results
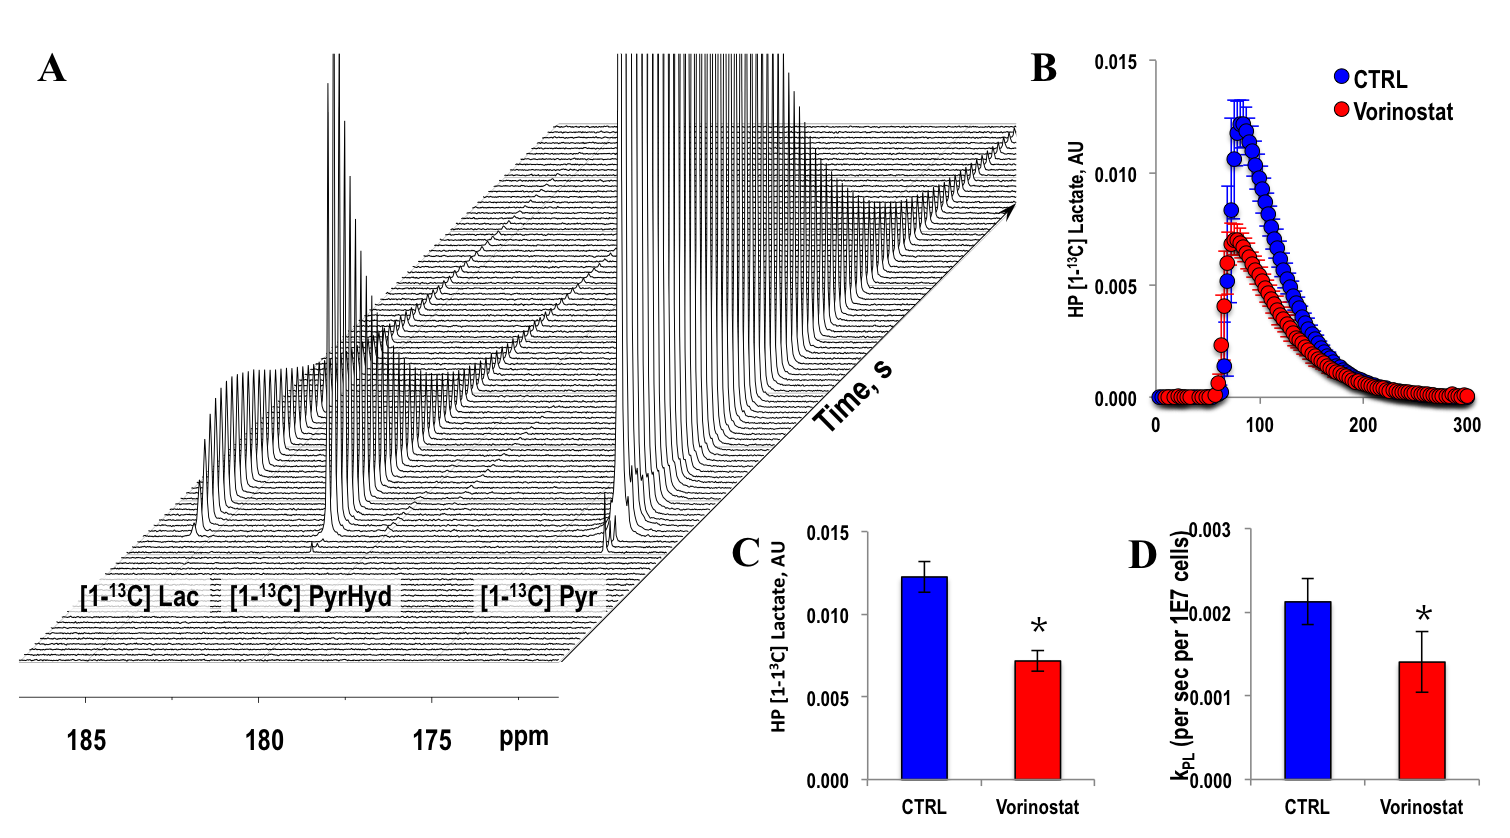
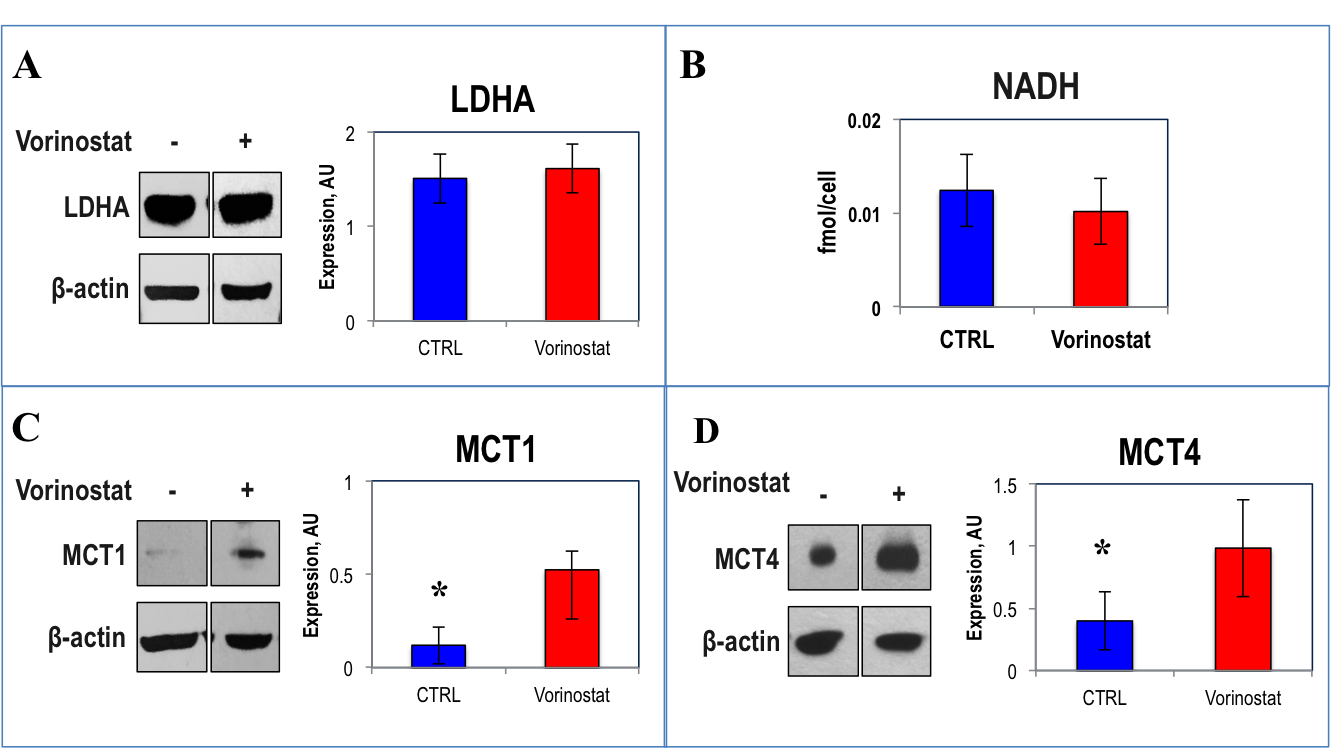
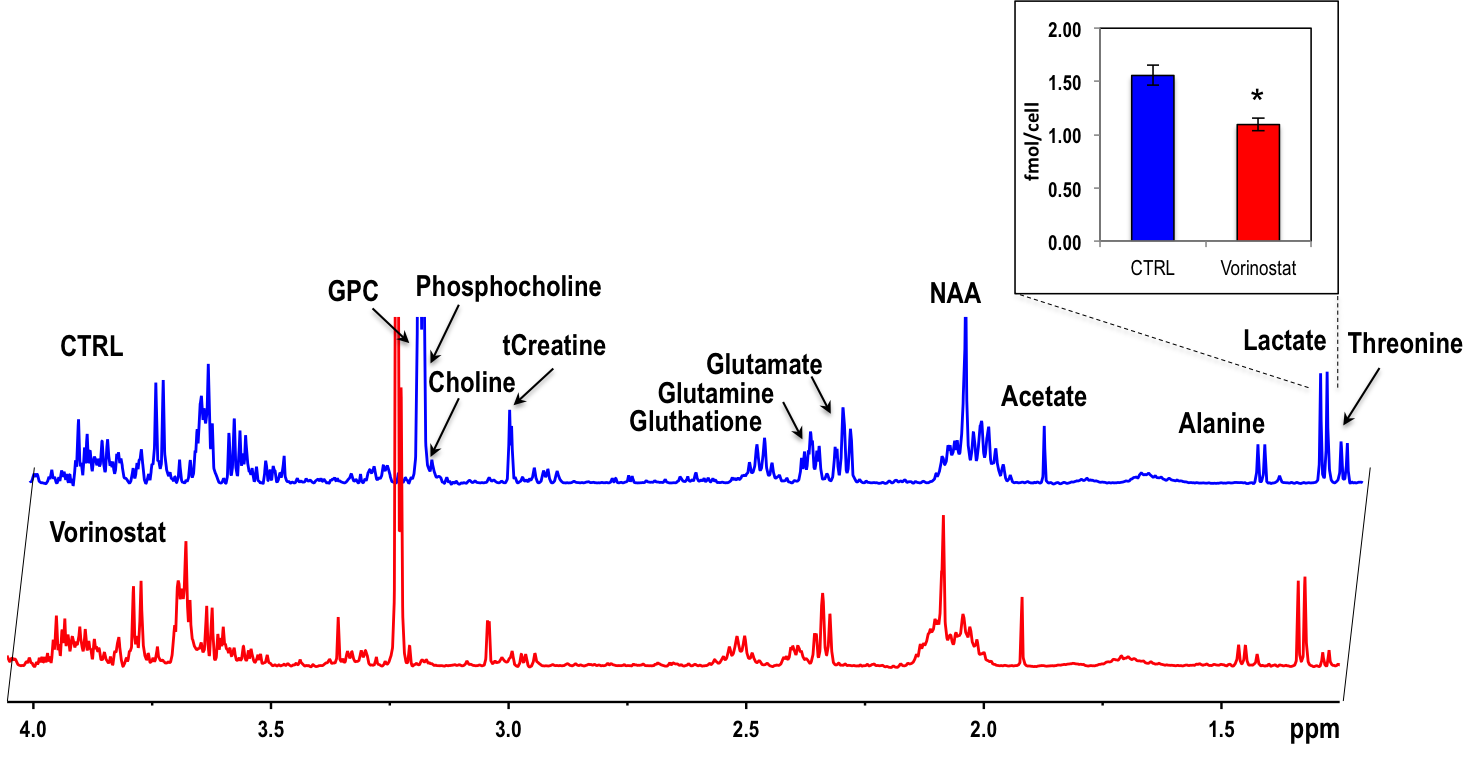
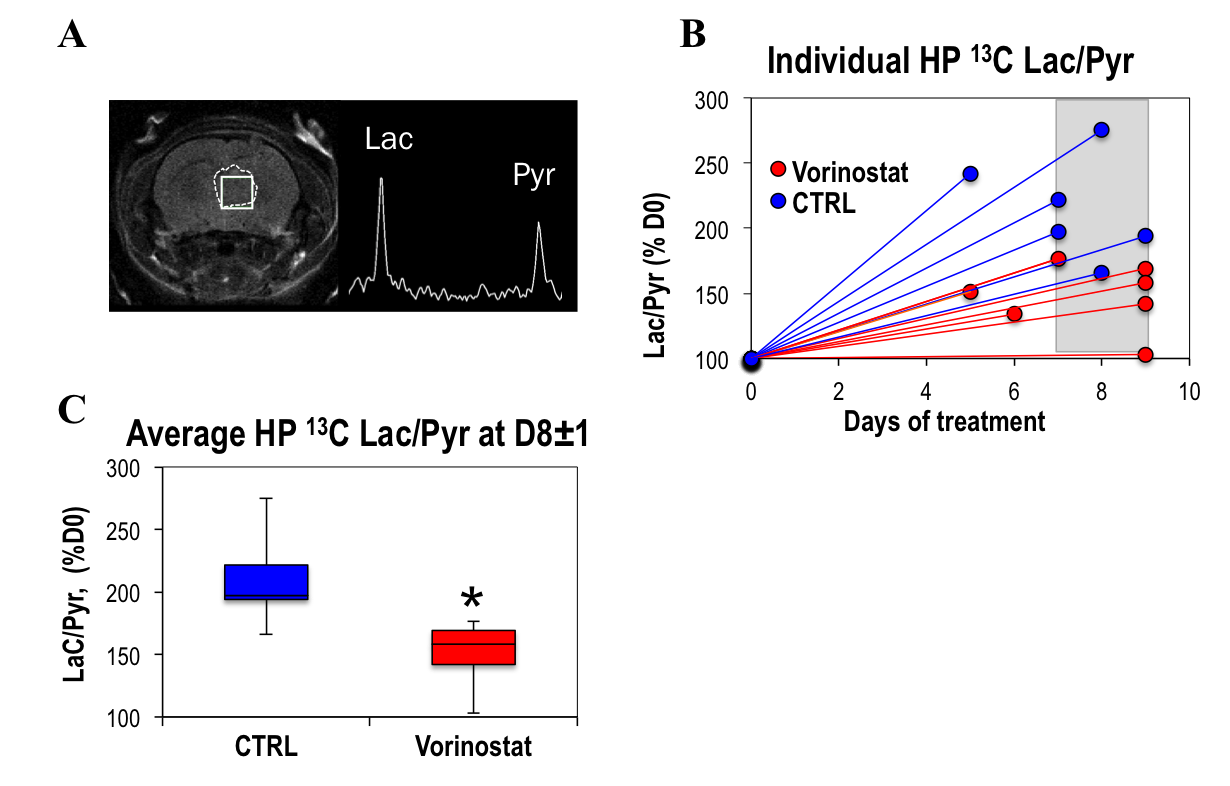
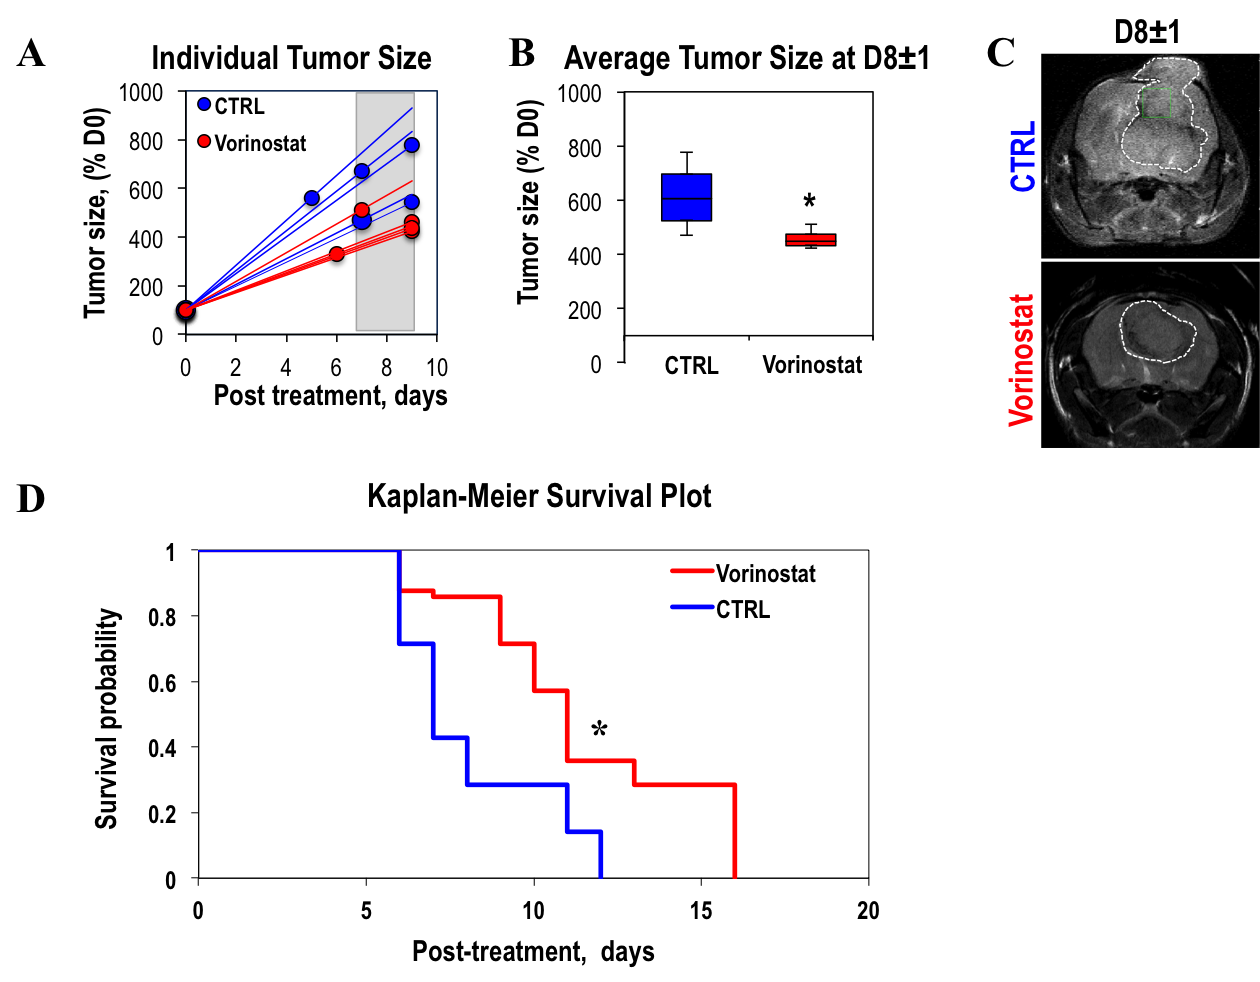
Figure 1A illustrates a typical stack plot of real-time hyperpolarized [1-13C]-pyruvate to [1-13C]-lactate conversion in live U87 control cells in a bioreactor. Comparison of the temporal evolution of hyperpolarized [1-13C]-lactate production in U87 control and Vorinostat-treated cells is illustrated in Figure 1B. Quantification of [1-13C] Lacmax/Pyrmax normalized to cell number showed a significant 41.5% decrease in Vorinostat-treated cells (Figure 1C). The pseudo-rate constant for the pyruvate-to-lactate conversion, kPL, normalized to cell number also exhibited a similar significant 34% decrease in response to Vorinostat treatment (Figure 1D). To understand the reasons for the drop in lactate production, we assessed the main parameters that can affect the pyruvate-to-lactate interconversion. Expression of LDHA, the enzyme that catalyzes pyruvate-to-lactate conversion (Figure 2A), and the concentration of NADH, the co-factor for the reaction (Figure 2B), were independent of Vorinostat treatment. In contrast, intracellular lactate levels, which can also affect the interconversion, showed a significant 30% decrease in Vorinostat-treated cells (Figure 3). This was associated with increased expression of MCT1 (Figure 2C) and MCT4 (Figure 2D), the transporters that shuttle lactate in and out of the cell, by 338% and 147%, respectively. Finally, we conducted 13C MRSI in vivo studies. As in the cell studies we observed a significant 30% decrease in hyperpolarized lactate-to-pyruvate ratio in Vorinostat-treated U87-bearing mice when compared to controls following 8 days of treatment (D8) (Figure 4). Importantly, although both control and treated tumors continued to grow, the metabolic change was associated with a significant 28% smaller tumor volume in Vorinostat-treated tumors compared to controls (Figure 5A-C) and this led to a significantly enhanced animal survival (Figure 5D).Conclusions
We thus propose that following Vorinostat treatment, increased expression of MCT1 and MCT4 leads to a decrease in intracellular lactate levels, which in turn leads to a reduction in the pyruvate-to-lactate conversion. Importantly, our in vivo studies show that the metabolic changes predict enhanced survival that could not be anticipated by simply monitoring tumor size. The clinical potential of hyperpolarized 13C MRSI has been demonstrated in first-in-human clinical trials and is currently in use in GBM patients.8, 9 Our findings thus point to the potential value of the hyperpolarized lactate-to-pyruvate ratio as a biomarker for noninvasively assessing the early effects of Vorinostat in GBM patients.Acknowledgements
NIH P01CA118816, P41EB013598References
1. Ostrom, Q.T. et al. CBTRUS Statistical Report: Primary Brain and Other Central Nervous System Tumors Diagnosed in the United States in 2009–2013. Neuro Oncol. 2016;18.
2. Radoul, M. et al. MR Studies of Glioblastoma Models Treated with Dual PI3K/mTOR Inhibitor and Temozolomide:Metabolic Changes Are Associated with Enhanced Survival. Mol Cancer Ther. 2016;15,1113-1122.
3. Chaumeil, M.M. et al. Hyperpolarized 13C MR spectroscopic imaging can be used to monitor Everolimus treatment in vivo in an orthotopic rodent model of glioblastoma. Neuroimage. 2012;59,193-201.
4. Park, I. et al. Changes in Pyruvate Metabolism Detected by Magnetic Resonance Imaging Are Linked to DNA Damage and Serve as a Sensor of Temozolomide Response in Glioblastoma Cells. Cancer Res. 2014;74(23):7115-24.
5. Crane, J.C., et al. SIVIC: Open-Source, Standards-Based Software for DICOM MR Spectroscopy Workflows. Int J Biomed Imaging. 2013.
6. Tyagi, R.K., et al. Simultaneous extraction of cellular lipids and water-soluble metabolites: evaluation by NMR spectroscopy. Magn Reson Med. 1996;35,194–200.
7. Wider, G. & Dreier, L. Measuring protein concentrations by NMR spectroscopy. JACS. 2006;128,2571-2576.
8. Nelson, S.J. et al. Metabolic Imaging of Patients with Prostate Cancer Using Hyperpolarized [1-13C]Pyruvate. Science Translational Medicine. 2013;5,198.
9. Park, I. et al. Dynamic Hyperpolarized 13C Metabolic Imaging of Patients with Brain Tumors. ISMRM 0555. 2017.
Figures