0808
Amide chemical exchange saturation transfer at 7T: A possible biomarker for detecting early response to neoadjuvant chemotherapy in breast cancer patients1Radiology, UMC Utrecht, Utrecht, Netherlands, 2Max Planck Institute for Biological Cybernetics, Tübingen, Germany, 3Medical Oncology, Academic Medical Centre Amsterdam, Amsterdam, Netherlands, 4Pathology, UMC Utrecht, Utrecht, Netherlands
Synopsis
Neoadjuvant chemotherapy (NAC) has an important role in the treatment of breast cancer and the need for early detection of treatment response is high. Therefore we investigated the feasibility of using APT CEST at 7T as a biomarker for this purpose. Ten lesions were included and APT signal before and after the first cycle of NAC were correlated to the pathological response. Significant differences were found in APT signal corresponding with the pathological response. These results suggest that APT CEST may be used to predict the response to NAC treatment in an early stage.
Introduction
Neoadjuvant chemotherapy (NAC) has an important role in the treatment of breast cancer. NAC is a systemic therapy that downstages cancer, enabling breast conserving surgery and reducing axillary treatment (1–4). Unfortunately, patients undergoing the treatment may experience severe side effects and in ~20% of patients treatment may turn out to be ineffective in the end (5,6). For these patients it would be beneficial to predict the pathological response early on in the course of treatment, to properly adjust the treatment for every patient individually.
Therefore we set out to investigate non-invasive early detection of treatment response of breast cancer patients to NAC using chemical exchange saturation transfer (CEST) measurements sensitive to amide proton transfer (APT) at 7 tesla (7T).
Methods and Materials
All patients were scanned in a prone position on a 7T MR system (Philips, Cleveland, OH, USA). Six patients were scanned with a 26-channel bilateral breast coil (MR Coils, Zaltbommel, The Netherlands) (7) and three patients were scanned with a 2-channel unilateral 1H/31P dual-tuned coil (MR Coils, Zaltbommel, The Netherlands) (8). Image based third order B0 shimming was performed (9).
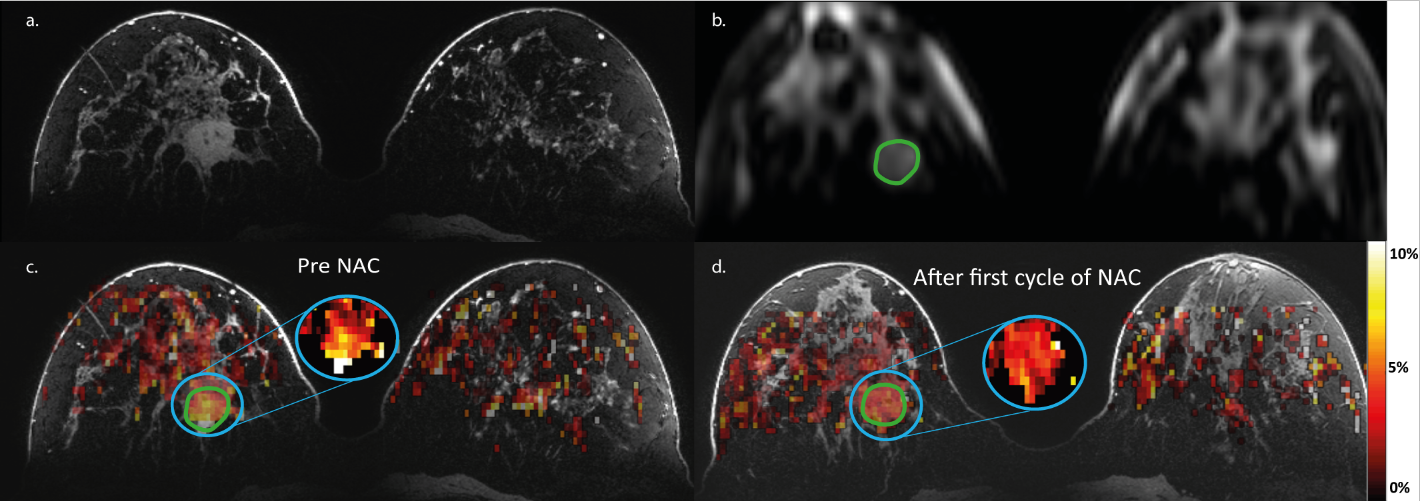
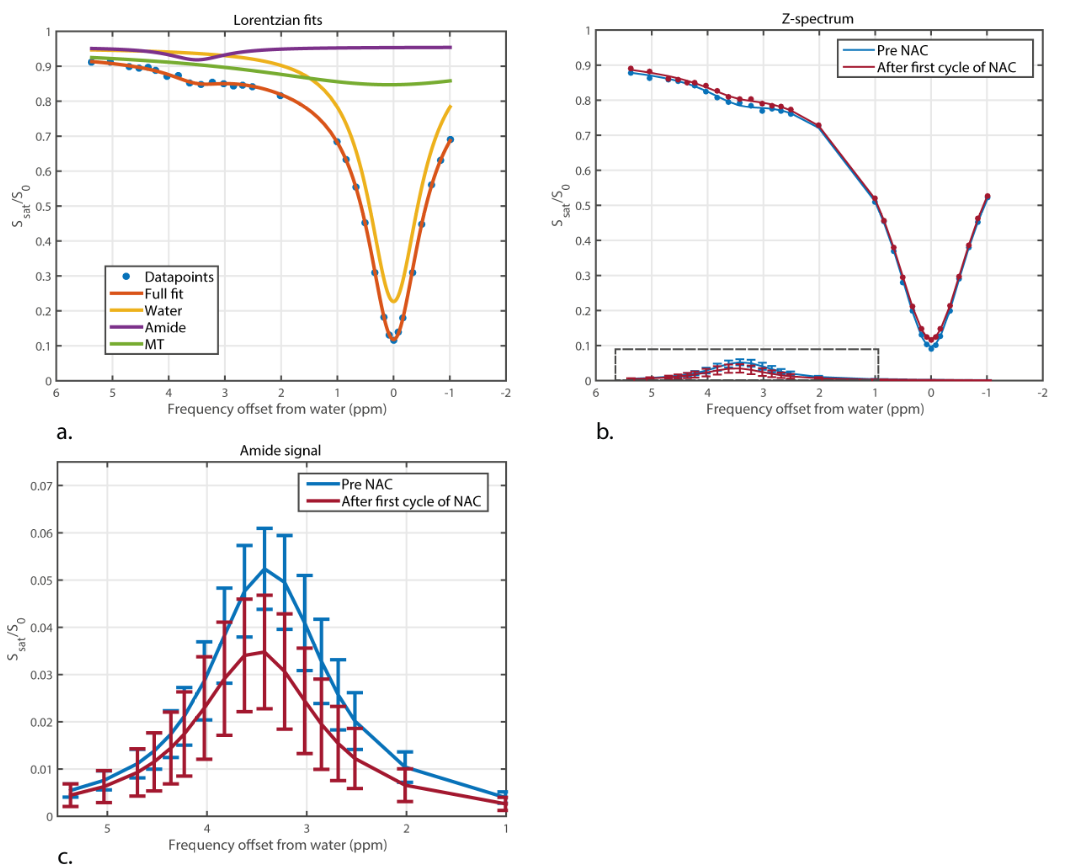
CEST-MRI was performed using a series of 20 sinc-Gauss radiofrequency pulses (pulse duration: 100msec; inter pulse delay: 100msec; peak amplitude B1≈2 µT) resulting in a 4s saturation train (50% duty cycle) followed by a gradient-echo readout (10). Image acquisition included fat suppression with a short 1-2-1 spectral-spatial RF pulse to allow for a short TE of 1.4msec, TR of 2.6msec and a flip angle of 1.2°. A field of view of 320x150x100mm3 with a true resolution of 2.3x3.0x6.8mm3 was obtained in 2 shots of 394msec with a 4 fold SENSE in right-left direction. 32 frequency offsets were acquired resulting in a scan time of 5min30sec. The frequency offsets associated with the nuclear Overhauser effect were not included due to signal distortions by not fully suppressed lipid resonances. CEST images were B0 corrected using the WASSR method (14). A region of interest was drawn in the tumor using the last offset (33.6ppm) of the CEST series. To guide this process, DCE images of the same scan session were used (Figure 2a,b). The z-spectra were fitted using a three-pool Lorentzian model (water, APT and magnetization transfer) (15,16). The pathological response (Miller-Payne (11)) in the resection regiment was used as gold standard.
Statistical analysis
Statistical analysis was performed using Graphpad Prism software (Graphpad, San Diego, CA, USA) by an unpaired Mann-Whitney test, with a two-tailed distribution to show statistical difference (α=0.05) between the APT signal before and after the first cycle of NAC. A Kruskal Wallis test with a post-hoc Dunn’s multiple comparison test was used to assess statistical difference in APT signal between the groups with different pathological responses. To test if the difference of proportions is significant, the Fisher-Freeman-Halton exact test was performed.
Results
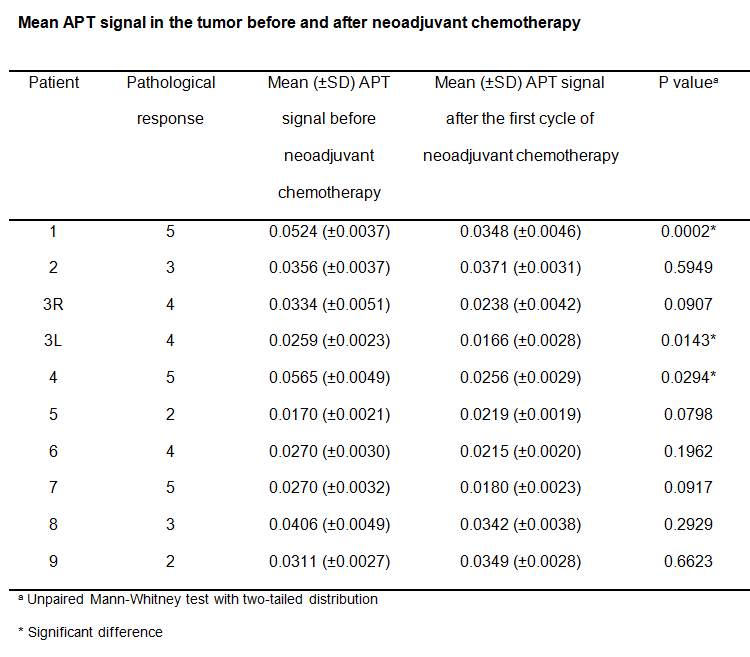
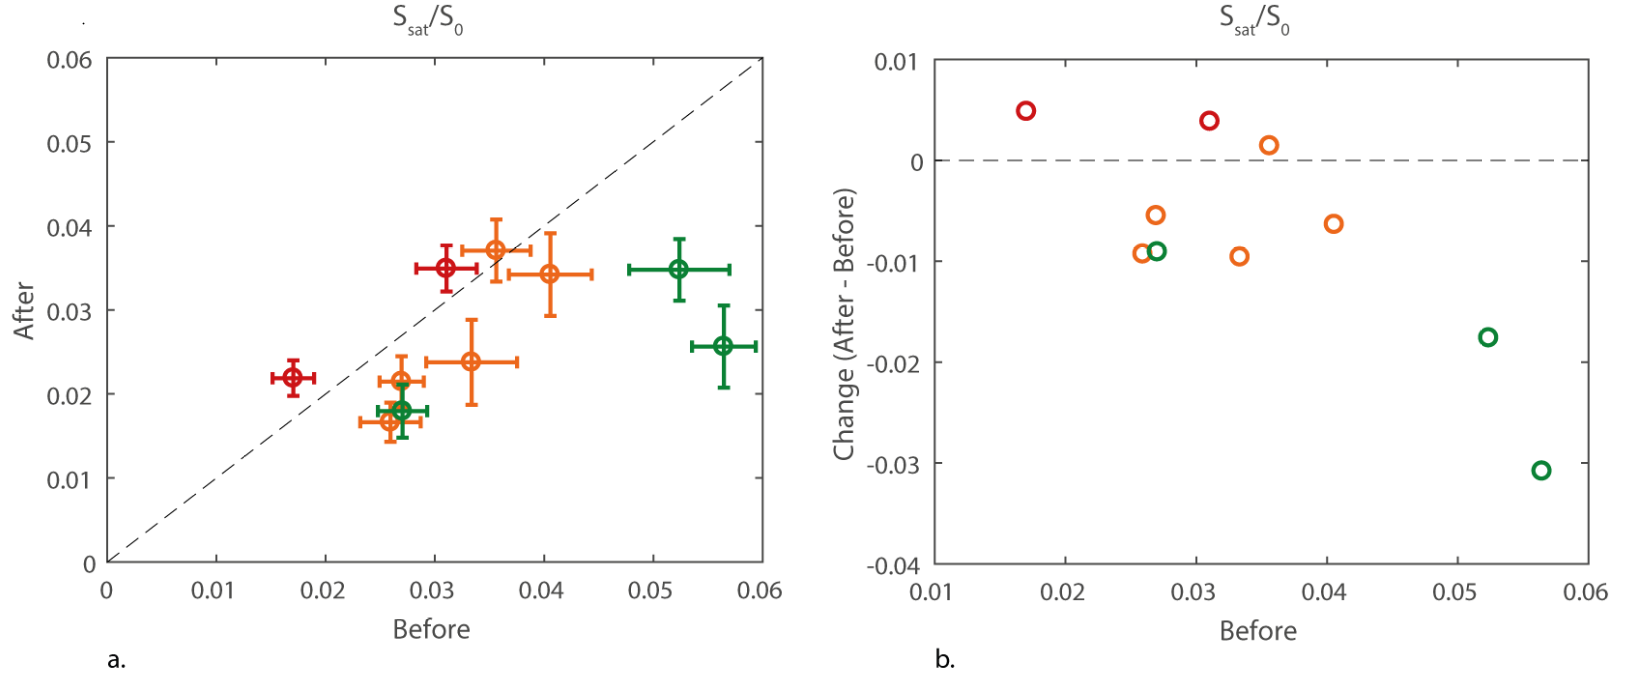
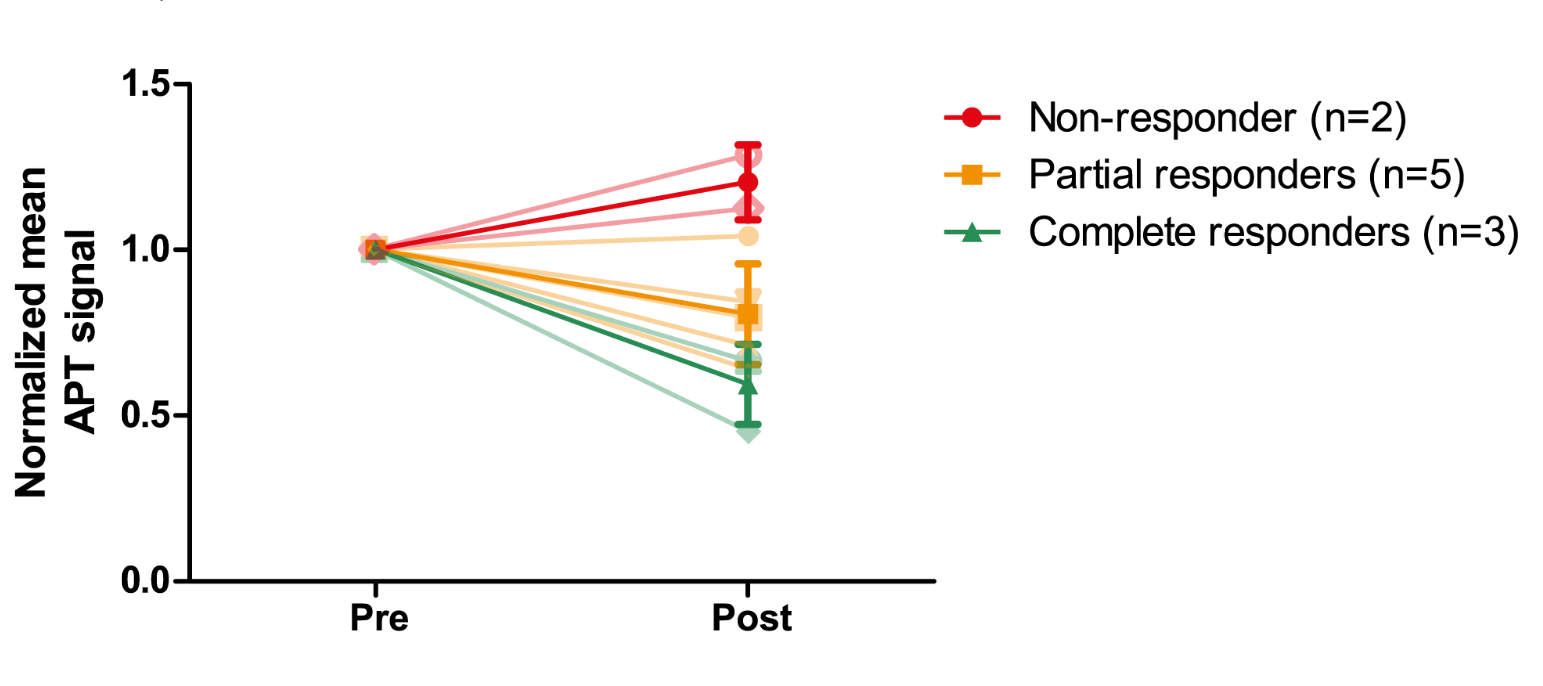
Significant differences were found in APT signal before and after the first cycle of NAC in 3 out of 10 lesions of which two showed a pathological complete response (Figure 1). The procedure of drawing the ROI in the tumor and a calculated APT map can be seen in Figure 2 with corresponding z-spectrum and three-pool Lorentzian fit in Figure 3. The mean APT signal and standard deviation within the ROI (tumor) for all ten lesions, with the different pathological responses is shown in Figure 4. Figure 5 shows the normalized change in APT signal after the first cycle of neoadjuvant chemotherapy in all ten lesions. Delta APT signal was significantly different in non-responders compared to complete responders (P<0.05, Kruskal-Wallis test), yet no clear distinction could be made between the different pathological responses (P=0.333, Fisher-Freeman-Halton exact).Discussion and conclusion
Significant differences in the APT CEST signal were observed in three of ten breast tumors and a distinction could be made between the complete responders and non-responders based on the change of APT signal between before and after the first cycle of NAC. We did not yet correct for B1+ inhomogeneity but recently proposed correction methods (12–14) could even further improve the CEST images. Already in a small group of breast cancer patients, this study shows potential of using APT CEST at 7T as a non-invasive biomarker to predict the effect of neoadjuvant chemotherapy in an early stage of treatment. This can be useful in personalized cancer treatment planning and is an important milestone worth spreading to stimulate more studies of APT as a biomarker.Acknowledgements
We would like to thank the Dutch Cancer Society (Alpe d’Huzes project nr: UU 2013-6302) and the NWO (VENI grant: J.P.Wijnen 016.148.002) for financial support.References
1. Loibl S, Minckwitz G Von, Blohmer J, et al. Surgical Procedures After Neoadjuvant Chemotherapy in Operable Breast Cancer : Results of the GEPARDUO Trial. Ann Surg Oncol. 2006;13(11):1434–1442.
2. Kaufmann M, Hortobagyi GN, Goldhirsch A, et al. Recommendations From an International Expert Panel on the Use of Neoadjuvant ( Primary ) Systemic Treatment of Operable Breast Cancer : An Update. J Clin Oncol. 2006;24(12):1940–1949.
3. Kaufmann M, Minckwitz G Von, Bear HD, et al. Recommendations from an international expert panel on the use of neoadjuvant ( primary ) systemic treatment of operable breast cancer : new perspectives 2006. Ann Oncol. 2007;18(11):1927–1934.
4. Kaufmann M, Minckwitz G Von, Mamounas EP, et al. Recommendations from an International Consensus Conference on the Current Status and Future of Neoadjuvant Systemic Therapy in Primary Breast Cancer. Ann Surg Oncol. 2011;19:1508–1516.
5. Fisher B, Brown A, Mamounas E, et al. Effect of preoperative chemotherapy on local-regional disease in women with operable breast cancer: findings from National Surgical Adjuvant Breast and Bowel Project B-18. J Clin Oncol. 1997;15(7):2483–2493.
6. Bonadonna G, Valagussa P, Zucali R, Salvadori B. Primary Chemotherapy in Surgically Resectable Breast Cancer. CA Cancer J Clin. 1995;45(4):227–243.
7. Van Der Velden TA, Italiaander M, Van Der Kemp WJM, et al. Radiofrequency configuration to facilitate bilateral breast 31P MR spectroscopic imaging and high-resolution MRI at 7 Tesla. Magn Reson Med. 2015;74(6):1803–1810.
8. Klomp DWJ, van der Kemp WJM, Korteweg M, Wijnen JP, Bosch M Van De, Luijten PR. P MRS at 7T can be more sensitive and specific than 1 H MRS in monitoring breast cancer treatment . Proc Intl Soc Mag Reson Med. 2011;19:343.
9. Hancu I, Govenkar A, Lenkinski RE, Lee SK. On shimming approaches in 3T breast MRI. Magn Reson Med. 2013;69(3):862–867.
10. Khlebnikov V, Geades N, Klomp DWJ, Hoogduin H, Gowland P, Mougin O. Comparison of Pulsed Three-Dimensional CEST Acquisition Schemes at 7 Tesla : Steady State Versus Pseudosteady State. Magn Reson Med. 2017;77:2280–2287.
11. Ogston KN, Miller ID, Payne S, et al. A new histological grading system to assess response of breast cancers to primary chemotherapy : prognostic significance and survival. Breast. 2003;12:320–327.
12. Windschuh J, Zaiss M, Meissner J, et al. Correction of B 1-inhomogeneities for relaxation-compensated CEST imaging at 7T. NMR Biomed. 2015;28:529–537.
13. Singh A, Cai K, Haris M, Hariharan H. On B1 Inhomogeneity Correction of In Vivo Human Brain Glutamate Chemical Exchange Saturation Transfer Contrast at 7T. Magn Reson Imaging. 2013;69:818–824.
14. Khlebnikov V, Windschuh J, Siero JCW, et al. On the transmit field inhomogeneity correction of relaxation‐compensated amide and NOE CEST effects at 7 T. NMR Biomed. 2017;30:e3687.
Figures