0807
Hyperpolarized-13C Imaging of Treatment Responses on Prostate Cancer Patients using 3D Dynamic CS-EPSI Techniques1Radiology and Biomedical Imaging, University of California, San Francisco, San Francisco, CA, United States, 2Department of Clinical Pharmacy, University of California, San Francisco, San Francisco, CA, United States, 3School of Medicine, University of California, San Francisco, San Francisco, CA, United States
Synopsis
Two unmet clinical needs facing the management of prostate cancer are to determine the best treatment for individual patients and to evaluate therapy response. In this study, we applied 3D dynamic imaging technique using hyperpolarized 13C nuclei to non-invasively probe prostate cancer metabolism. Pyruvate-to-lactate conversion kPL correlated well with biopsy and histological finding in pre-surgery prostate cancer patients. kPL values dramatically decreased in a patient 6 weeks into androgen-deprivation therapy with associated PSA decrease, indicating early treatment response. A non-responder patient with castration-resistant cancer exhibited high kPL one month after treatment that correlated with clinical progression.
Introduction
Prostate cancer is the second most deadly cancer in US men1. Two major challenges remain in the clinical management of prostate cancer. The first is to help the patients, at the time of diagnosis, differentiate indolent from aggressive disease and determine optimal treatment. Secondly, it is as important to evaluate treatment effectiveness2,3. Hyperpolarized 13C MRI is a new safe, non-radioactive molecular imaging technique that enables monitoring of cancer metabolic pathways4,5. The dissolution DNP process provides a 50,000 fold SNR increase of 13C nuclei6,7. In this work, we investigated the metabolic changes of human prostate cancer longitudinally, both before and after treatment. A case of non-responder to androgen deprivation therapy (ADT) was also presented.Methods
Sequences: A 3D dynamic compressed-sensing EPSI (3D CS-EPSI) sequence was developed and translated to provide full coverage of the human prostate gland with 8x8x8mm isotropic resolution (0.5cc voxel)8,9 using a clamshell volume coil for RF transmit and endorectal coil for reception. A variable RF flip angle scheme was designed to provide constant pyruvate while maximizing lactate signal10. The RF pulses also featured reduced peak power and B1+ insensitivity for reliability in patient studies11. Some sequence parameters include: TE/TR = 4.0/150ms, temporal resolution = 2s, FOV = 9.6x9.6x12.8cm. The exams included the standard multiparametric-MRI protocol with T2-weighted images for anatomic reference12.
HP-13C MRI experiments: Following polarization in a 5T Spinlab polarizer for 2.5-3 hours, dissolutions yielded 235±15 mM sterile pyruvate with 41±6% polarization, 0.8±0.3uM radical and 32.1±0.6°C temperature that met all safety and sterility criteria prior to pharmacist release. The bolus was delivered through the antecubital vein with 0.43ml/kg dosage and injection rate of 5ml/s. All human studies were approved by the Internal Review Board at UCSF.
Results and Discussions
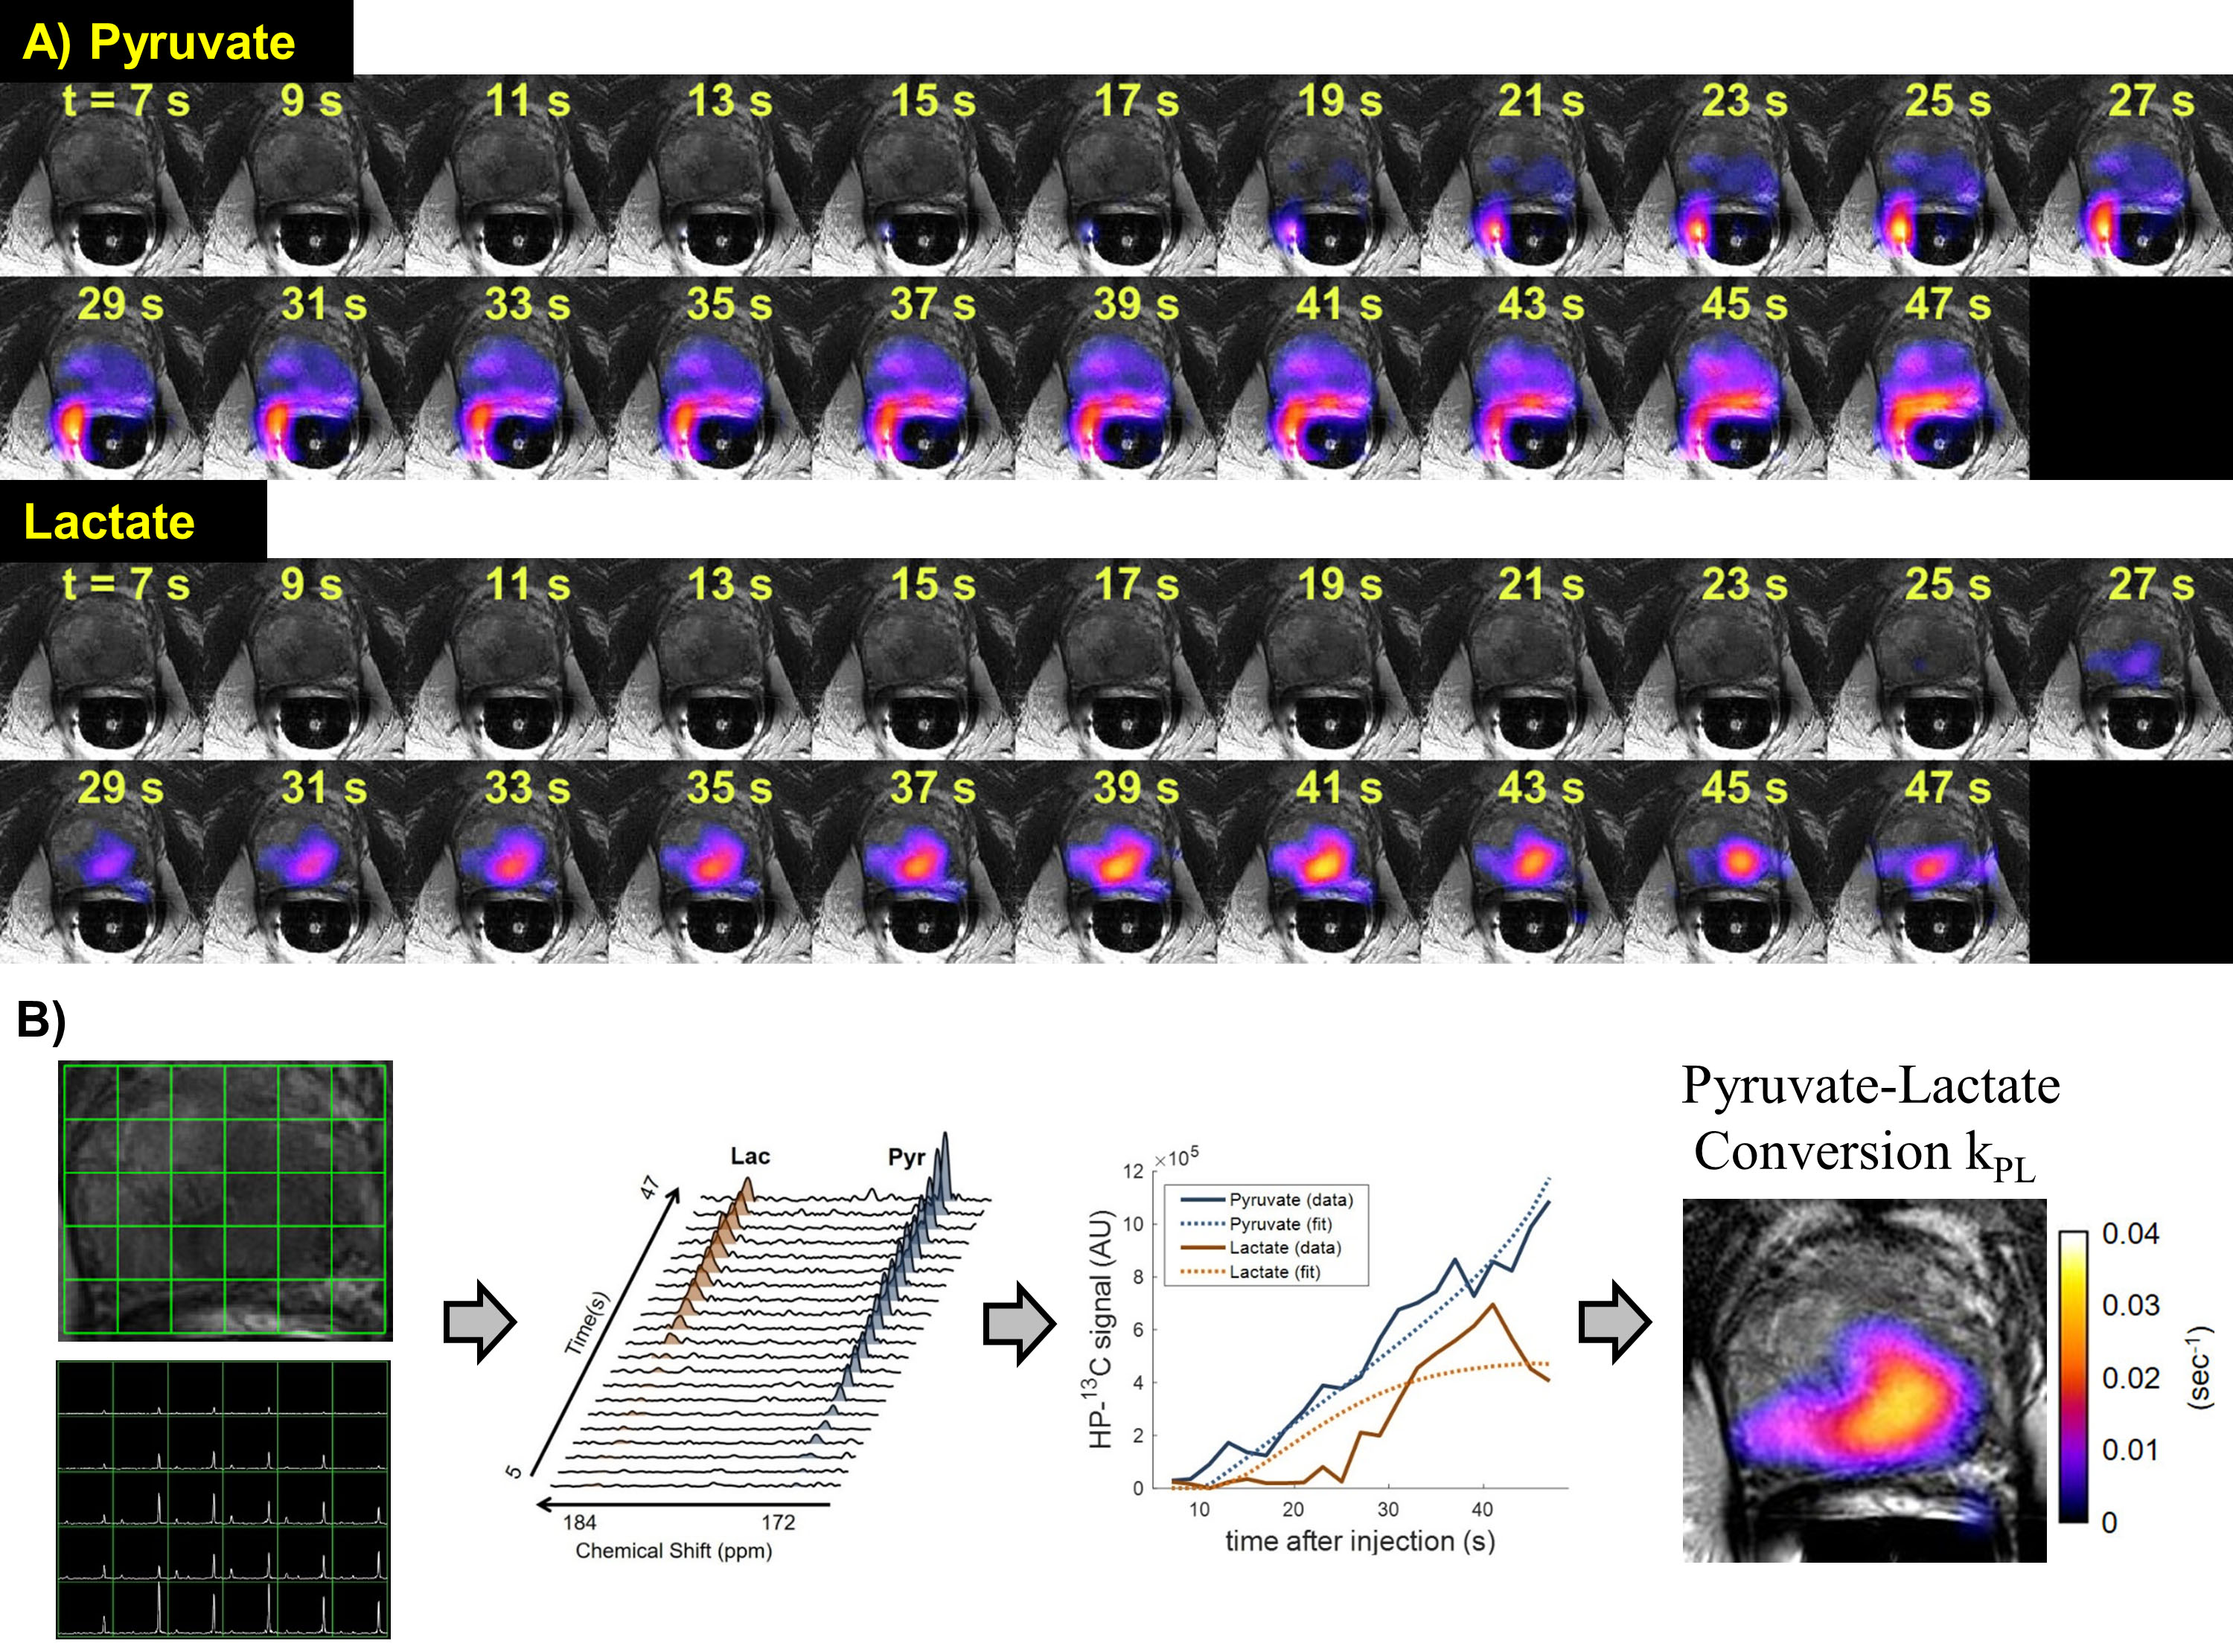
The first patient presented with biopsy-proven prostate cancer of Gleason score 4+5, 4+4 and 4+3 involving the majority of the left lobe, extending into the right peripheral zone with MR stage T3b and a PI-RADs score of 5. The 3D dynamic CS-EPSI sequence provided coverage of the entire prostate gland base to apex with 8mm isotropic resolution (Fig.1A). The HP-13C pyruvate bolus arrived at the vasculature around rectum, and into the prostate ~20 seconds after the end of injection. Spectroscopy data was extracted from each voxel, and pyruvate-lactate conversion rate kPL was evaluated based on two-site exchange model fit. kPL was found to be 0.02-0.04s-1 in regions of cancer (Fig.1B).
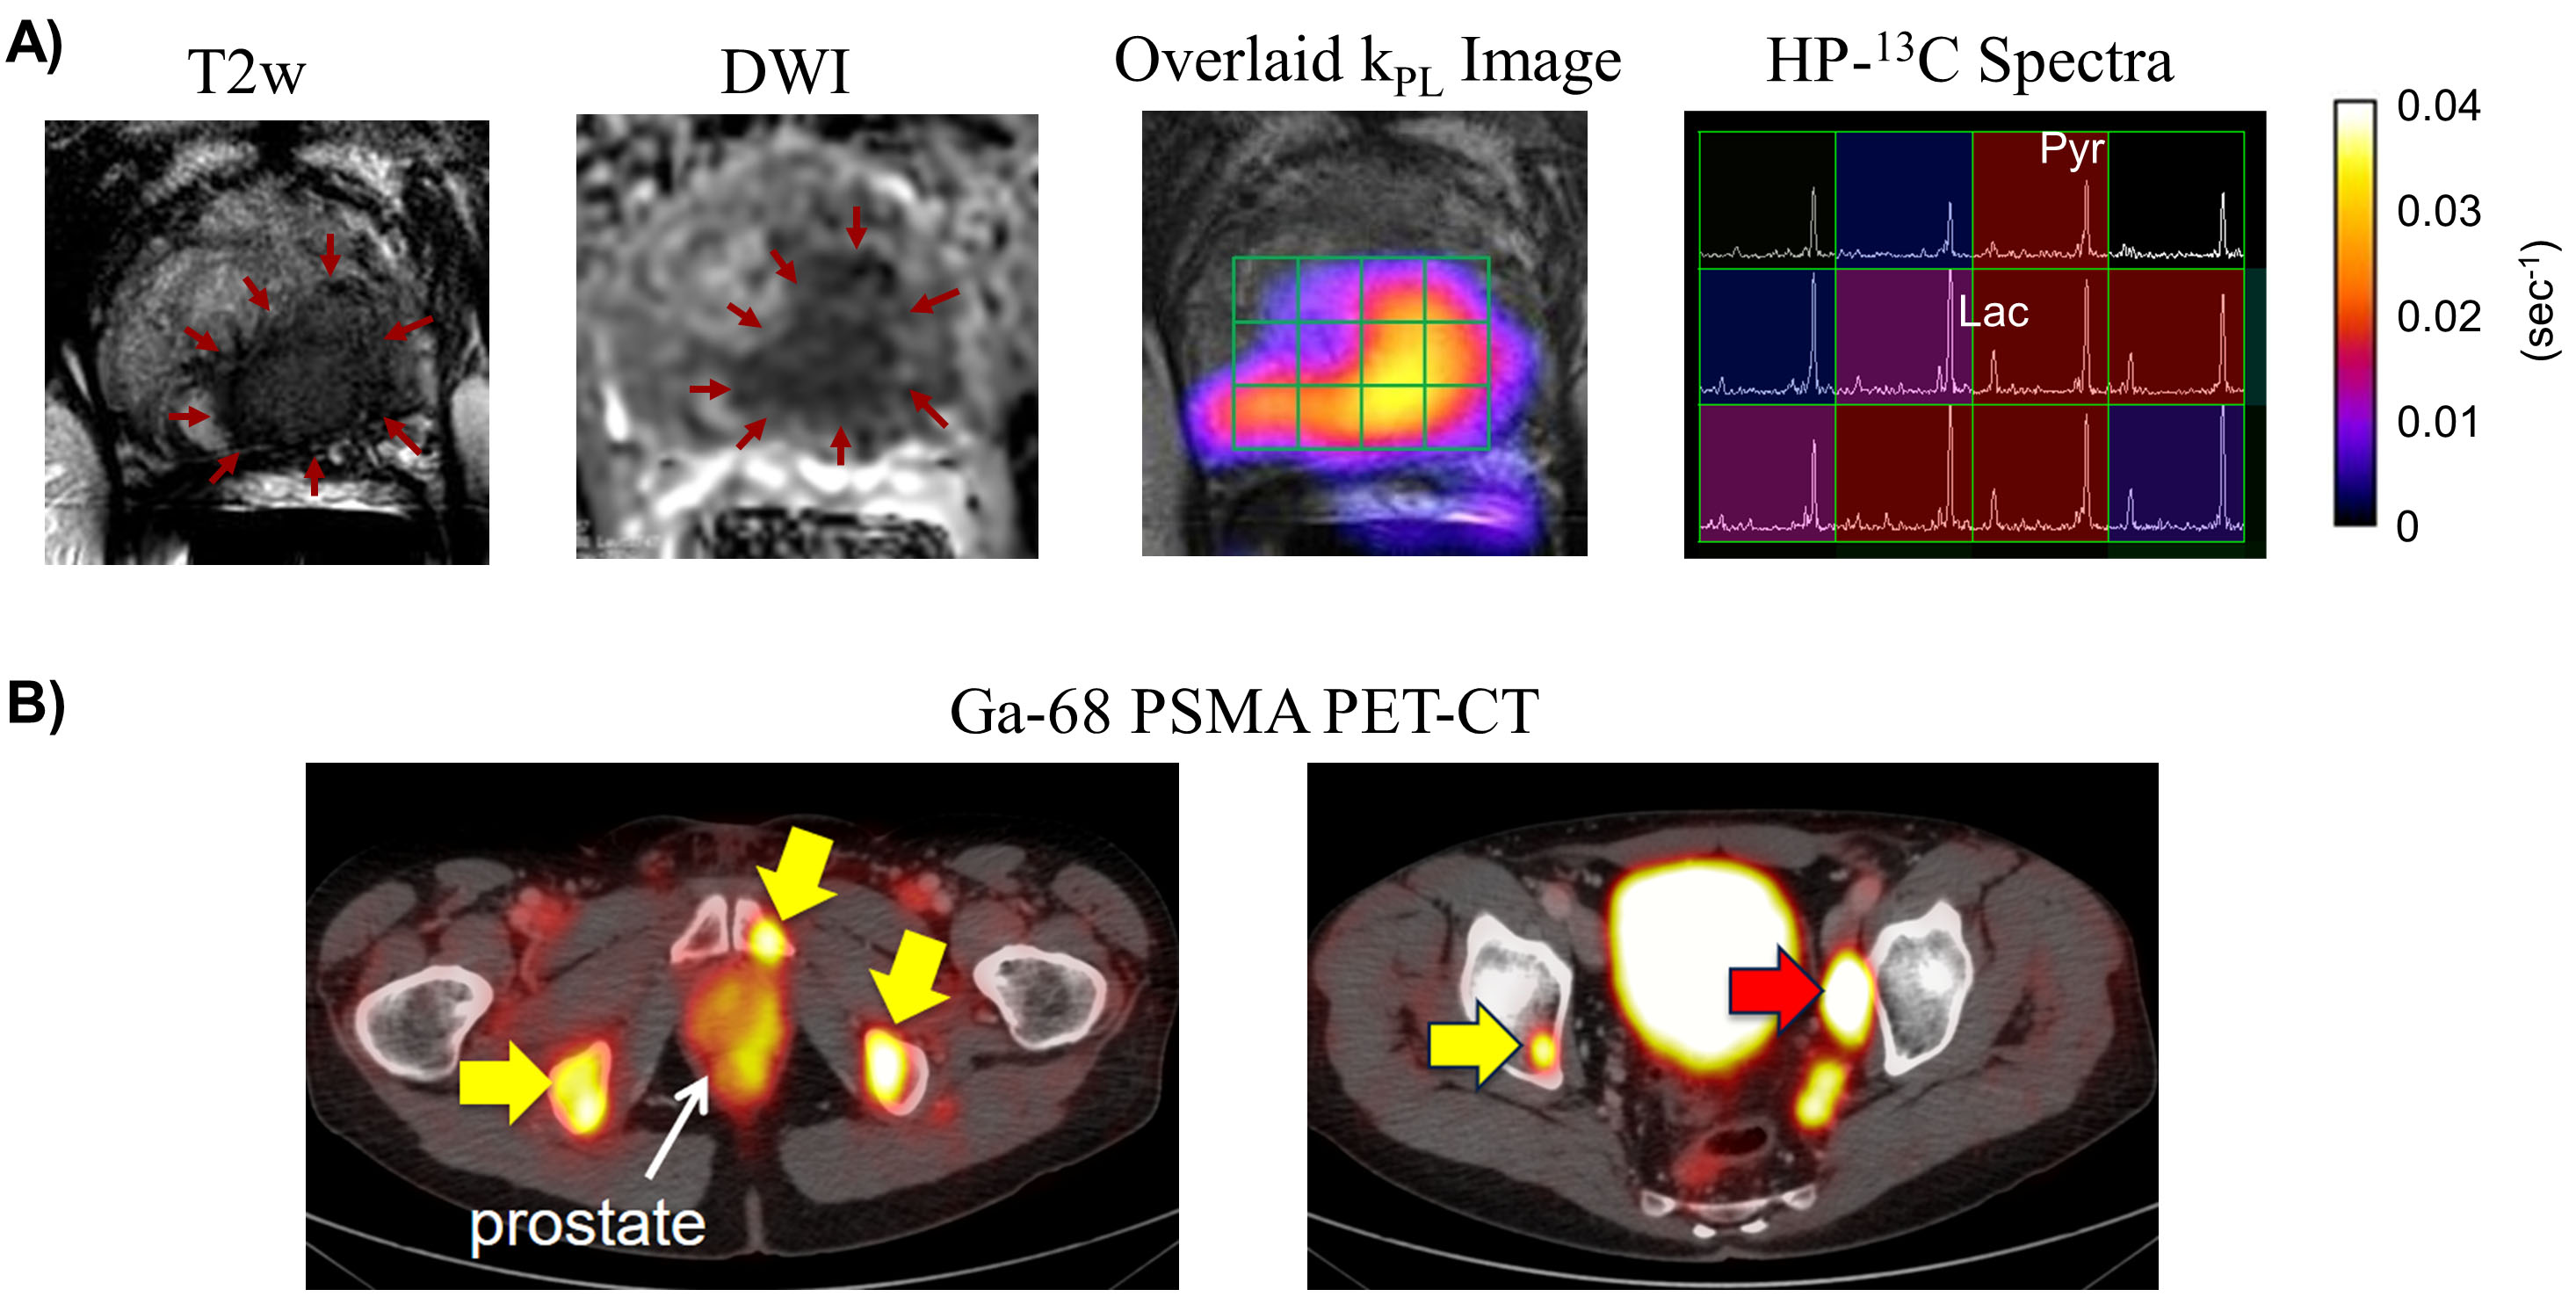
High kPL was found at regions that correlated with biopsy finding of the cancer, and lesion on the T2w images as a well-defined lesion of low signal intensity, and also regions with restricted diffusion on high b-value ADC maps (Fig.2A). Ga-68 PSMA PET-CT images were acquired at the time of mp-MRI studies (Fig.2B), showing lymph node and bone metastases (red and yellow arrows). The HP-13C MRI and PET-CT provides complementary information where the former shows the metabolism in primary prostate cancer, whereas the latter picks up metastasis.
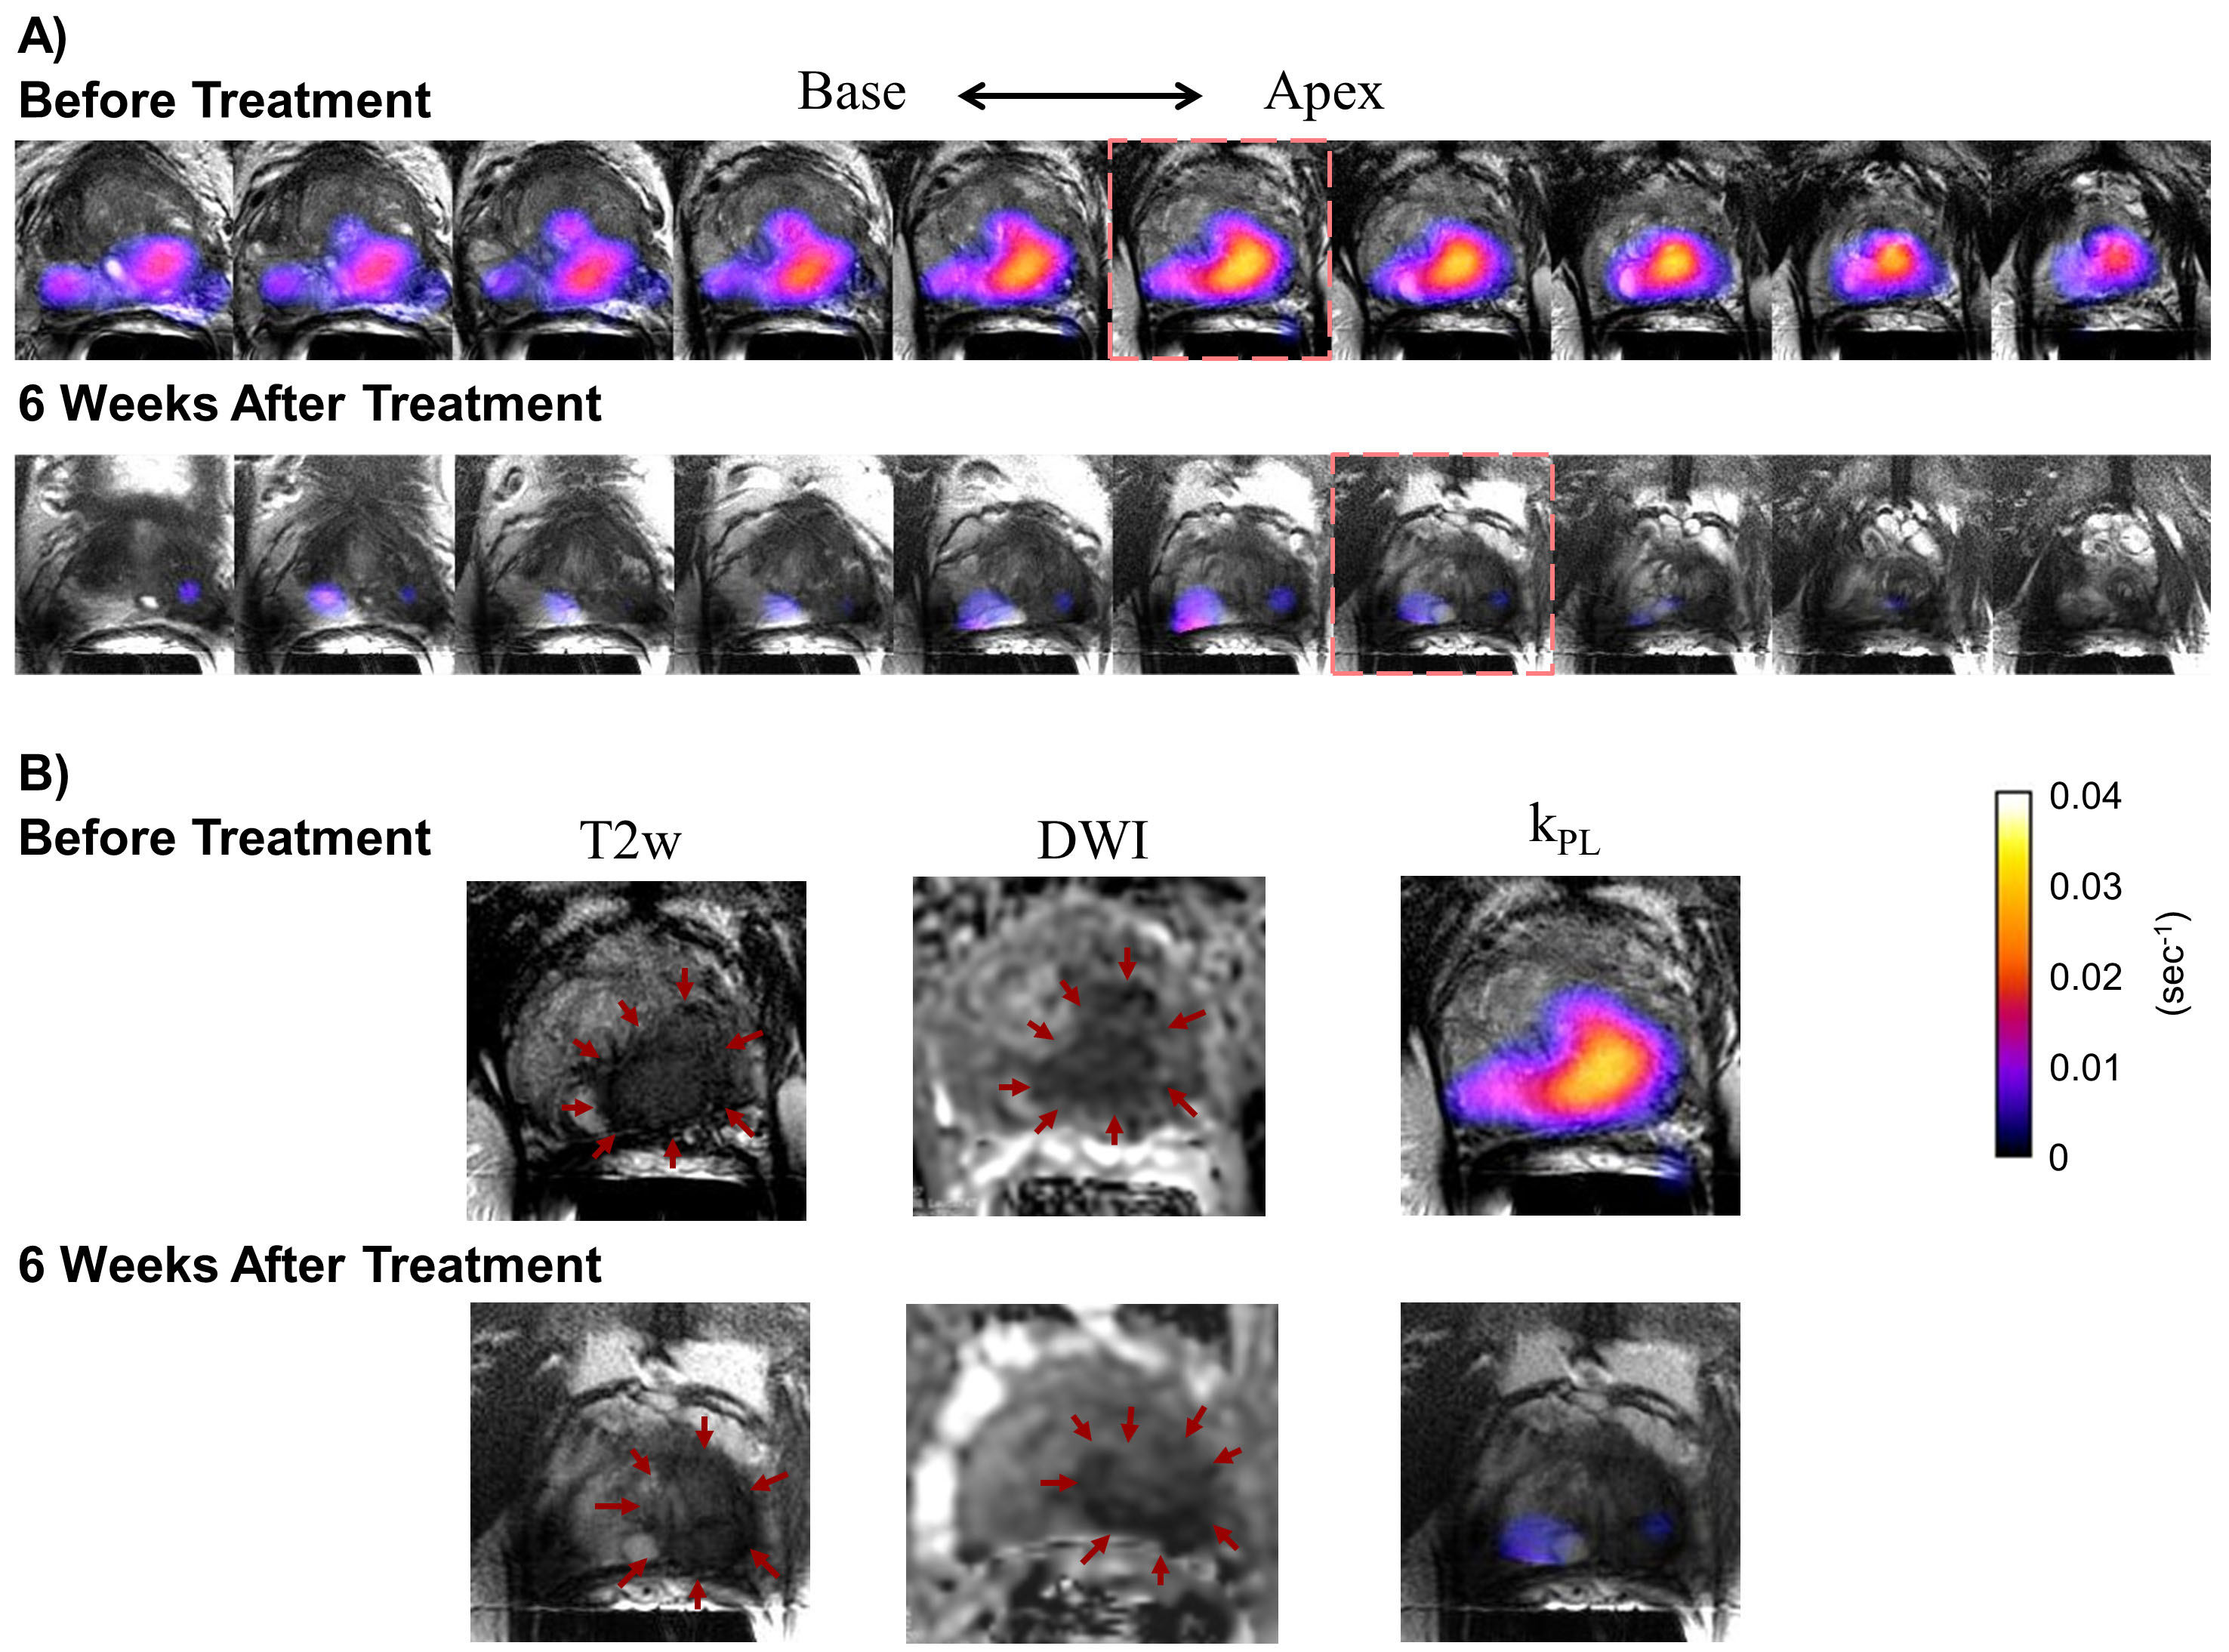
The same patient underwent ADT (Lupron+Casodex) and chemo (docetaxel) therapies after the baseline study. Follow-up exam conducted 6 weeks after the initiation of treatment revealed markedly reduced kPL across the entire tumor region to ~1/4 compared to baseline (0.0273 vs 0.0075s-1, Fig.3A). PSA also reduced from 25.7 to 0.78 ng/ml. This showed early responses to treatment, whereas changes were much less discernible in T2w or DW images (Fig.3B).
A second patient had bilateral prostate cancer found at radical prostatectomy (Fig.4). HP-13C exam conducted prior to surgery enabled correlation between kPL maps and pathological findings. Regions of the highest kPL (red and bright orange) were associated with Gleason 4+3 cancer. Regions with relatively lower kPL values (blue to purple) correlated with Gleason 3+4 and 3+3 cancer.
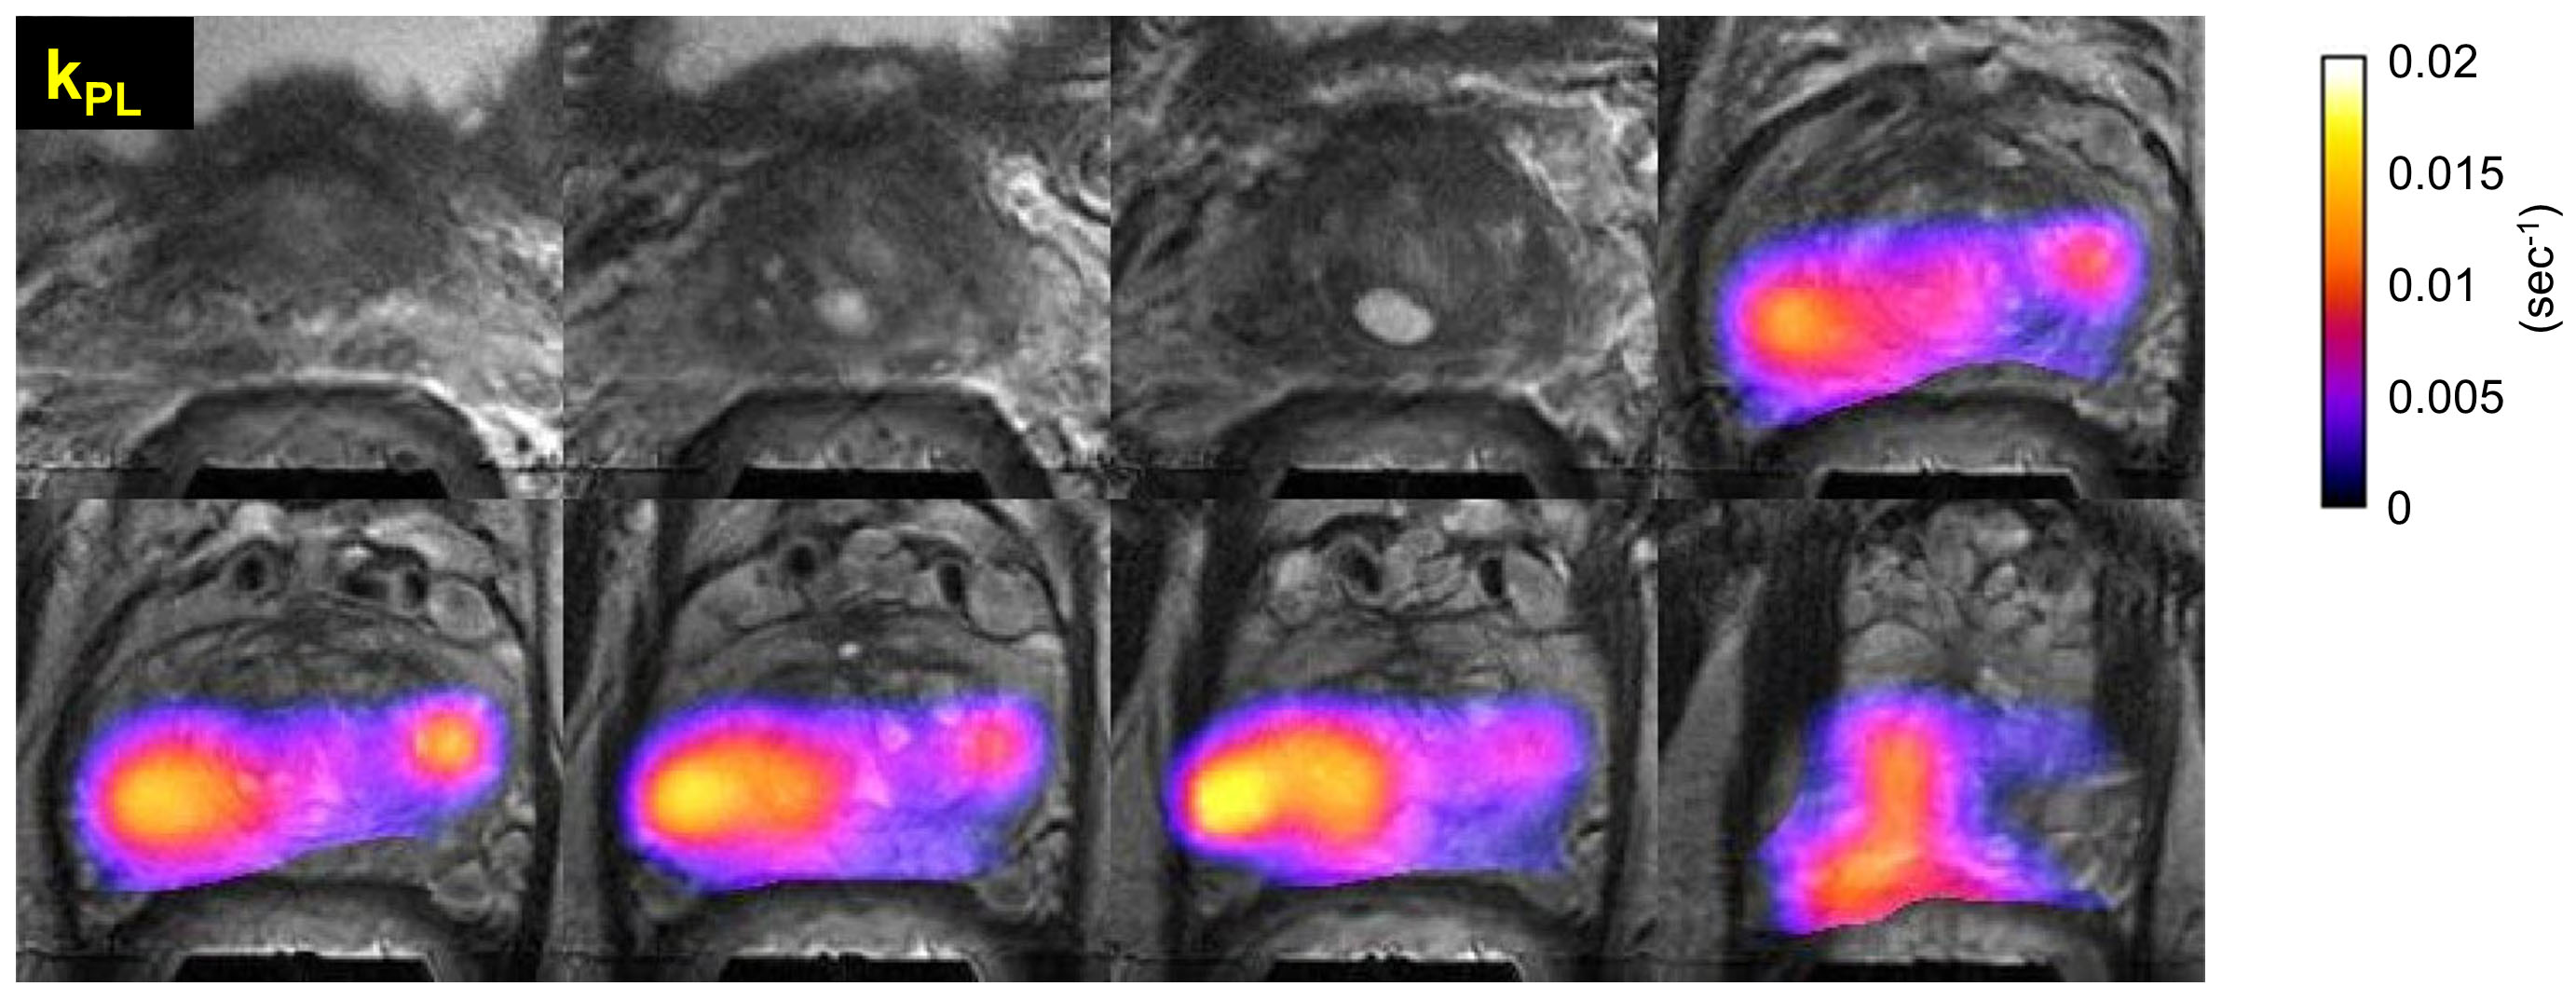
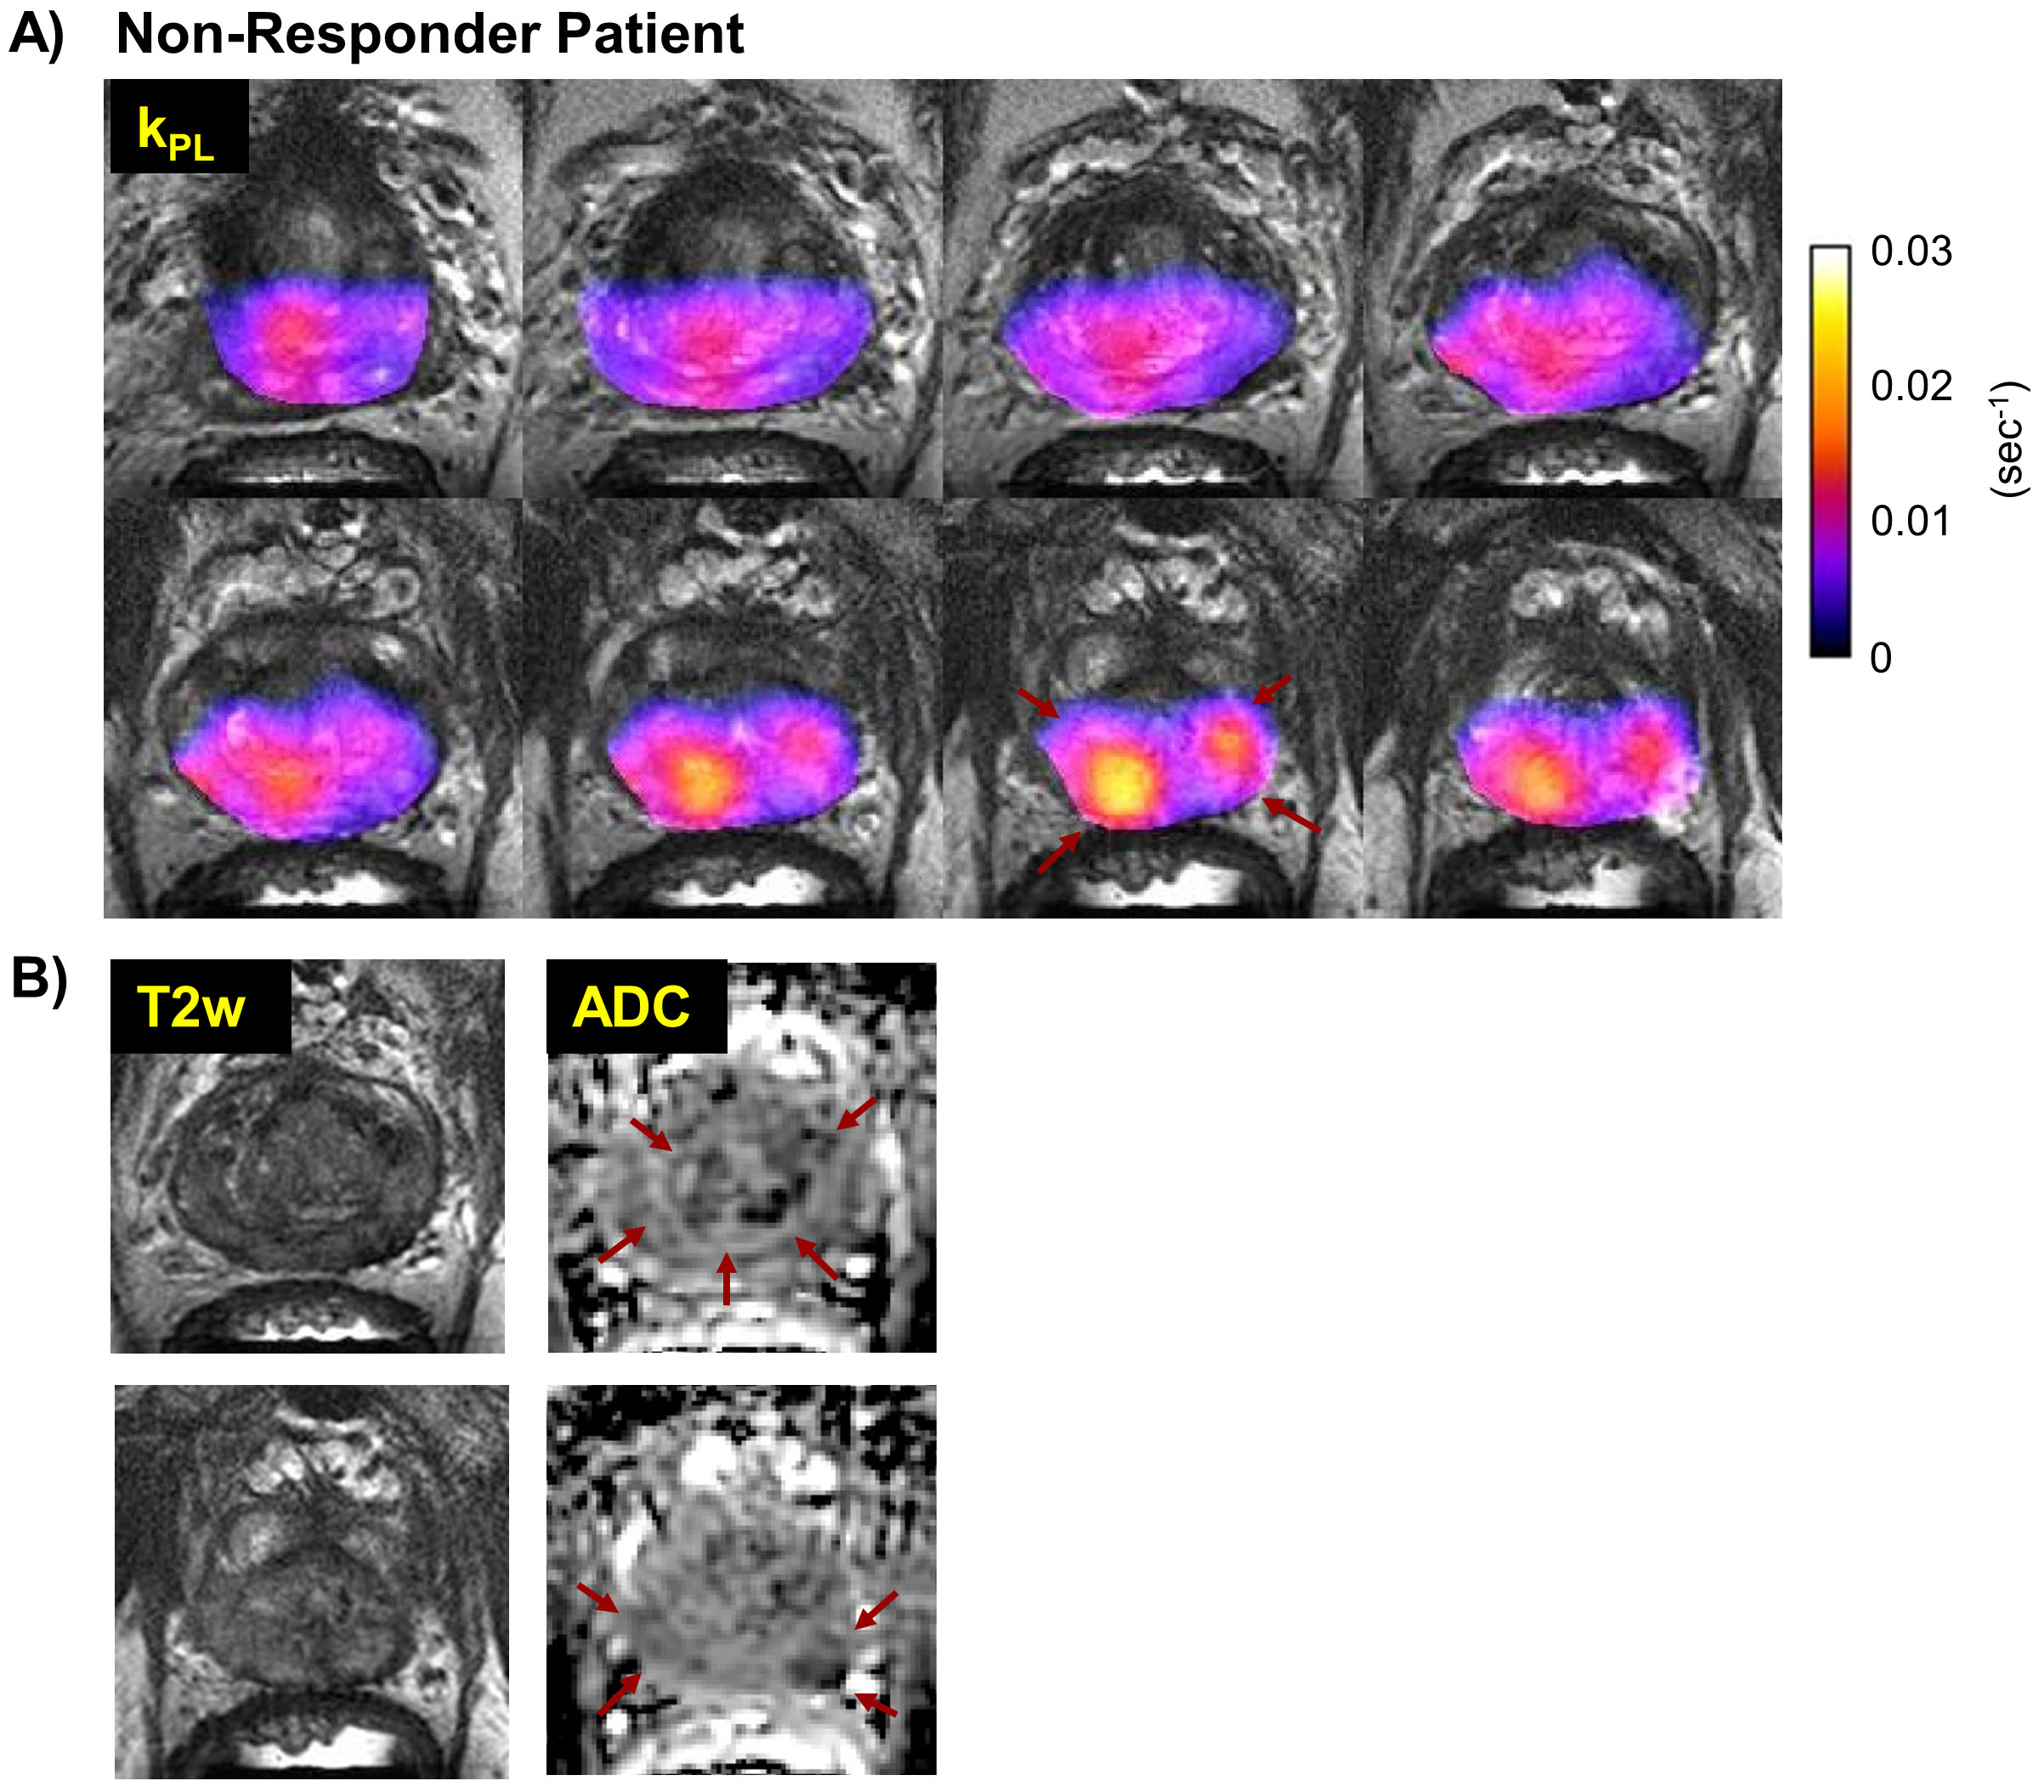
A third patient had extensive castration-resistant prostate cancer (Gleason 4+5). One month after the initiation of ADT (Zytiga), high kPL was observed at HP-13C exam (Fig.5), associated with PSA increase from 15.8 to 20 ng/ml.
In this study the combination of HP-13C MRI and kinetic models enabled quantitative detection of prostate cancer metabolism in patients. The study results support a role for HP-13C MRI in the assessment of prostate cancer aggressiveness and treatment response to address current unmet clinical needs.
Conclusions
The 3D dynamic HP-13C CS-EPSI provided full coverage, temporally-resolved visualization of the prostate gland with a 0.5cc resolution. This enabled non-invasive metabolic monitoring of treatment response in clinical prostate cancer, and was integrated a multi-parametric MRI prostate exam.Acknowledgements
This work was supported by grants from the NIH (R01EB017449, R01EB013427, R01CA166655, and P41EB013598).References
[1] Cancer Facts and Figures 2017. Atlanta, GA: American Cancer Society; 2017
[2] Wallace TJ et al., Current Approaches, Challenges and Future Directions for Monitoring Treatment Response in Prostate Cancer. J Cancer. 2014; 5(1): 3-24
[3] Beers TM et al., Enzalutamide in Metastatic Prostate Cancer before Chemotherapy. N Engl J Med. 2014; 371(5): 424-433
[4] Nelson SJ et al., Metabolic Imaging of Patients with Prostate Cancer Using Hyperpolarized [1-13C]Pyruvate. Sci Transl Med. 2013;5(198)
[5] Kurhanewicz J et al., Analysis of Cancer Metabolism by Imaging Hyperpolarized Nuclei: Prospects for Translation to Clinical Research, Neoplasia. 2011; 13(2):81-97
[6] Ardenkjaer-Larsen JH et al., Increase in signal-to-noise ratio of > 10,000 times in liquid-state NMR. Proceedings of the National Academy of Sciences of the United States of America; 2003
[7] Golman K et al., Real-time metabolic imaging. Proc. Natl. Acad. Sci. U.S.A. 2006; 103, 11270–11275
[8] Hu S et al., 3D Compressed Sensing for Highly Accelerated Hyperpolarized C-13 MRSI With In Vivo Applications to Transgenic Mouse Models of Cancer. Magn. Reson. Med. 2010; 63(2):312-21.
[9] Larson PEZ et al., Fast Dynamic 3D MR Spectroscopic Imaging with Compressed Sensing and Multiband Excitation Pulses for Hyperpolarized C-13 Studies. Magn. Reson. Med. 2011; 65(3):610-9.
[10] Xing Y et al., Optimal variable flip angle schemes for dynamic acquisition of exchanging hyperpolarized substrates. Journal of Magnetic Resonance. 2013; 234, 75-81.
[11] Chen HY et al., Phase II Clinical Hyperpolarized 13C 3D-Dynamic Metabolic Imaging of Prostate Cancer using a B1-insensitive Variable Flip Angle Design. Proceedings of the 25th Annual Meetings of ISMRM 2017;
[12] Kurhanewicz J et al., Multiparametric magnetic resonance imaging in prostate cancer: present and future. Curr Opin Urol. 2008; 18(1), 71.
Figures