0806
In vivo monitoring of intracellular pO2 in response to CAR T cell immunotherapy against glioma1Bioengineering, UCSD, La Jolla, CA, United States, 2Radiology, UCSD, La Jolla, CA, United States, 3Neurological Surgery, UCSF, San Francisco, CA, United States
Synopsis
We explore the temporal dynamics of tumor intracellular partial pressure of oxygen (pO2) in a murine glioma model receiving human chimeric antigen receptor (CAR) T cell immunotherapy. Tumor cells were intracellularly labeled with perfluoro-crown-ether (PCE) nanoemulsion ex vivo before flank injection in mouse. The spin-lattice relaxation rate (R1) of PCE is linearly proportional to the local oxygen concentration, enabling longitudinal in vivo measurement of absolute pO2 values. Our results indicate that CAR T cell therapy induces significant tumor pO2 increase peaking three days post-intravenous injection and correlates to tumor growth reduction.
Introduction
We explore the temporal dynamics of tumor intracellular partial pressure of oxygen (pO2) in a murine glioma model receiving chimeric antigen receptor (CAR) T cell immunotherapy. Tumor hypoxia is associated with increased tumor angiogenesis, recurrence, and malignant progression1. Noninvasive monitoring of tumor pO2 levels during treatment can provide a preclinical surrogate biomarker for the effectiveness of emerging immunotherapeutic strategies and can be used to optimize therapeutic course and dosage2. We tested the hypothesis that a measurable increase in pO2 is commensurate with CD8+ T cell apoptotic processes in a mouse model of sub-cutaneous glioblastoma (U87-EGFRvIII-Luc) treated with human CAR T cells. Perfluoro-crown-ether (PCE) nanoemulsion dissolves oxygen, resulting in a linear increase in the 19F spin-lattice relaxation rate (R1) with increasing pO2. Using 19F MRI/MRS, we measured the pO2 time-course in flank glioma cells that were intracellularly labeled with PCE nanoemulsions and treated with intravenously-infused CAR T cells.Methods
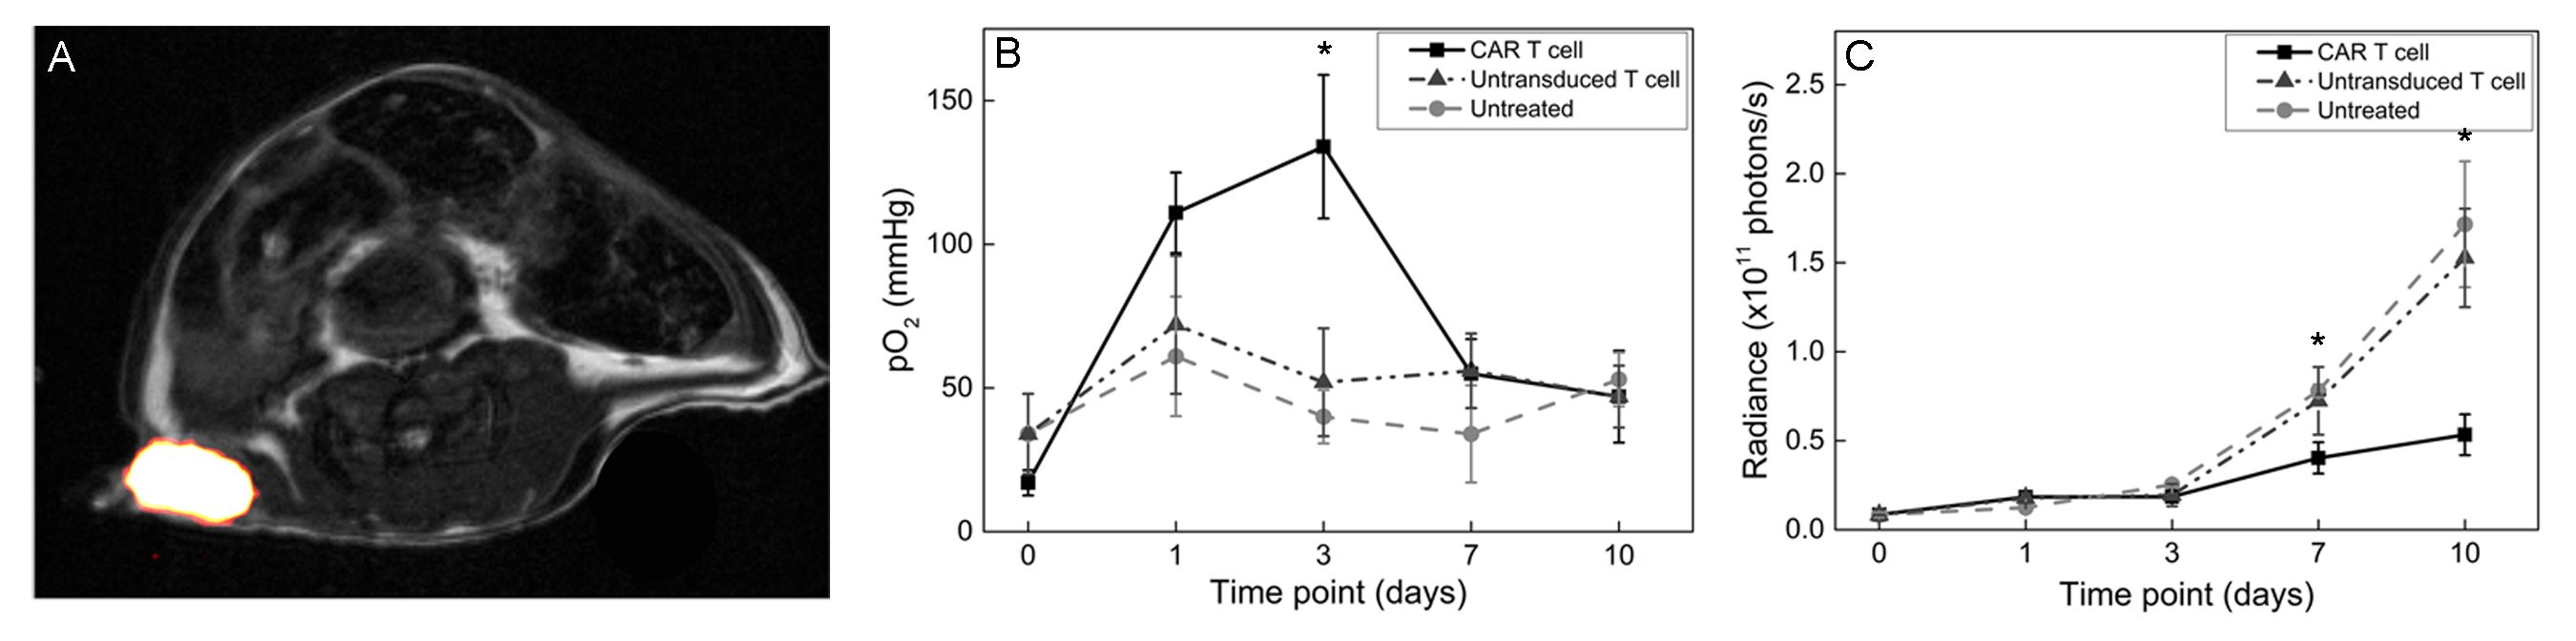
U87 glioma cells expressing EGFRvIII and luciferase (U87-EGFRvIII-Luc) were labeled ex vivo with laboratory-prepared PCE nanoemulsion3 overnight in conventional medium followed by wash. Cell uptake was measured by 19F NMR4 yielding the mean 19F/cell. Human peripheral blood mononuclear cell-isolated T cells were transduced with a CAR lentiviral vector to express a surface antibody against EGFRvIII, a common receptor in glioblastoma multiforme5. Transduction efficacy and phenotype of the T cells was confirmed by flow cytometry; a population of >70% CAR T cells was used for intravenous injection. Female SCID mice (N=15) received unilateral sub-cutaneous injections of 5×10⁶ PCE-labeled U87-EGFRvIII-Luc cells. All mice were subjected to MRI and bioluminescence imaging (BLI) four days post tumor implantation, then received intravenous cell treatments (day 0). Groups 1-3 (N=5 per group) received 20×106 CAR T cells, 20×106 untransduced T cells, and no T cells, respectively. Longitudinal MRI and BLI scans were acquired using a Bruker 11.7T BioSpec and an IVIS Spectrum, respectively, on days 1, 3, 7, and 10 while anesthetized with 1.5% isoflurane in 100% O2 and maintained at 37°C. Proton images were acquired using RARE (TR/TE=1400/7.8 ms, RARE factor 2, NA=2, FOV=3×3 cm2, matrix = 256×256). Co-registered 19F images were also acquired with RARE (TR/TE=400/23 ms, NA=32, matrix = 64×64). The 19F R1 was measured over entire tumor volume using PRESS (15 TR values, 0.1-6 s, single exponential recovery fit) to yield pO2 values, calculated with a calibration curve6. At the experimental endpoint, tumors and spleens were harvested and fixed for histology to qualitatively assess (CAR) T cell homing.Results
Prior to implantation, U87-EGFRvIII-Luc cells were labeled ex vivo with PCE to (average) level ~7×10¹² atoms/cell measured via 19F NMR. Following sub-cutaneous injection, labeled glioma cells appear as an MRI 19F hotspot with SNR~10 at day 1 post-injection (Fig. 1A). PRESS voxel encompassing the hotspots was used to measure R1 values to calculate pO2 (Fig. 1B). Longitudinal in vivo measurements show a transient spike in tumor pO2 approximately three days after CAR T cell infusion (R1=0.99±0.12 s-1, pO2=134±25 mmHg) compared to untransduced T cells (pO2=61±20 mmHg) and control (pO2=40±9 mmHg, p = 0.026, Fig. 1B). There is no significant pO2 change in the untransduced T cell Group at day 3 (p=0.35). These data suggest specific CAR T cell homing to the tumor tissue, presumably initiating a target killing cascade, and altering intracellular pO2. By day 7, tumor oxygenation returns to baseline in the CAR T cell Group (Fig. 1B). Longitudinal bioluminescence measurements show significant tumor regression 7 days post CAR treatment with an average radiance of 4*1010 photons/sec, which is half the amount measured for both naïve T-cell treated and untreated groups (p=0.012, Fig. 1C). Histopathological staining confirmed the presence of CAR T cells in greater amounts than untransduced T cells in the tumors at day 3 post-infusion (p=0.001, data not shown), consistent with the MRS results.Conclusions
In this study, we show that 19F MRI enables temporal measurements of tumor cell oxygen tension in response to CAR T cell therapy. Peak pO2 was observed at 3 days post-infusion and suggests significant CAR T cell infiltration and targeted tumor cell killing, compared to untransduced T cells. Preliminary quantitation of tumor infiltrating T cells in the same glioma model via 19F detection is reported elsewhere7. Overall, these data support the view that 19F pO2 MRI and MRS can serve as a biomarker for cell-mediated apoptosis and provide insight into the modes of action of engineered T cell immunotherapy against cancer.Acknowledgements
This work was supported by the NIH grants R01-EB017271, R01 CA139579, R01 EB024015 and CIRM grant LA1-C12-06919References
1 Tatum, J. L. et al. Hypoxia: importance in tumor biology, noninvasive measurement by imaging, and value of its measurement in the management of cancer therapy. Int J Radiat Biol 82, 699-757, (2006). 2 Matsuo, M. et al. Magnetic resonance imaging of the tumor microenvironment in radiotherapy: perfusion, hypoxia, and metabolism. Semin Radiat Oncol 24, 210-217, (2014).
3 Kadayakkara, D.K.K., et al. In vivo observation of intracellular oximetry in perfluorocarbon-labeled glioma cells and chemotherapeutic response in the CNS using fluorine-19 MRI. Magn Reson Med 64(5): 1252–1259, (2010).
4 Srinivas, M. et al. Fluorine-19 MRI for Visualization and Quantification of Cell Migration in a Diabetes Model. Magn Reson Med 58:725–734, (2007).
5 Ohno, M. et al. Expression of miR-17-92 enhances anti-tumor activity of T-cells transduced with the anti-EGFRvIII chimeric antigen receptor in mice bearing human GBM xenografts. J Immunother Cancer 1, 21, (2013).
6 Zhong, J. et al. In vivo intracellular oxygen dynamics in murine brain glioma and immunotherapeutic response of cytotoxic T cells observed by fluorine-19 magnetic resonance imaging. PLoS One 8, e59479, (2013).
7 Chapelin, F. et al. Fluorine-19 NMR cytometry to quantify human transgenic CAR T-cell biodistribution in murine studies of glioblastoma immunotherapy. Abstract #1103, ISMRM 2017.
Figures