0804
Parametric Response Mapping of Normalized FLAIR MR Images Provides Early Indication of Recurrence Risk in Glioblastoma1University of Michigan, Ann Arbor, MI, United States, 2Radiology, University of Michigan, Ann Arbor, MI, United States, 3Grenoble Institut des Neurosciences, GIN, Universite Grenoble Alpes, Grenoble, France, 4Biostatistics, University of Michigan, Ann Arbor, MI, United States
Synopsis
Glioblastoma is a particularly malevolent disease, with median expected survival around 14 months. Standard protocols for treatment assessment and recurrence rely on morphological approximations of tumor burden. Recently included by the RANO criteria, T2/FLAIR is now standard in imaging protocols, highlighting edema, presumed to be associated with tumor cell infiltration and critical for accurate description of tumor burden and radiation treatment planning. Advanced methods for early detection of change are underutilized. Application of the Parametric Response Map technique provides greater sensitivity to FLAIR signal changes indicative of tumor progression prior to those detectable by morphological analysis alone.
Introduction
Glioblastoma (GBM) is the most common form of central nervous system malignancy in adults, and carries a particularly poor prognosis with median expected survival of just over a year.1 Standard protocols for assessing therapy response and progression utilize approximations of tumor burden based on bi-dimensional measurements of contrast-enhancing tissue and fluid-attenuated inversion recovery (FLAIR) signal. FLAIR signal is presumed to represent tumor cell infiltration into healthy tissues, causing edema. Current prognostic methods use only volumetric changes to determine progression, however a voxel-wise approach call the Parametric Response Map (PRM) has been shown to improve sensitivity to changes in quantitative imaging maps, especially in cases of small localized or heterogeneous response.2 We propose that application of PRM to normalized FLAIR imaging may provide an early indication of progression risk, before gross anatomical changes can be distinguished.Methods
Subjects (N=52) were recruited as a single-site prospective trial including patients with diffuse high-grade glioma (WHO grade III and IV) to be treated with radiation therapy (IR).3 Treatment response was assessed at approximately 10 weeks using the Macdonald criteria, and a subset of responders (N=26; partial response, PR, or stable disease, SD) was monitored for progression. Standard magnetic resonance imaging (MRI) was performed, including T2-weighted fluid-attenuated inversion recovery (T2/FLAIR) acquisitions. T2/FLAIR images were normalized to the mean signal of frontal white matter, resulting in maps of the relative FLAIR signal, or rFLAIR. Hyperintense regions on T2/FLAIR were manually delineated by an experienced radiologist for quantitative analysis of relative change from baseline (dVFLAIR). Images were spatially registered serially using open source software (Elastix4). Briefly, a multi-resolution b-spline optimization was used over the whole brain with mutual information describing the cost function along with a bending energy penalty. Parametric Response Maps (PRM) were generated on the aligned rFLAIR images within the union of FLAIR VOIs using a threshold of +/-0.25, based on the 95% confidence interval found for normal brain tissue far from the lesion. This resulted in relative volumes of increased (PRMrFLAIR+), decreased (PRMrFLAIR-), or unchanged (PRMrFLAIR0) signal. Evaluation of PRMrFLAIR and dVFLAIR was performed using receiver-operator curve (ROC) analysis to assess overall performance (using the area under the curve, AUC) and find optimal stratification between early and late overall survival (OS) and progression-free survival (PFS). Kaplan-Meier curves were then generated and log rank significance was assessed at p-values < 0.05.Results
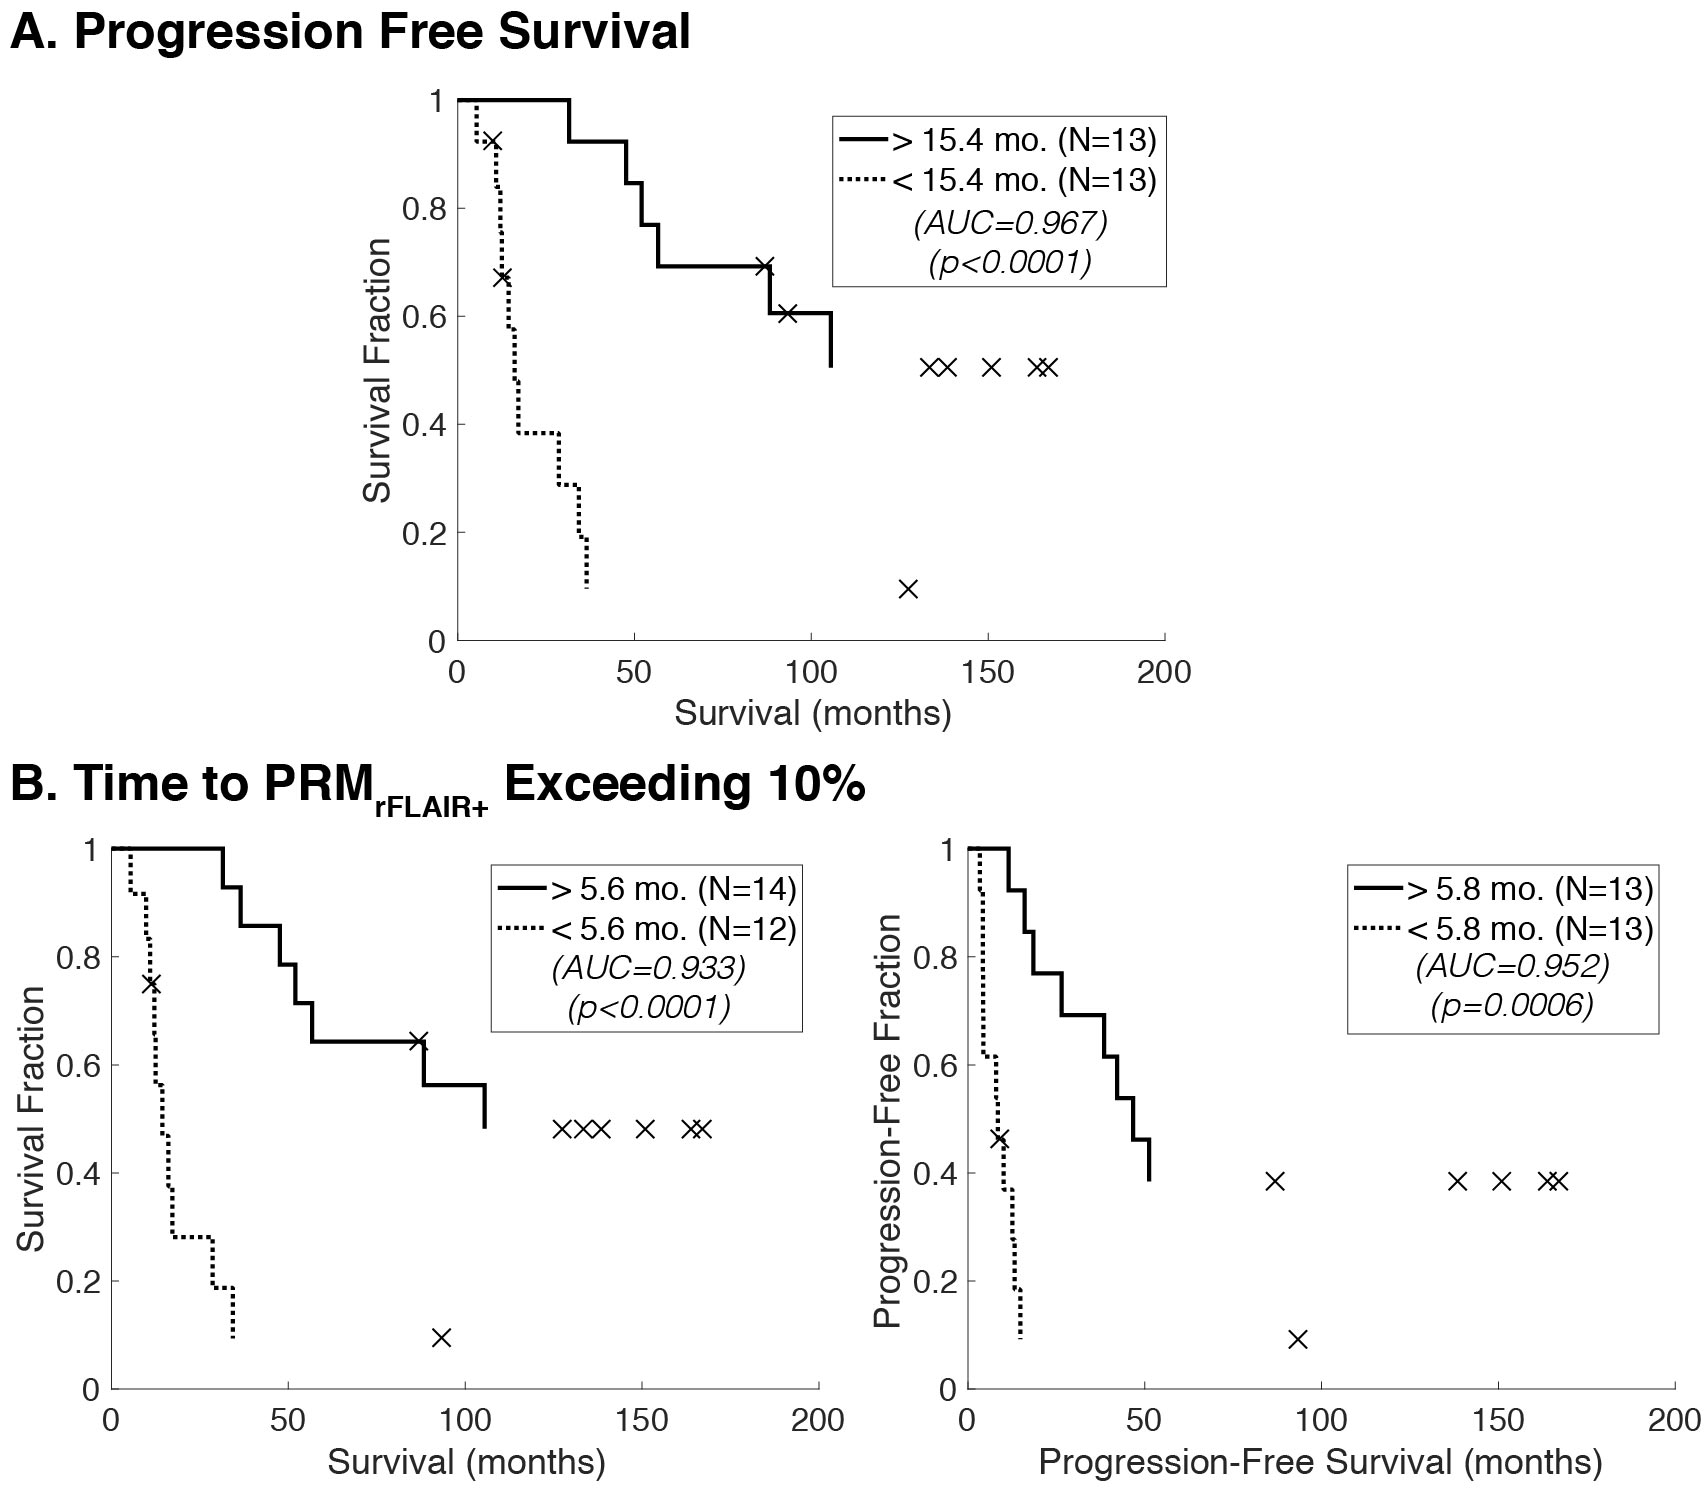
PRMrFLAIR+ and dVFLAIR were both found to be predictive of both OS and PFS when assessed at approximately 11 weeks post-IR (Figure 1). Optimal cutoffs for stratification of early or late survival using volume changes in this time period were 10.3% or 15.8% increases for OS and PFS, respectively. Cutoffs for PRMrFLAIR+ were 15.3% and 11.5%, respectively. An early time point of approximately 20 weeks post-IR (~10 weeks post-response assessment) was selected for evaluation of progression risk (Figure 2). Here, dVFLAIR was not found to be predictive of clinical outcomes, while PRMrFLAIR+ significantly stratified early/late survival with high specificity and sensitivity. The time to PRMrFLAIR+ progression was then evaluated using an empirically-derived threshold of 10% relative volume. ROC analysis found an optimal stratification cutoff of 5.6 months to exceed 10% PRMrFLAIR+, resulting in a significant stratification of OS and PFS (Figure 3).Discussion
The goal of this study was to highlight PRM of T2/FLAIR imaging as a potentially valuable early indicator of patient progression risk. FLAIR imaging is currently incorporated in standard protocols for monitoring GBM, allowing for implementation of this method without affecting standard clinical workflow. PRMrFLAIR was shown to be sensitive to therapeutic response as seen by a significant stratification at 11 weeks post-IR, comparable to the current RANO standard criteria. When evaluated between weeks 11 and 20 post-IR, PRMrFLAIR was predictive of survival even while volume change was not. Further, when evaluated as a progression marker with a threshold of 10% relative volume, PRMrFLAIR was able to significantly stratify recurrence risk nearly 10 months earlier than the standard RANO criteria.Conclusion
It is now known through exhaustive research that assessment of tumor-associated edema, visualized using FLAIR imaging, is critical for the accurate depiction of tumor burden as well as radiation treatment planning. Despite continual improvements in computer systems and analysis software, advanced image analysis tools for the assessment of treatment response and recurrence remain underutilized. PRM of normalized FLAIR MRI can be readily implemented in clinical workflows, and provides a significant early indication of recurrence risk.Acknowledgements
No acknowledgement found.References
1. Wen, P.Y. & Kesari, S. Malignant gliomas in adults. N Engl J Med 359, 492-507 (2008).
2. Galban, C.J., et al. The parametric response map is an imaging biomarker for early cancer treatment outcome. Nat Med 15, 572-576 (2009).
3. Hamstra, D.A., et al. Evaluation of the functional diffusion map as an early biomarker of time-to-progression and overall survival in high-grade glioma. Proc Natl Acad Sci U S A 102, 16759-16764 (2005).
4. Klein, S., Staring, M., Murphy, K., Viergever, M.A. & Pluim, J.P. elastix: a toolbox for intensity-based medical image registration. IEEE Trans Med Imaging 29, 196-205 (2010).
Figures