0803
Glycerophosphocholine increase is a reliable surrogate marker of chemotherapy response for various cancer drug treatments in triple-negative breast cancer cells1Radiology, The Johns Hopkins University School of Medicine, Baltimore, MD, United States
Synopsis
MRS-detected total choline is a promising noninvasive surrogate marker of chemotherapy response in breast cancer. We have utilized six widely clinically used cancer chemotherapeutic drugs to treat triple-negative breast cancer cells to elucidate their molecular effects on choline phospholipid metabolism. We employed high-resolution 1H MRS to detect changes in cellular choline metabolites combined with molecular approaches. Glycerophosphocholine increased in triple-negative breast cancer cells following all six types of chemotherapeutic treatment compared to vehicle control, while phosphocholine decreased, increased, or remained stable depending on the specific drug used, making glycerophosphocholine the most reliable surrogate marker of chemotherapy response in our study.
Introduction
The magnetic resonance spectroscopy (MRS)-detected total choline (tCho) signal is a promising non-invasive surrogate marker of chemotherapy response in breast cancer patients [1-3]. However, the exact molecular mechanisms by which common chemotherapeutic drugs affects the tCho signal, which consists of glycerophosphocholine (GPC), phosphocholine (PC), and free choline (Cho), are often unknown. Here we have utilized the widely used cancer chemotherapeutic drugs doxorubicin, paclitaxel, vinorelbine, melphalan (surrogate of the prodrug cyclophosphamide), cisplatin and 5-fluorouracil (5-FU) to treat triple-negative MDA-MB-231 breast cancer cells to elucidate their molecular effects on choline phospholipid metabolism. We employed high-resolution (HR) 1H MRS to detect changes in cellular choline metabolite profiles, quantitative RT-PCR and Western blotting to assess corresponding changes in expression levels of choline-metabolizing enzymes.Methods
MDA-MB-231 cells were treated with 5 μM doxorubicin, 0.5 μM paclitaxel, 0.5 μM Vinorelbine, 100 μM melphalan, 75 μM cisplatin, 400 μM 5-FU or corresponding vehicle control as well as the nonspecific GDPD6 inhibitor dipyridamole (20 μM), respectively for 24, 48, 72, or 96 hours. Metabolites were extracted using dual-phase extraction (methonal:chloroform:water=1:1:1). High-resolution (HR) 1H MRS of the water-soluble extract fraction was performed on a Bruker 750 MHz MR spectrometer. Choline containing metabolites were quantified from MR spectra using MestReNova software. RNA extracted from cells with the same treatment was reverse transcribed, and SYBR Green based quantitative PCR was used to detect changes in mRNA levels of glycerophosphodiester phosphodiesterase domain containing 5 (GDPD5) [4] and 6 (GDPD6) [5], and choline kinase α (Chkα) [6], and Western blot was used to detect protein levels of Chkα.Results
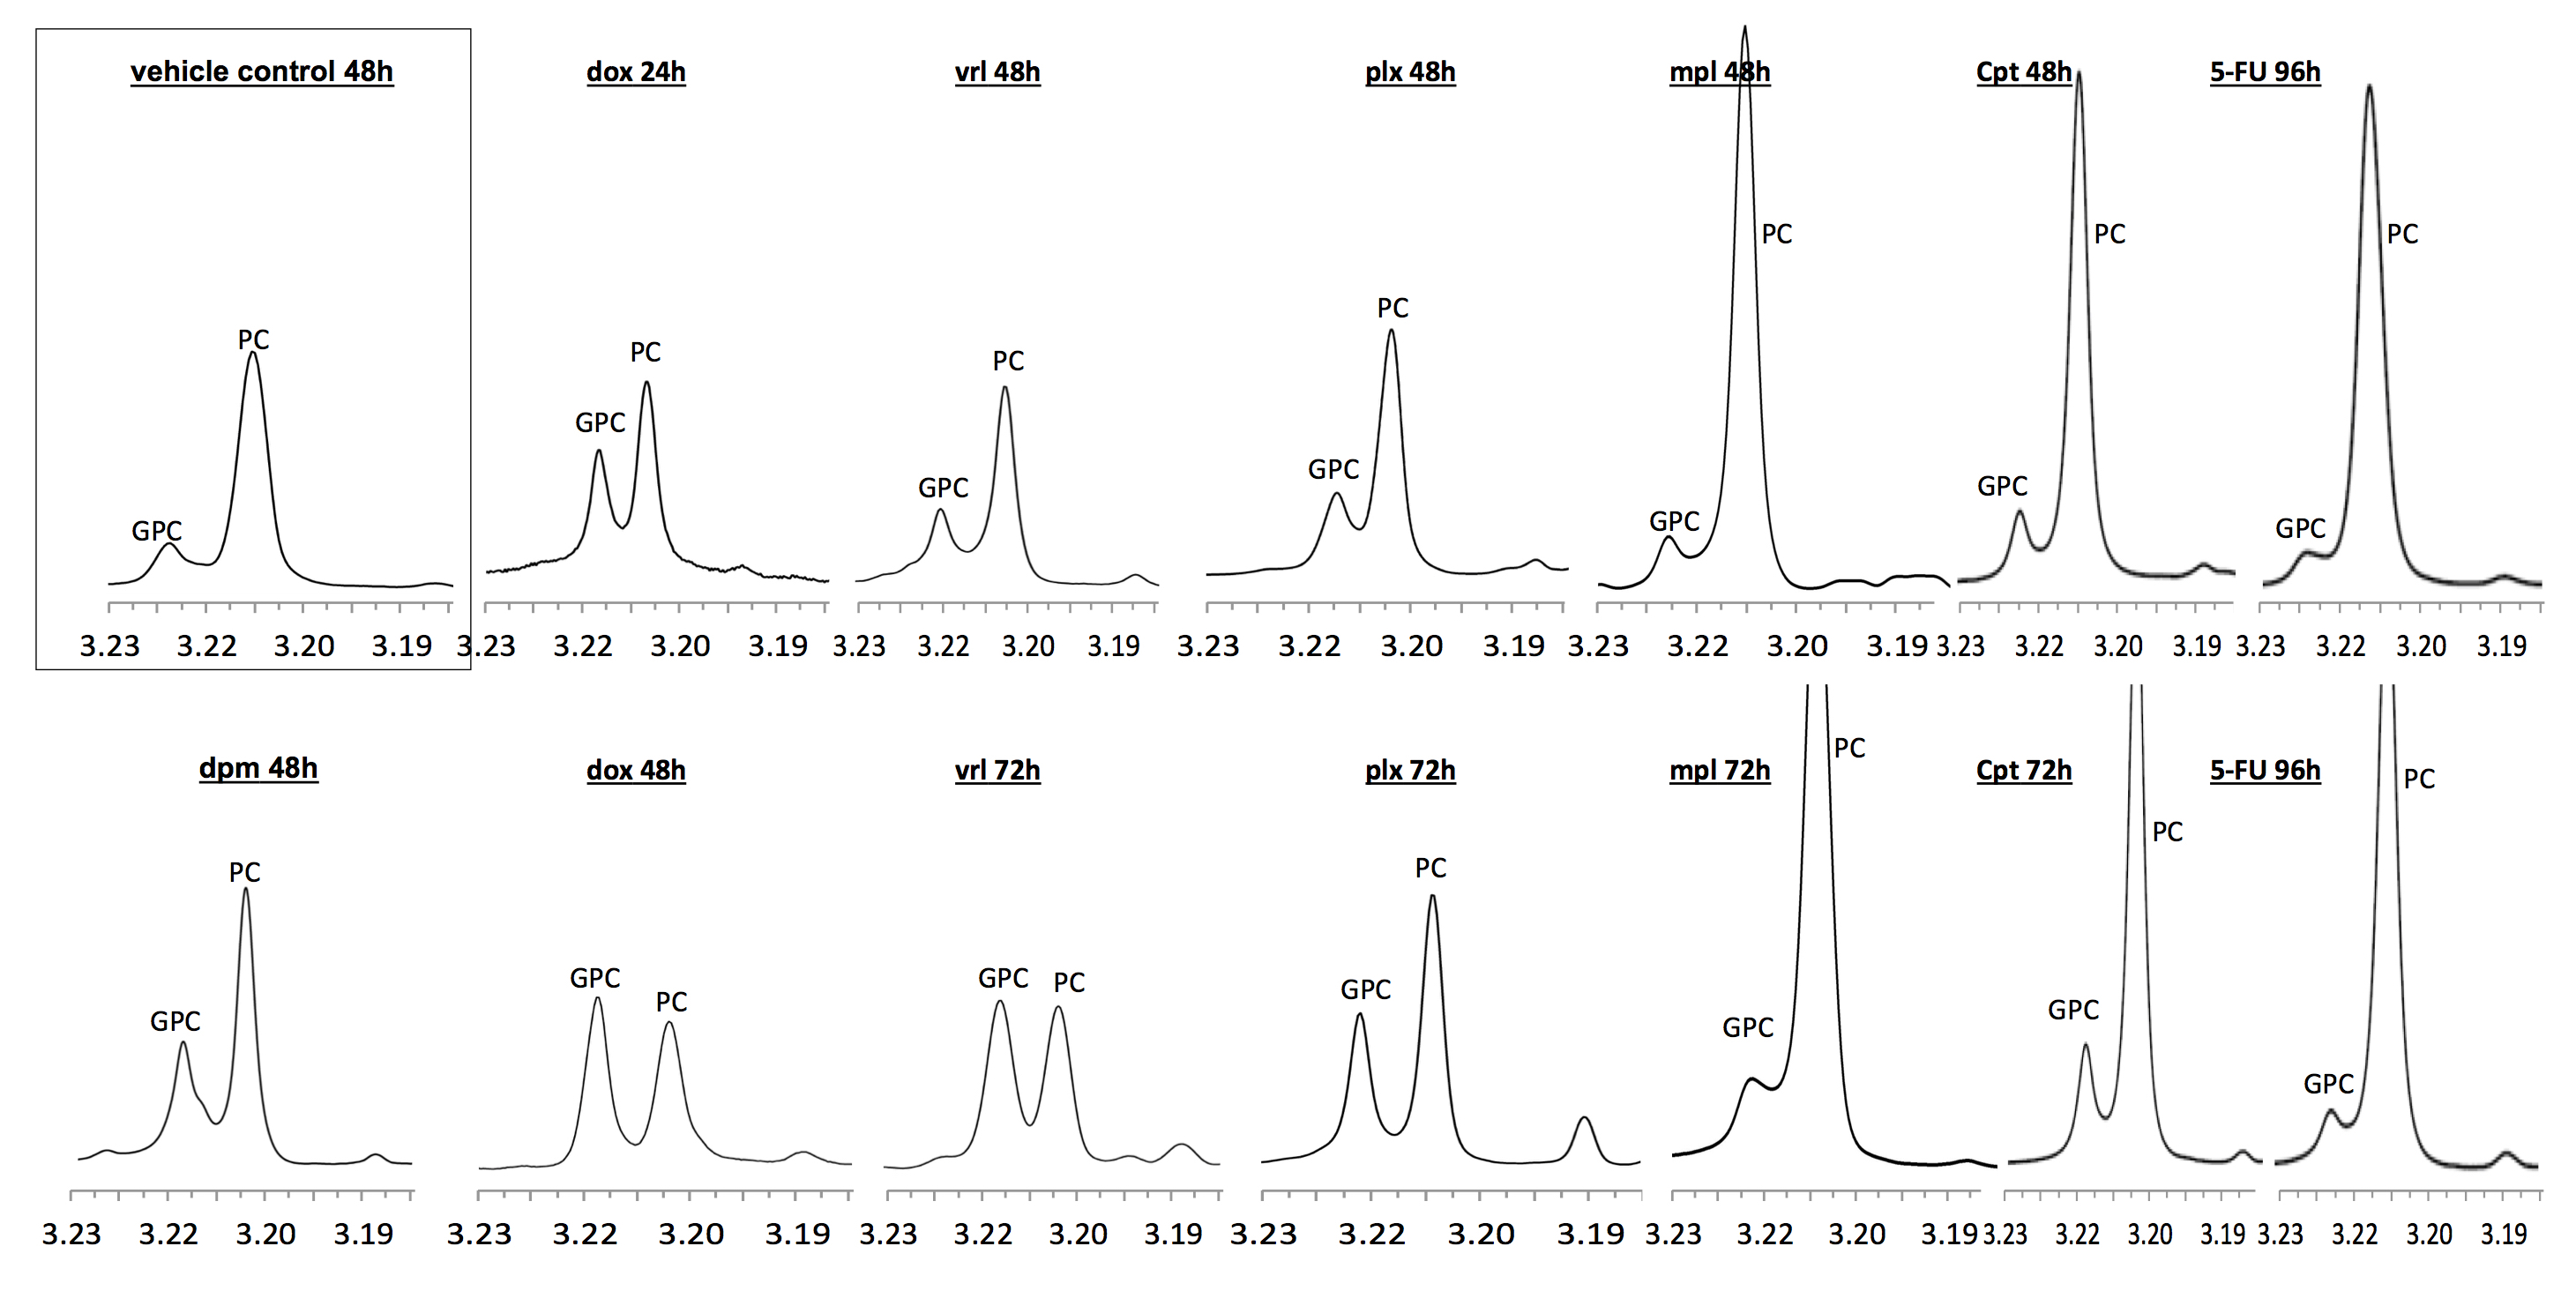
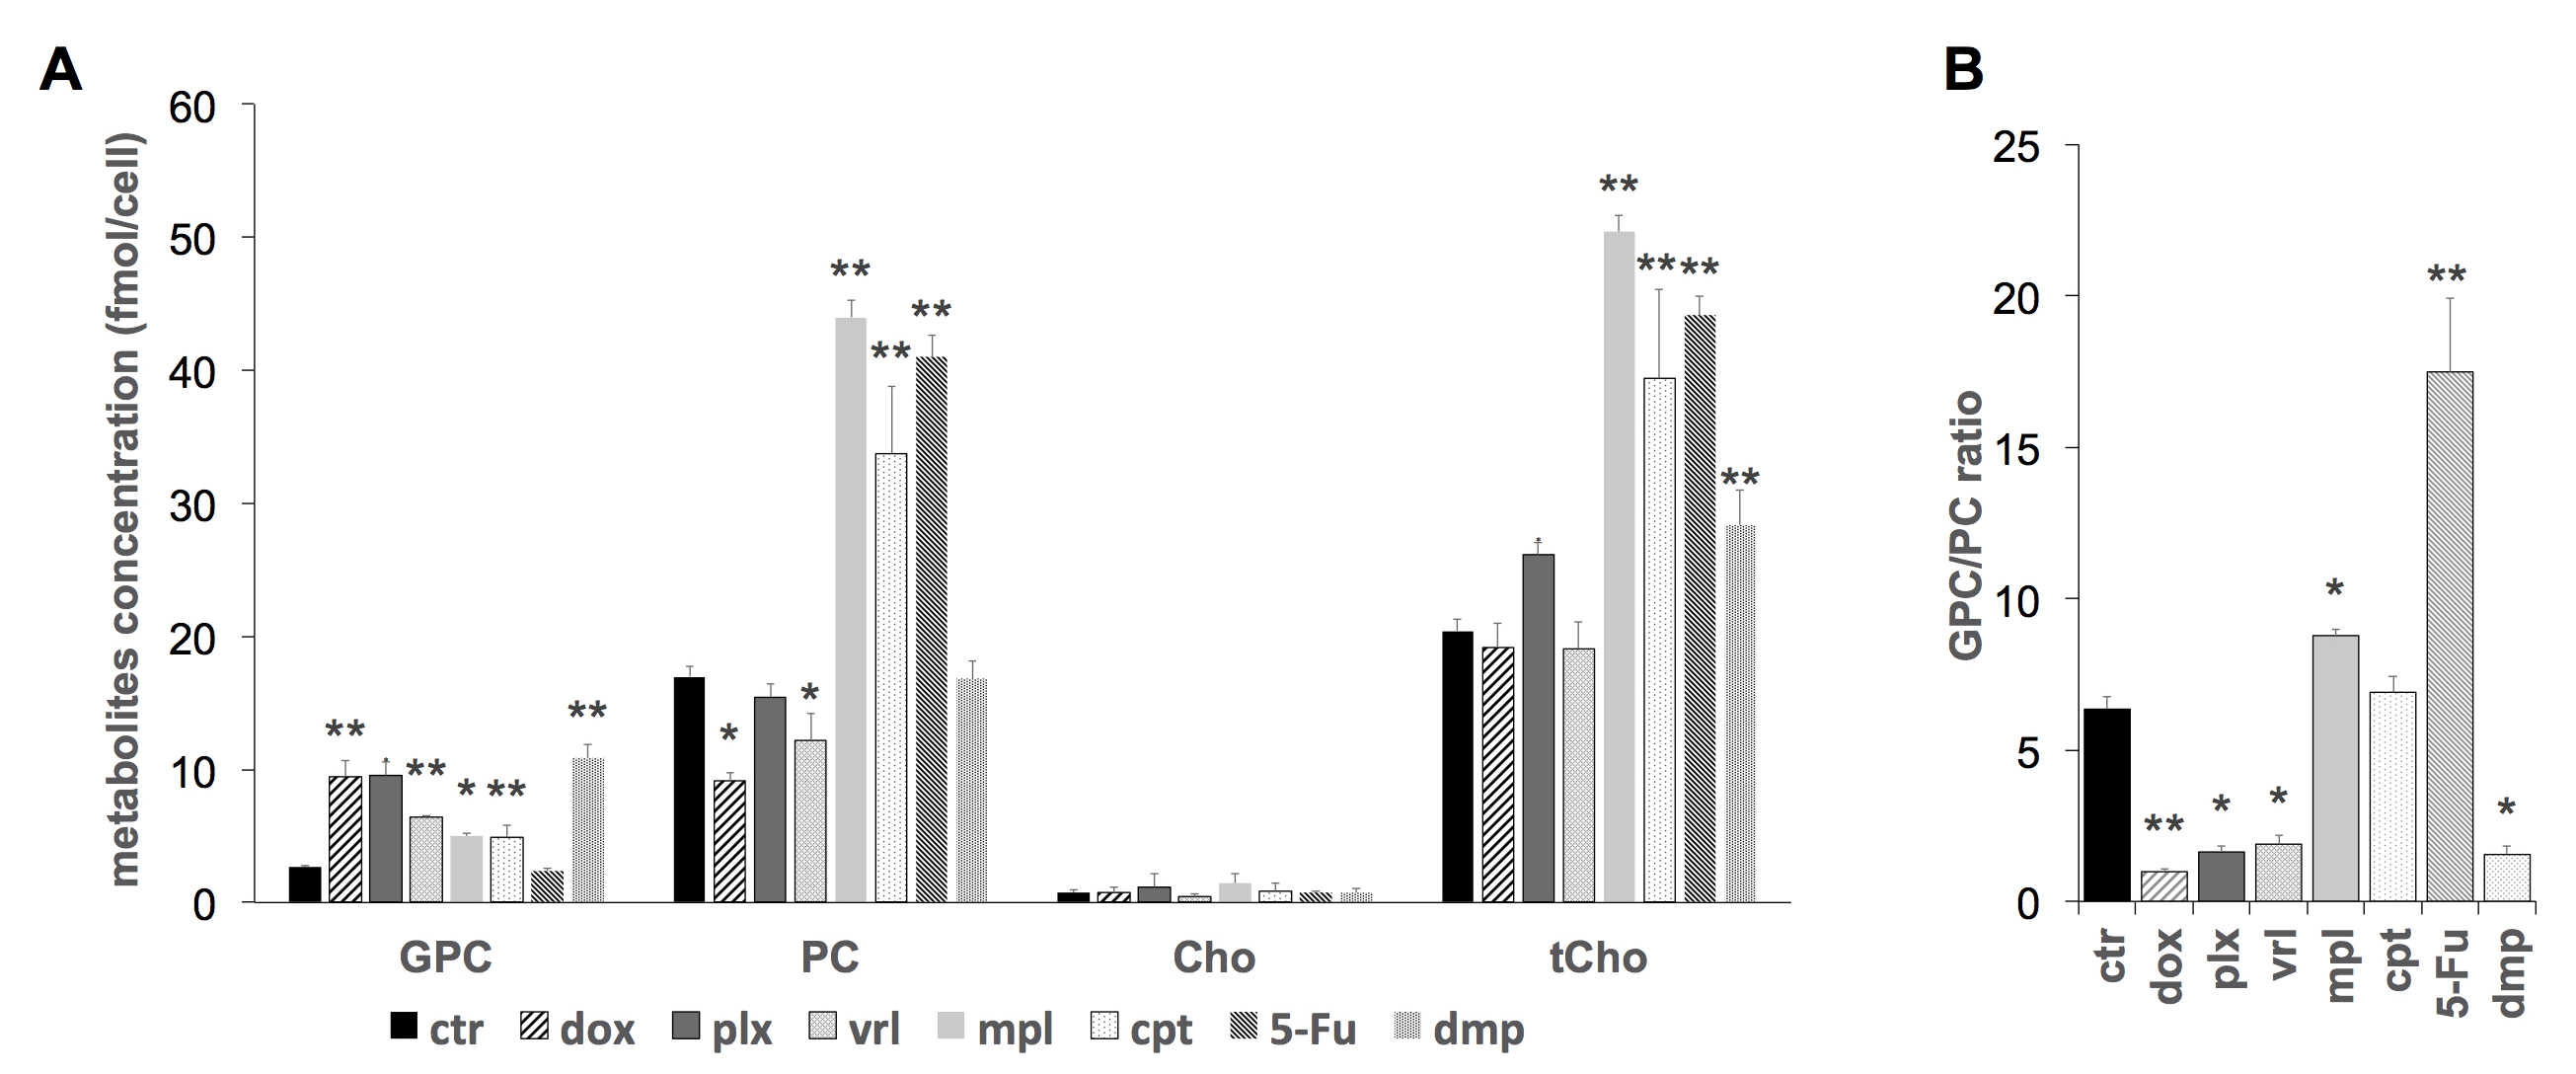
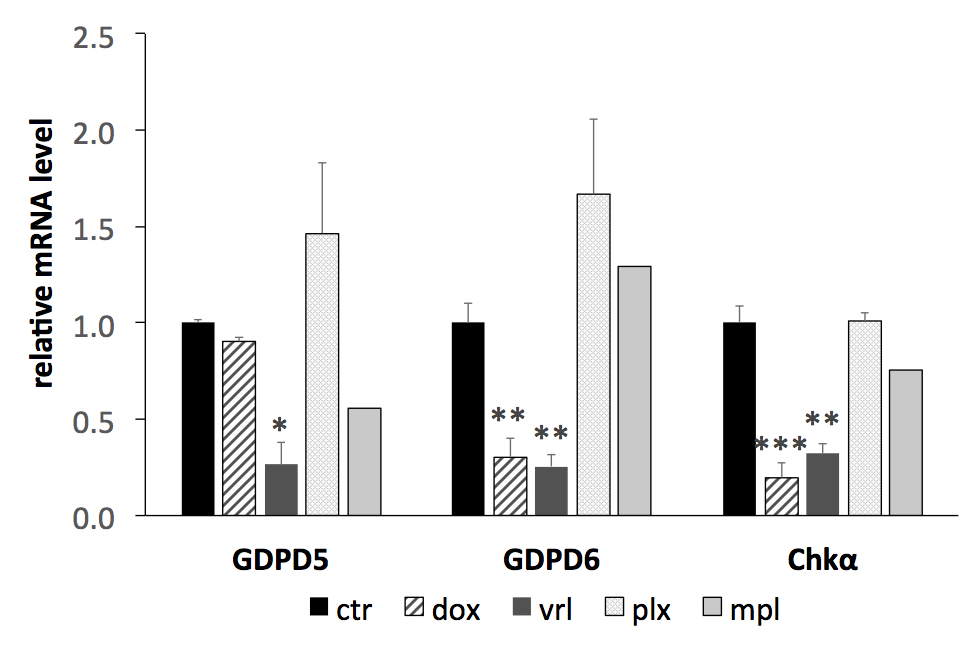
After 24, 48, 72, or 96 hours of treatment, the GPC level in MDA-MB-231 cells increased following all six types of chemotherapeutic treatment, as well as in dipyridamole treated cells as compared to vehicle control, while PC level varied depending on the specific drug used for treatment (Figure 1, 2). Doxorubicin and vinorelbine decreased PC significantly, resulting in unaltered tCho concentration and dramatically dropped PC/GPC ratio as low as 1; while paclitaxel treatment caused an increased GPC level but an unchanged PC level, leading to a slightly increased tCho level and a decreased PC/GPC ratio (Figure 1, 2). Cisplatin, 5-FU, and melphalan treatment all induced a large increase in PC, resulting in an increased PC/GPC ratio (Figure 1, 2). qRT-PCR-detected RNA expression levels revealed that GDPD6 and Chkα were downregulated by doxorubicin (Figure 3). GDPD5, GDPD6, and Chkα displayed lowered RNA expression levels following vinorelbine treatment, while no significant change occurred following paclitaxel treatment (Figure 3). Western blot analysis demonstrated that Chkα expression decreased following doxorubicin, vinorelbine or paclitaxel treatment, while increasing following 5-FU treatment (data not shown).Discussion
This study demonstrates that choline containing metabolites in triple-negative breast cancer cells may change differently depending on the type of chemotherapeutic drug used for treatment. In the case of doxorubicin and vinorelbine, while the tCho level does not change following anticancer treatment with these chemotherapeutic agents, some of the individual components within the tCho signal do change, i.e. we observed an increase of GPC and a decrease of PC. In the case of paclitaxel, increased GPC and unaltered PC levels lead to elevated tCho levels as compared to control. 5-FU, melphalan and cisplatin treatment all lead to a tremendous PC increase, while GPC is also increased, resulting in significantly increased PC/GPC ratio and highly elevated tCho compared to control. Although the PC level varied depending on the kind of drug treatment used, the level of GPC was consistently increased across all types of cancer chemotherapeutic drug treatment tested in our study. The observed metabolic alteration were caused by decreases Chkα, and GDPD6 or GDPD5. Our study exemplified that it is worthwhile developing MRS methods such as 31P MRS of the breast [8] that are able to detect GPC and PC individually for detecting the response to chemotherapy.Conclusions
The choline metabolite concentrations of GPC and PC and the PC/GPC ratio and particularly GPC may serve as non-invasive surrogate makers of therapeutic response in breast cancer patients undergoing chemotherapy with doxorubicin, paclitaxel, vinorelbine, melphalan, cisplatin and/or 5-FU.Acknowledgements
This work was supported by NIH R01 CA213428. We thank all members of the Division of Cancer Imaging Research in The Russell H. Morgan Department of Radiology and Radiological Science for their help and support.References
[1] Bolan PJ: Magnetic resonance spectroscopy of the breast: current status. Magnetic resonance imaging clinics of North America 2013, 21(3):625-639.
[2] Hyeon-Man B, Jeon-Hor C, Ke N, Hon JY, Shadfar B, Rita SM, Orhan N, Min-Ying S: Predicting Pathologic Response to Neoadjuvant Chemotherapy in Breast Cancer by Using MR Imaging and Quantitative 1H MR Spectroscopy. Radiology 2009, 251(3):653-662.
[3] Sina M, Patrick JB, Eva HB, Robin LB, Evin G, Lenore IE, Michael TN, Tim HE, Todd MT, Douglas Y et al: Neoadjuvant Chemotherapy of Locally Advanced Breast Cancer: Predicting Response with in Vivo 1H MR Spectroscopy Pilot Study at 4 T. Radiology 2004, 233(2):424-431.
[4] Cao MD, Dopkens M, Krishnamachary B, Vesuna F, Gadiya MM, Lonning PE, Bhujwalla ZM, Gribbestad IS, Glunde K: Glycerophosphodiester phosphodiesterase domain containing 5 (GDPD5) expression correlates with malignant choline phospholipid metabolite profiles in human breast cancer. NMR in biomedicine 2012, 25(9):1033-1042.
[5] Stewart JD, Marchan R, Lesjak MS, Lambert J, Hergenroeder R, Ellis JK, Lau CH, Keun HC, Schmitz G, Schiller J et al: Choline-releasing glycerophosphodiesterase EDI3 drives tumor cell migration and metastasis. Proc Natl Acad Sci U S A 2012, 109(21):8155-8160.
[6] Glunde K, Raman V, Mori N, Bhujwalla ZM: RNA interference-mediated choline kinase suppression in breast cancer cells induces differentiation and reduces proliferation. Cancer Research 2005, 65(23):11034-11043.
[7] Aboagye EO, Bhujwalla ZM: Malignant transformation alters membrane choline phospholipid metabolism of human mammary epithelial cells. Cancer Res 1999, 59(1):80-84.
[8] Wijnen JP, van der Kemp WJ, Luttje MP, Korteweg MA, Luijten PR, Klomp DW: Quantitative 31P magnetic resonance spectroscopy of the human breast at 7 T. Magnetic resonance in medicine 2012, 68(2):339-348.
Figures