0800
Quantitative Magnetic Resonance Imaging of the Human Brain with White Matter Hyperintensities: a New Approach towards Understanding the Underlying Pathology1Institute of Neuroscience and Medicine - 4 (INM-4), Research Centre Juelich, Juelich, Germany, 2Institute of Neuroscience and Medicine - 1 (INM-1), Research Centre Juelich, Juelich, Germany, 3Georgian Technical University (GTU), Tbilisi, Georgia, 4Jülich Aachen Research Alliance (JARA), Juelich, Germany
Synopsis
The interest in white matter hyperintensities (WMHs) has increased recently as they have been associated with various clinical disorders such as stroke and dementia. Although postmortem histopathological studies reported various underlying pathophysiological mechanisms, in vivo studies have not been specific enough to conform those results. We attempted to fill this gap with quantitative MRI of water content, T1, T2*, and MT parameters. These parameters were analyzed for white and grey matter globally and for manually segmented WMHs. Based on the changes identified for WMHs and their trend with WMH load, we were able to complement histopathological findings.
Introduction
While white matter hyperintensities (WMHs) have been considered as incidental and harmless findings in magnetic resonance imaging (MRI), they became a target of interest for numerous studies during the past two decades as they are considered to be an MR biomarker for small vessel disease1. Several visual scales have been proposed to assess the severity of the lesions and divide them into deep (DWMHs) and periventricular WMHs (PWMHs) 2. The Fazekas scale is the most common one3. Scientific papers have reported the link between the load of WMHs and high risk of stroke and Alzheimer’s disease development1, 4, 5. Furthermore, Kim et al. argued in favor of further differentiating the WMHs according to functional relevance, as PWMHs have been associated with cognitive impairment, and DWMHs with mood disorders preferentially6. Histopathological studies revealed axonal loss, demyelination, disruption of ependyma, and fluid accumulation as contributing factors for WMHs development7, 8. In vivo imaging studies have focused on evaluating the volume of lesions as a risk factor for other disorders. Although most studies report a clinical significance of the pathology, there is currently no information available about the quantitative MRI (qMRI) properties of WMHs.
The aim of this study was to calculate and analyze the qMRI parameters of WMHs, grey (GM) and white matter (WM) of the subjects with these lesions, in order to unravel the pathology behind it non-invasively. Additionally, we used the Fazekas scale to assess changes of qMRI values with WMH load.
Methods
A sample of 20 subjects (11 females) with varying WMH load was drawn from the 1000BRAINS project database, an epidemiological and neuroscientific study of an elderly cohort9 with an extensive 3T imaging. The mean age was 68±6.62 years. The quantitative protocol was based on four 3D multi-echo gradient echo (meGRE) acquisitions (two including an off-resonance MT preparation) and one actual flip angle (AFI) scan10. T2-weighted FLAIR sequences were also acquired. The calculated quantitative maps characterised free water content (H2O), longitudinal and transverse relaxation times T1 and T2*, macromolecular bound proton fraction (fbound), and magnetization transfer ratio (MTR). All images were co-registered to the T1_IXI555_MNI152 template and classified as grey matter (GM), normal appearing white matter (NAWM) and cerebrospinal fluid (CSF) using SPM12 software 11, 12.
Subjects were divided into four groups based on severity of WMHs using the Fazekas scale, starting form grade 0 (no WMHs) to grade 3 (severe WMHs) 3. Five age and gender matched subjects were included in each group. WMHs masks were created manually using FLAIR in ITK-snap3.4.0 software13. Additionally, lesions were divided into the DWMHs and PWMHs. In grade 1 it was done visually, while in grade 2 and 3, as the lesions become confluent, we used 10 mm distance from the lateral ventricles as a criterion for classification2, 14. We applied binary masks to the maps and calculated the mean values and standard deviations of all quantitative parameters for GM, NAWM, DWMHs and PWMHs for each subject. The significance of the differences was assessed using student t-test between the group pairs with p<0.05.
Results
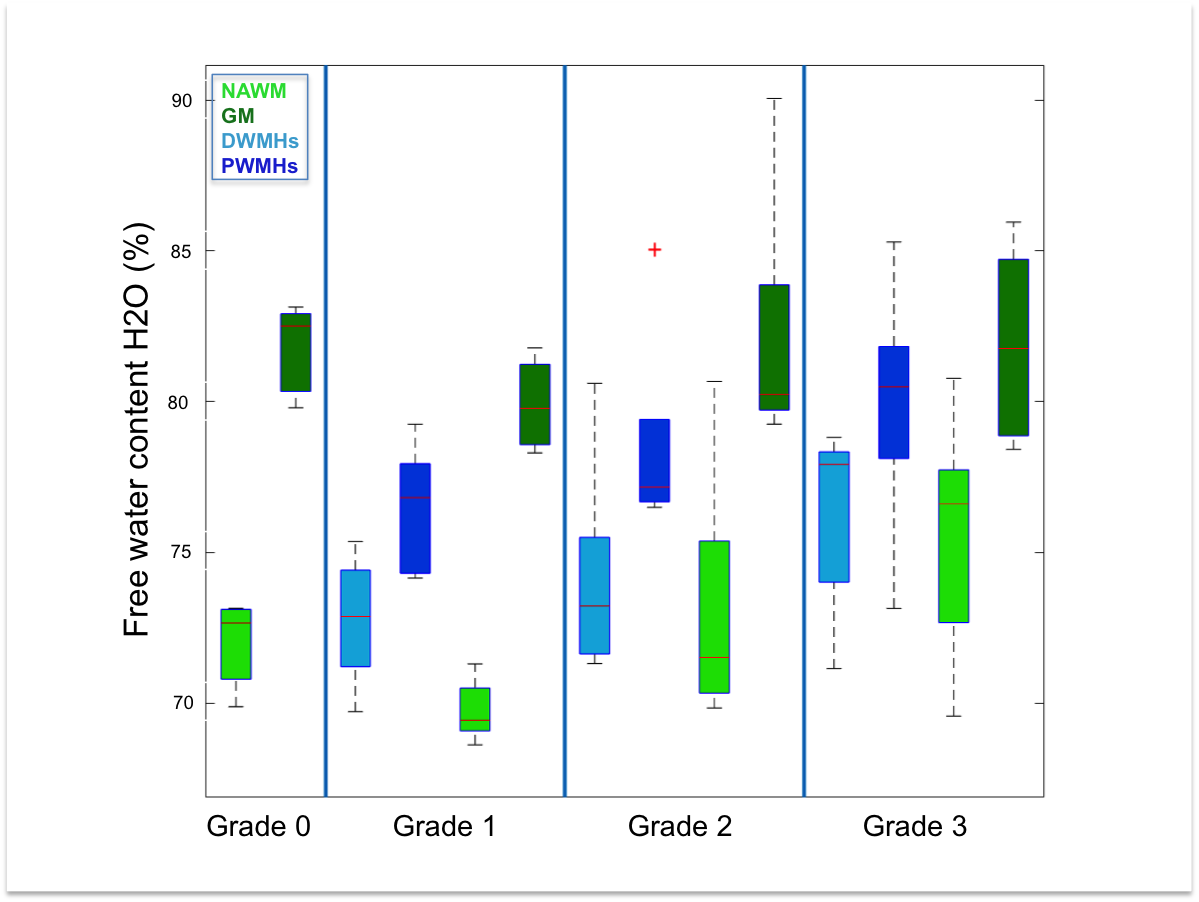
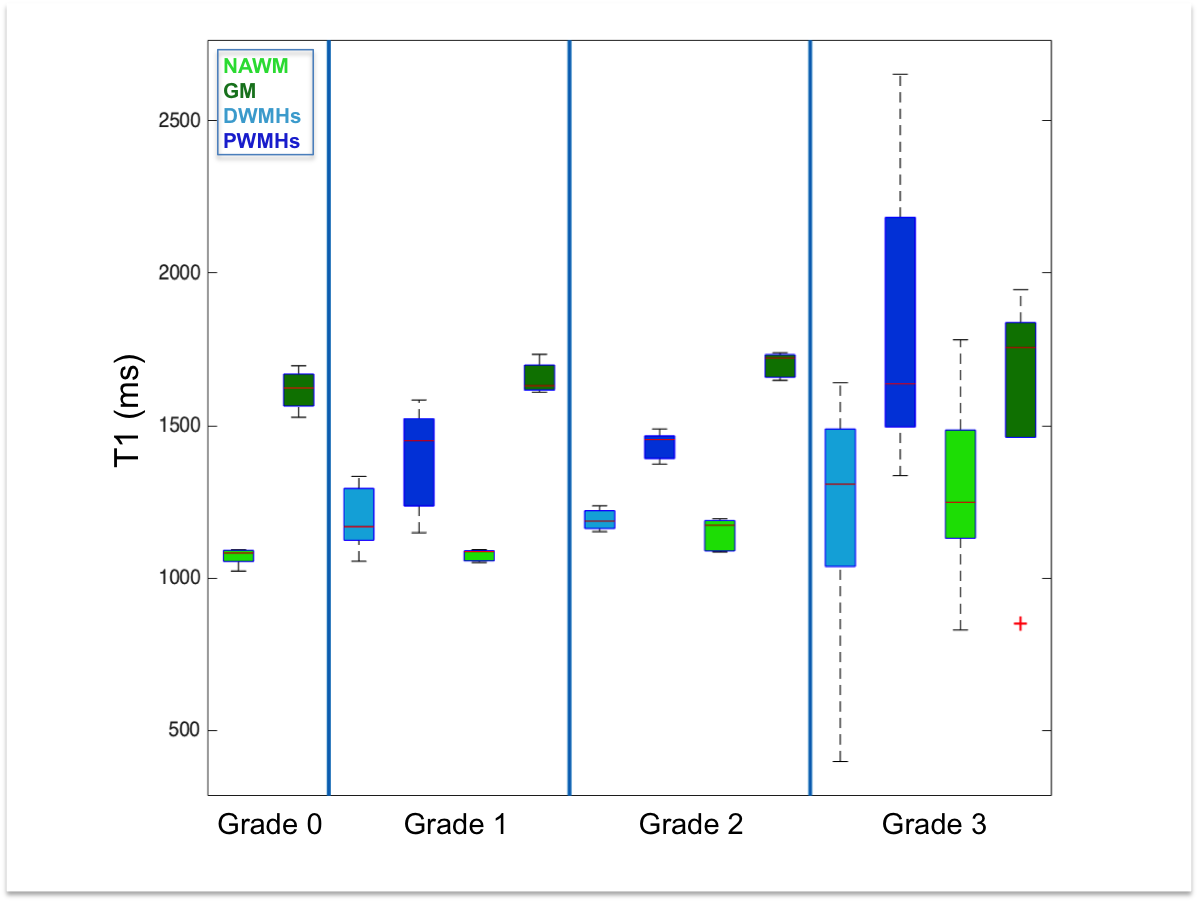
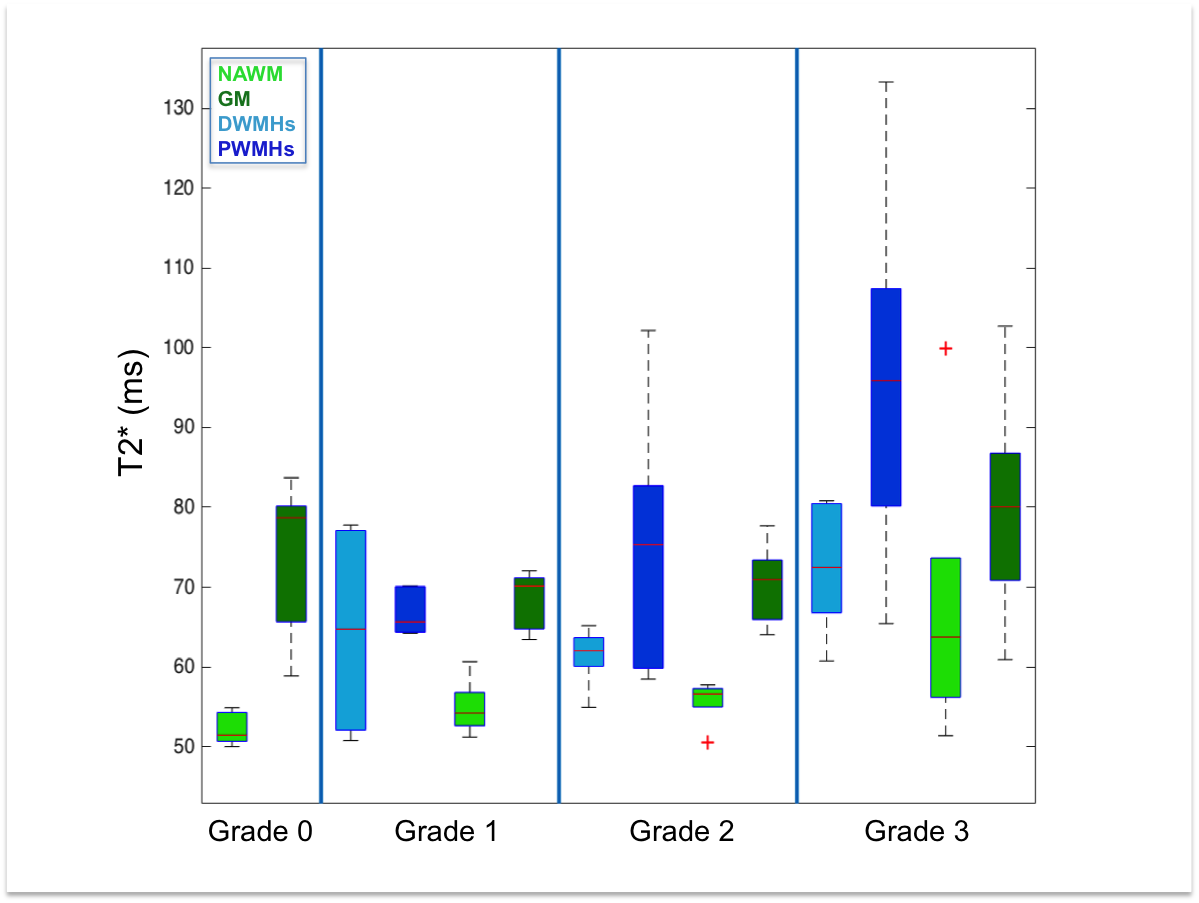
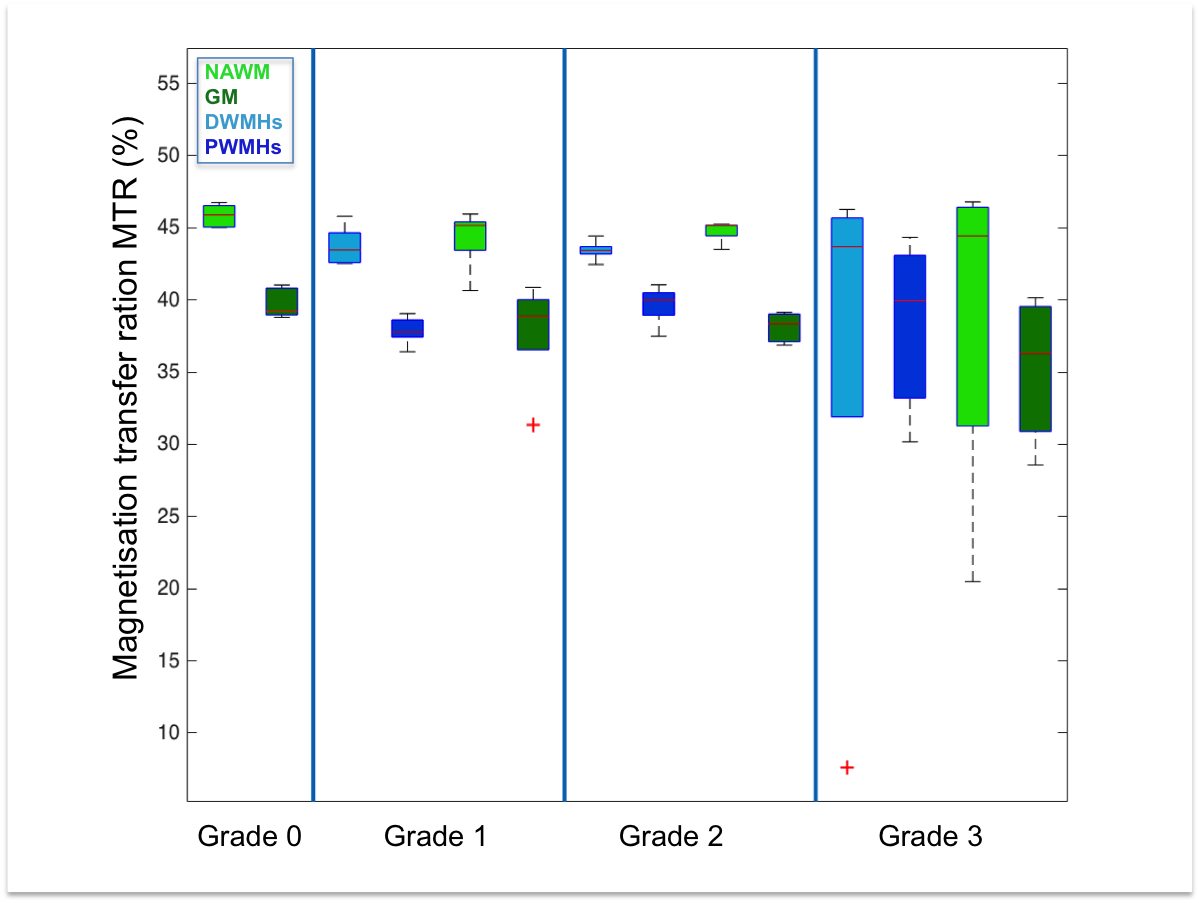
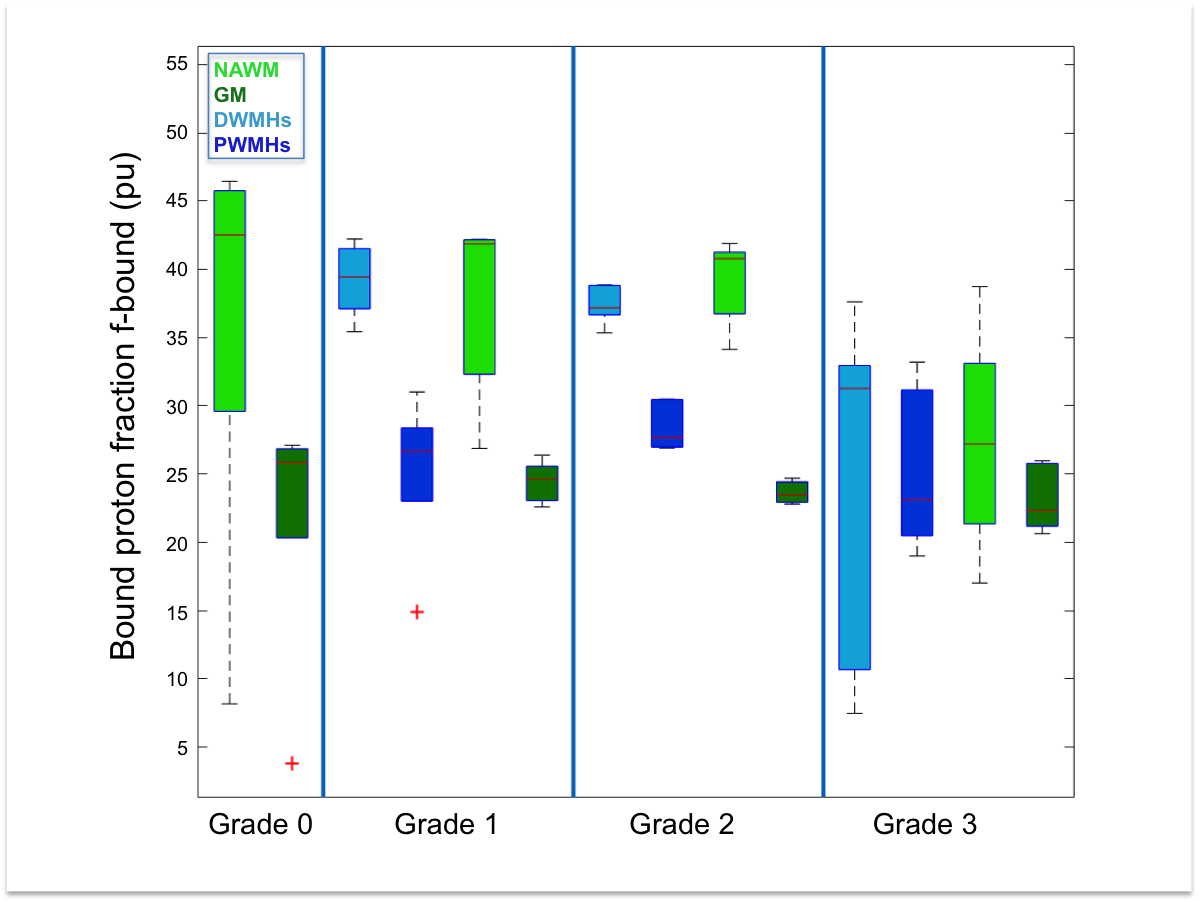
Both DWMHs and PWMHs demonstrated altered values of all parameters compared to NAWM. T1, T2*, and H2O were increased in the lesions and PWMHs showed larger changes than DWMHs. Fbound and MTR showed the opposite behavior.
Additionally, the trend of changes in qMRI values followed the Fazekas grading. NAWM also showed higher values in grade 2 and 3, while all parameters of GM remained normal (cf. Figure 1-5).
Discussion
Our study demonstrates the ability of qMRI parameters to differentiate between NAWM, GM, DWMHs and PWMHs. Postmortem studies have reported different pathological mechanisms underlying DWMHs and PWMHs. Disruption of the ependymal lining, resulting in leakage of CSF in the parenchyma has been associated with PWMHs, while demyelination and astrogliosis, contributed in the development of DWMHs preferably7, 15. Higher T1, T2*, H20 and lower MTR, fbound in WMHs suggest myelin loss. The same trend in DWMHs and NAWM according to severity supports the demyelination hypothesis. However, in PWMHs H2O, T1 and T2* are increased without change of MT parameters, proposing the liquid accumulation due to CSF leakage as underlying pathology following the Fazekas grading.Conclusion
Our study is the first to report qMRI parameters of WMHs, as well as in NAWM, corresponding to severity of the disorder. Importantly, we were able to distinguish between DWMHs and PWMHs based on the altered H2O, T1, T2*, fbound and MTR and conform the histopathological findings non-invasively.
In the future, we hope to increase the number of subjects and correlate the findings with relevant clinical variables.
Acknowledgements
This work is funded in part by the Helmholtz Alliance ICEMED - Imaging and Curing Environmental Metabolic Diseases, through the Initiative and Network Fund of the Helmholtz Association.References
1. Debette, S., & Markus, H. S. The clinical importance of white matter hyperintensities on brain magnetic resonance imaging: systematic review and meta-analysis. Bmj 2010; 341(jul26 1), c3666–c3666.
2. Griffanti, L., Jenkinson, M., Suri, S., Zsoldos, E., Mahmood, A., Filippini, N., … Zamboni, G. Classification and characterization of periventricular and deep white matter hyperintensities on MRI: A study in older adults. NeuroImage 2017.
3. Fazekas, F., Chawluk, J. B., Alavi, A., Hurtig, H. I., & Zimmerman, R. A. Mr Signal Abnormalities At 1.5-T in Alzheimer Dementia and Normal Aging. American Journal of Roentgenology 1987; 149(2), 351–356.
4. Prins, N. D., & Scheltens, P. White matter hyperintensities, cognitive impairment and dementia: an update. Nature Reviews Neurology 2015; 11(3), 157–165.
5. Wardlaw, J. M., Valdés Hernández, M. C., & Muñoz-Maniega, S. What are white matter hyperintensities made of? Relevance to vascular cognitive impairment. Journal of the American Heart Association 2015; 4(6), 1140.
6. Kim, K. W., Macfall, J. R., & Payne, M. E. Classification of whitte matter lesions on magnetic resonance imaging in the elderly. Biological Psychiatry 2008; 64(4), 273–280.
7. Gouw, A. A., Seewann, A., van der Flier, W. M., Barkhof, F., Rozemuller, A. M., Scheltens, P., & Geurts, J. J. G. Heterogeneity of small vessel disease: a systematic review of MRI and histopathology correlations. Journal of Neurology, Neurosurgery & Psychiatry 2011; 82(2), 126–135.
8. Fazekas, F., Kleinert, R., Offenbacher, H., Schmidt, R., Kleinert, G., Payer, F., … Lechner, H. Pathologic correlates of incidental MRI white matter signal hyperintensities. Neurology 1993; 43(9), 1683–9.
9. Caspers, S., Moebus, S., Lux, S., Pundt, N., Schütz, H., Mühleisen, T. W., … Amunts, K. Studying variability in human brain aging in a population-based German cohort-rationale and design of 1000BRAINS. Frontiers in Aging Neuroscience 2014; 1–14.
10. Schall, M., Zimmermann, M., Iordanishvili, E., Gu, Y., Shah, N.J., Oros-Peusquens, A.-M., Quantitative In Vivo Imaging Using a 3D Two-Point Method, Magn Reson Mater Phy (2017), abstract ID 247
11. J. Ashburner and K.J. Friston. Unified segmentation. NeuroImage 2005; 26:839-851.
12. J. Ashburner and K.J. Friston. Diffeomorphic registration using geodesic shooting and Gauss--Newton optimisation.NeuroImage 2011; 55(3):954-967.
13. Paul A. Yushkevich, Joseph Piven, Heather Cody Hazlett, Rachel Gimpel Smith, Sean Ho, James C. Gee, and Guido Gerig. User-guided 3D active contour segmentation of anatomical structures: Significantly improved efficiency and reliability. Neuroimage 2006; 31(3):1116-28.
14. DeCarli, C., Fletcher, E., Ramey, V., Harvey, D., Jagust, W.J., et al. Anatomical mapping of white matter hyperintensities (WMH): exploring the relationships between periventricular WMH, deep WMH, and total WMH burden. Stroke 2005; 36, 50–55.
15. Grafton ST, Sumi SM, Stimac GK, et al. Comparison of postmortem magnetic resonance imaging and neuropathologic findings in the cerebral white matter. Arch Neurol 1991;48:293e8.
Figures