0799
Consensus acquisition protocol for quantitative MRI of the cervical spinal cord at 3T1NeuroPoly Lab, Polytechnique Montreal, Montreal, QC, Canada, 2MR Clinical Science, Philips Healthcare, Gainesville, FL, United States, 3Queen Square MS Centre, UCL Institute of Neurology, Faculty of Brain Sciences, University College London, London, United Kingdom, 4Brain MRI 3T Research Centre, C. Mondino National Neurological Institute, Pavia, Italy, 5Department of Brain and Behavioural Sciences, University of Pavia, Pavia, Italy, 6Centre for Medical Image Computing, Department of Computer Science, University College London, London, United Kingdom, 7Department of Surgery, University of Toronto, Toronto, ON, Canada, 8VisAGeS team, INRIA (INSERM, CNRS, Rennes 1 University), Rennes, France, 9Department of Radiology, Rennes University Hospital, Rennes, France, 10Centre de Résonance Magnétique Biologique et Médicale (CRMBM), UMR 7339, CNRS Aix-Marseille Université, Marseille, France, 11Vanderbilt University Institute of Imaging Science, Vanderbilt University Medical Center, Nashville, TN, United States, 12Translational and Molecular Imaging Institute, Department of Radiology, Icahn School of Medicine at Mount Sinai, New York, NY, United States, 13Department of Electrical and Computer Engineering, The Johns Hopkins University, Baltimore, MD, United States, 14Department of Anesthesiology, Perioperative and Pain Medicine, Stanford University School of Medicine, Palo Alto, CA, United States, 15Department of Radiology, Northwestern Feinberg School of Medicine, Chicago, IL, United States, 16Biospective, Inc., Montreal, QC, Canada, 17Department of Neuroimaging, Institute of Psychiatry, Psychology & Neuroscience, King's College London, London, United Kingdom, 18Department of Neurology, University of California San Francisco, San Francisco, CA, United States, 19Department of Neurophysics, Max Planck Institute, Leipzig, Germany, 20Spinal Cord Injury Center Balgrist, Balgrist University Hospital, Zurich, Switzerland, 21Wellcome Trust Centre for Neuroimaging, UCL Institute of Neurology, University College London, London, United Kingdom, 22Department of Brain Repair and Rehabilitation, UCL Institute of Neurology, University College London, London, United Kingdom, 23Harvard-MGH Martinos Center for Biomedical Imaging, Charlestown, MA, United States, 24Montreal Neurological Institute, McGill University, Montreal, QC, Canada, 25Functional Neuroimaging Unit, CRIUGM, University of Montreal, Montreal, QC, Canada
Synopsis
We present a consensus recommendation for best practices in high quality data acquisition of quantitative MRI (qMRI) of the cervical spinal cord at 3T. We propose protocols for computing cross-sectional area (CSA), magnetization transfer ratio (MTR) and diffusion tensor imaging (DTI) from three main vendors. We demonstrate these protocols by repeated scans of a single subject, from which the data and analysis scripts are made available. We hope harmonized and publicly-available spinal cord imaging protocols will promote reproducibility and thus accelerate the progress for spinal cord measurements to be more widely accepted as MRI biomarkers in multicenter studies.
Purpose
Spinal cord imaging, a traditionally challenging area, has gained major improvements over the years, including tailored coil arrays and advanced pulse sequences. Researchers new to the field often face difficulties in choosing appropriate sequences and parameters for their needs. We propose a consensus 3T acquisition protocol for a range of sequences and contrasts useful in cervical spinal cord imaging as a template for further customization by individual researchers.Methods
Protocol. The consensus acquisition protocol was designed and tested on 3T systems (GE, Philips and Siemens) using product neck coils. Pdf and importable files for each vendor can be downloaded at https://osf.io/tt4z9/. An SOP is also available. The current protocol is designed for the cervical cord, but in the future we will extend it to the thoraco-lumbar spine. All protocols used product sequences and were named according to the Brain Imaging Data Structure (BIDS) recommendation1. The requirement for specific license (e.g., Siemens ZOOMit) is indicated in the file “license.txt” within each folder. In the future we will cover alternative protocols with/without specific license.
- T1w: sagittal, 1mm isotropic voxel size, IR-FSPGR/BRAVO (GE), 3D T1TFE (Philips), MPRAGE (Siemens). Usage: cord CSA, registration to template.
- T2w: sagittal, 0.8mm isotropic, CUBE (GE), VISTA (Philips), SPACE (Siemens). Usage: cord CSA, registration to template, nerve root identification.
- DWI: axial, FOCUS (GE), Zoom Diffusion (Philips), ep2d_diff ZOOMit (Siemens) 0.9x0.9x5mm3, cardiac gating, b=800, 64 (GE) or 30 (Siemens/Philips) directions. Usage: DTI or other diffusion models.
- GRE-MT1, GRE-MT0 and GRE-T1w: axial, 0.9x0.9x5mm3, SPGR (GE), FFE (Philips), GRE (Siemens). Usage: MTR or MTsat.
- GRE-ME: 0.5x0.5x3mm3, MERGE (GE), mFFE (Philips), Medic (Siemens). Usage: gray matter CSA.
Acquisition. For this proof-of-concept study, data were acquired in a single subject (male, 28 years old) on the GE 750, Philips Achieva and Siemens Prisma systems. Processing. The data were preprocessed in the native space and then registered to the PAM50 spinal cord template2 using Spinal Cord Toolbox3. All data and processing scripts are available at: https://osf.io/wukn4/. Quantification. The cross-sectional area (CSA) was extracted from T1w and T2w scans following automatic cord segmentation4 and then averaged within each vertebral level. The gray matter CSA was extracted from the GRE-ME scan following automatic gray matter segmentation5 and then averaged within each vertebral level. The PAM50 template includes a probabilistic atlas of white matter tracts6, which was used to extract quantitative MT and DTI metrics (fractional anisotropy, FA).
Results
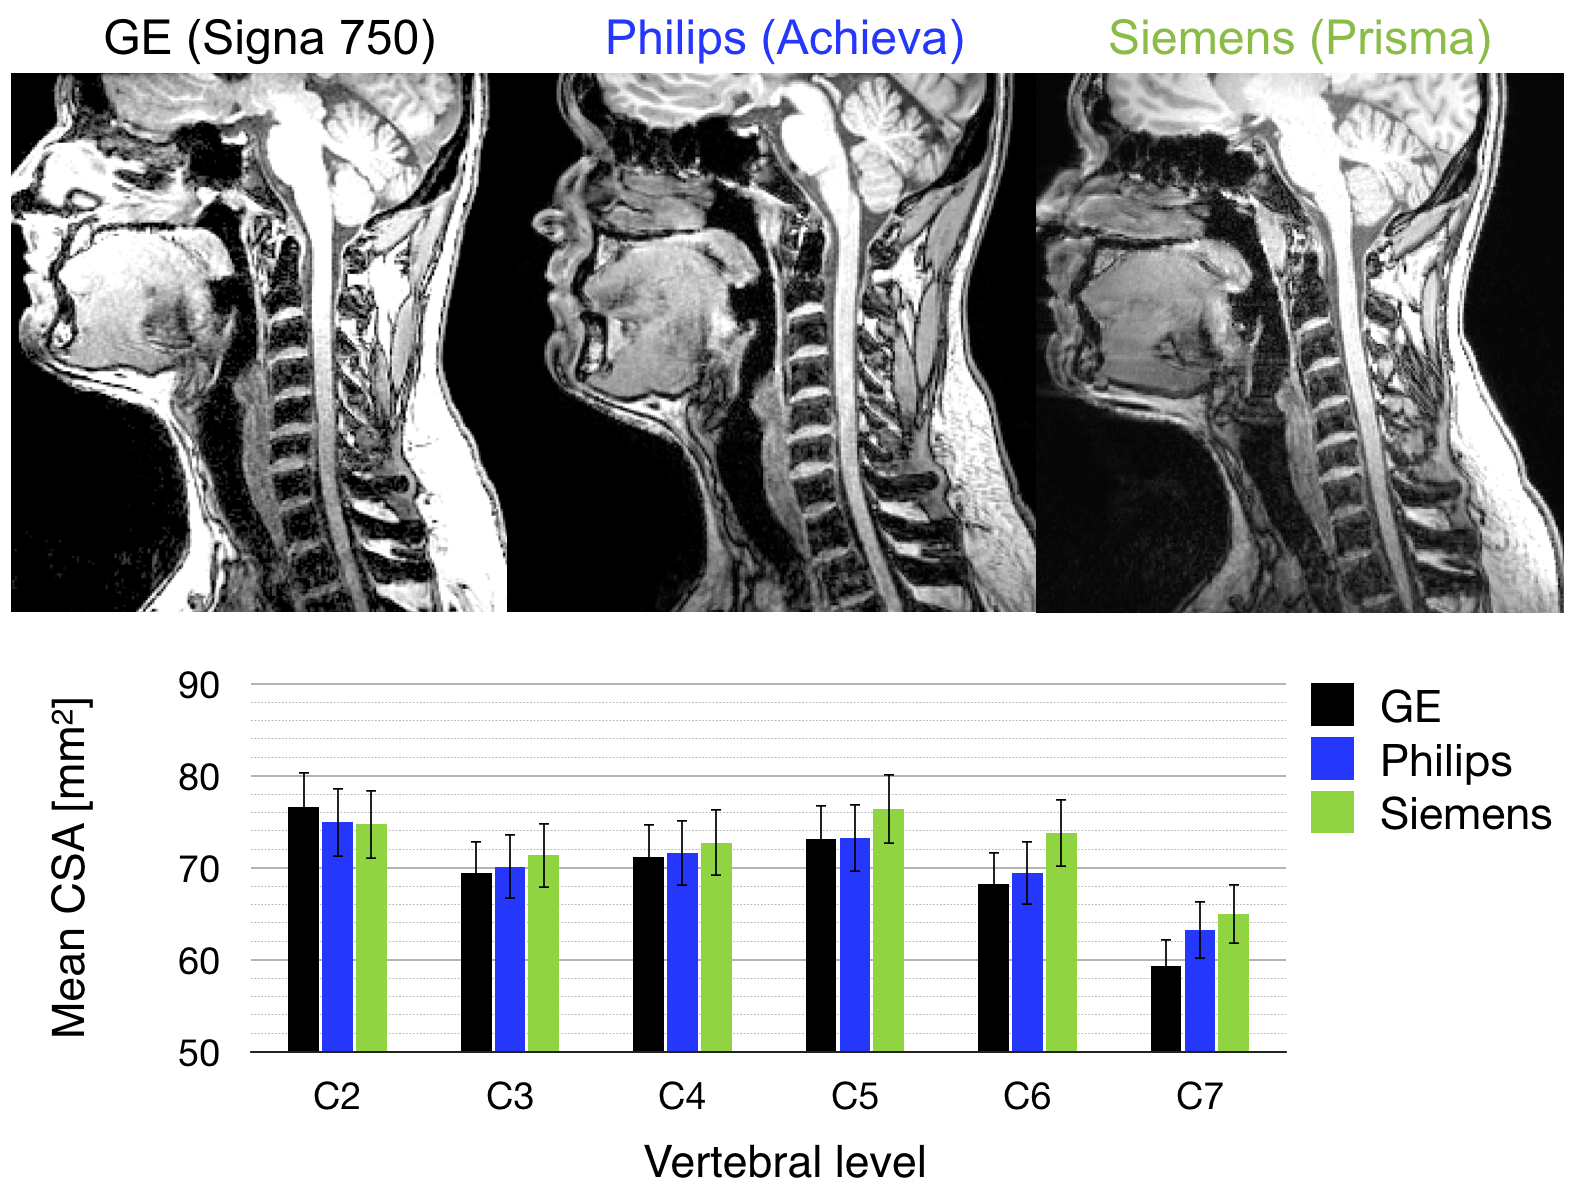
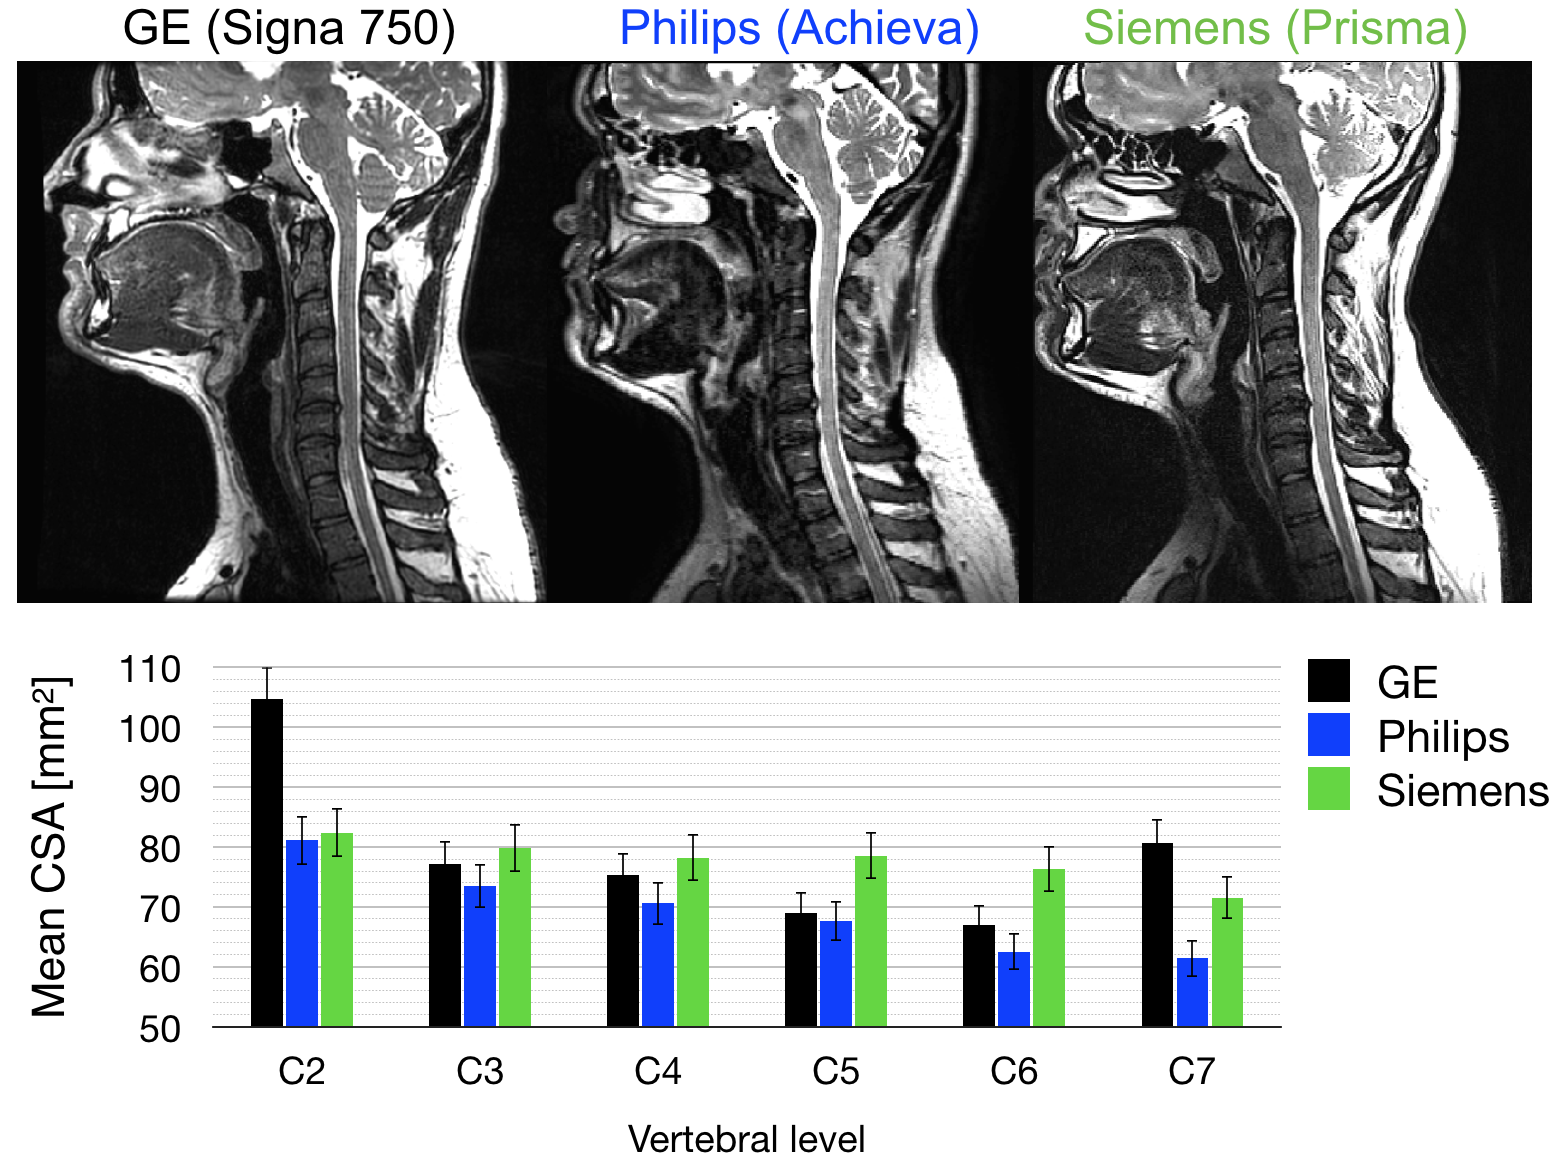
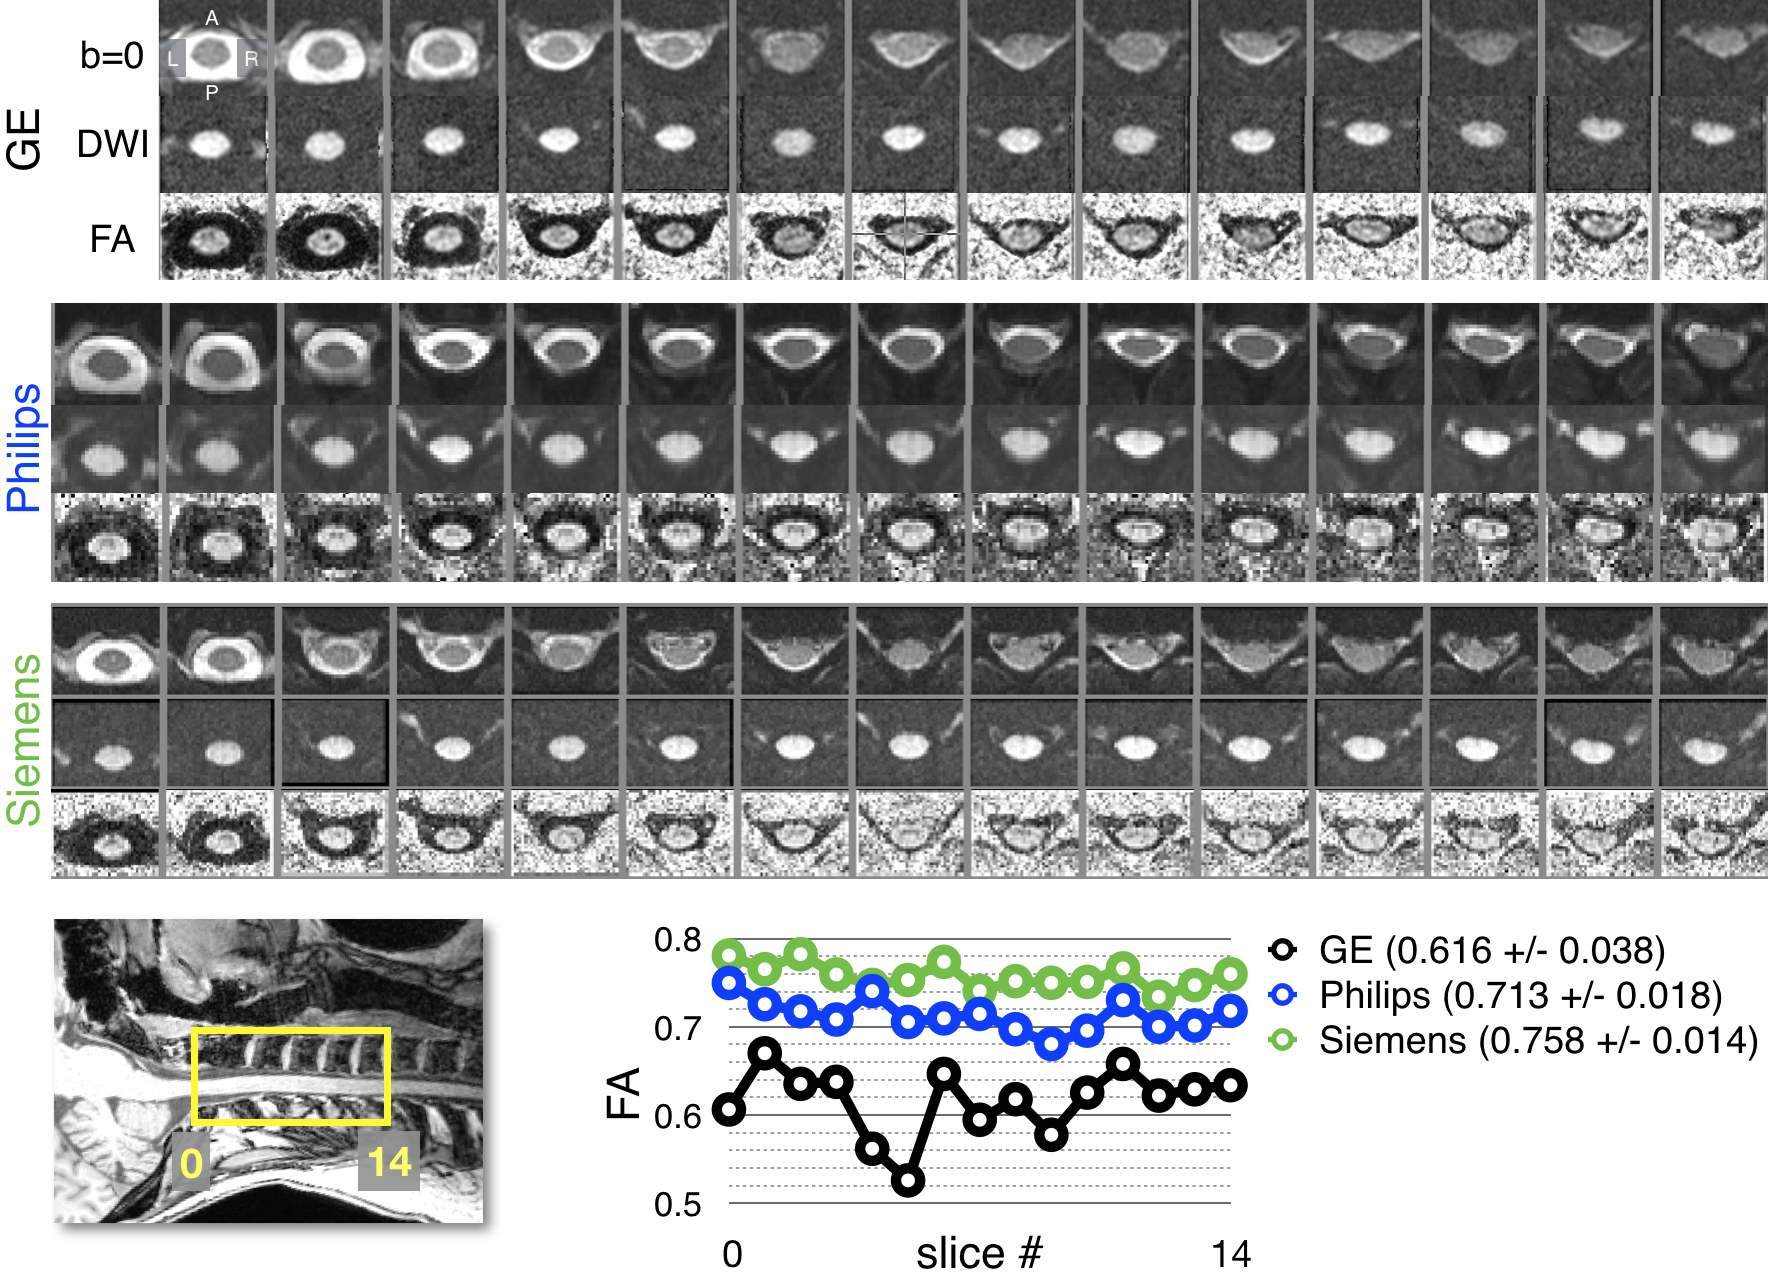
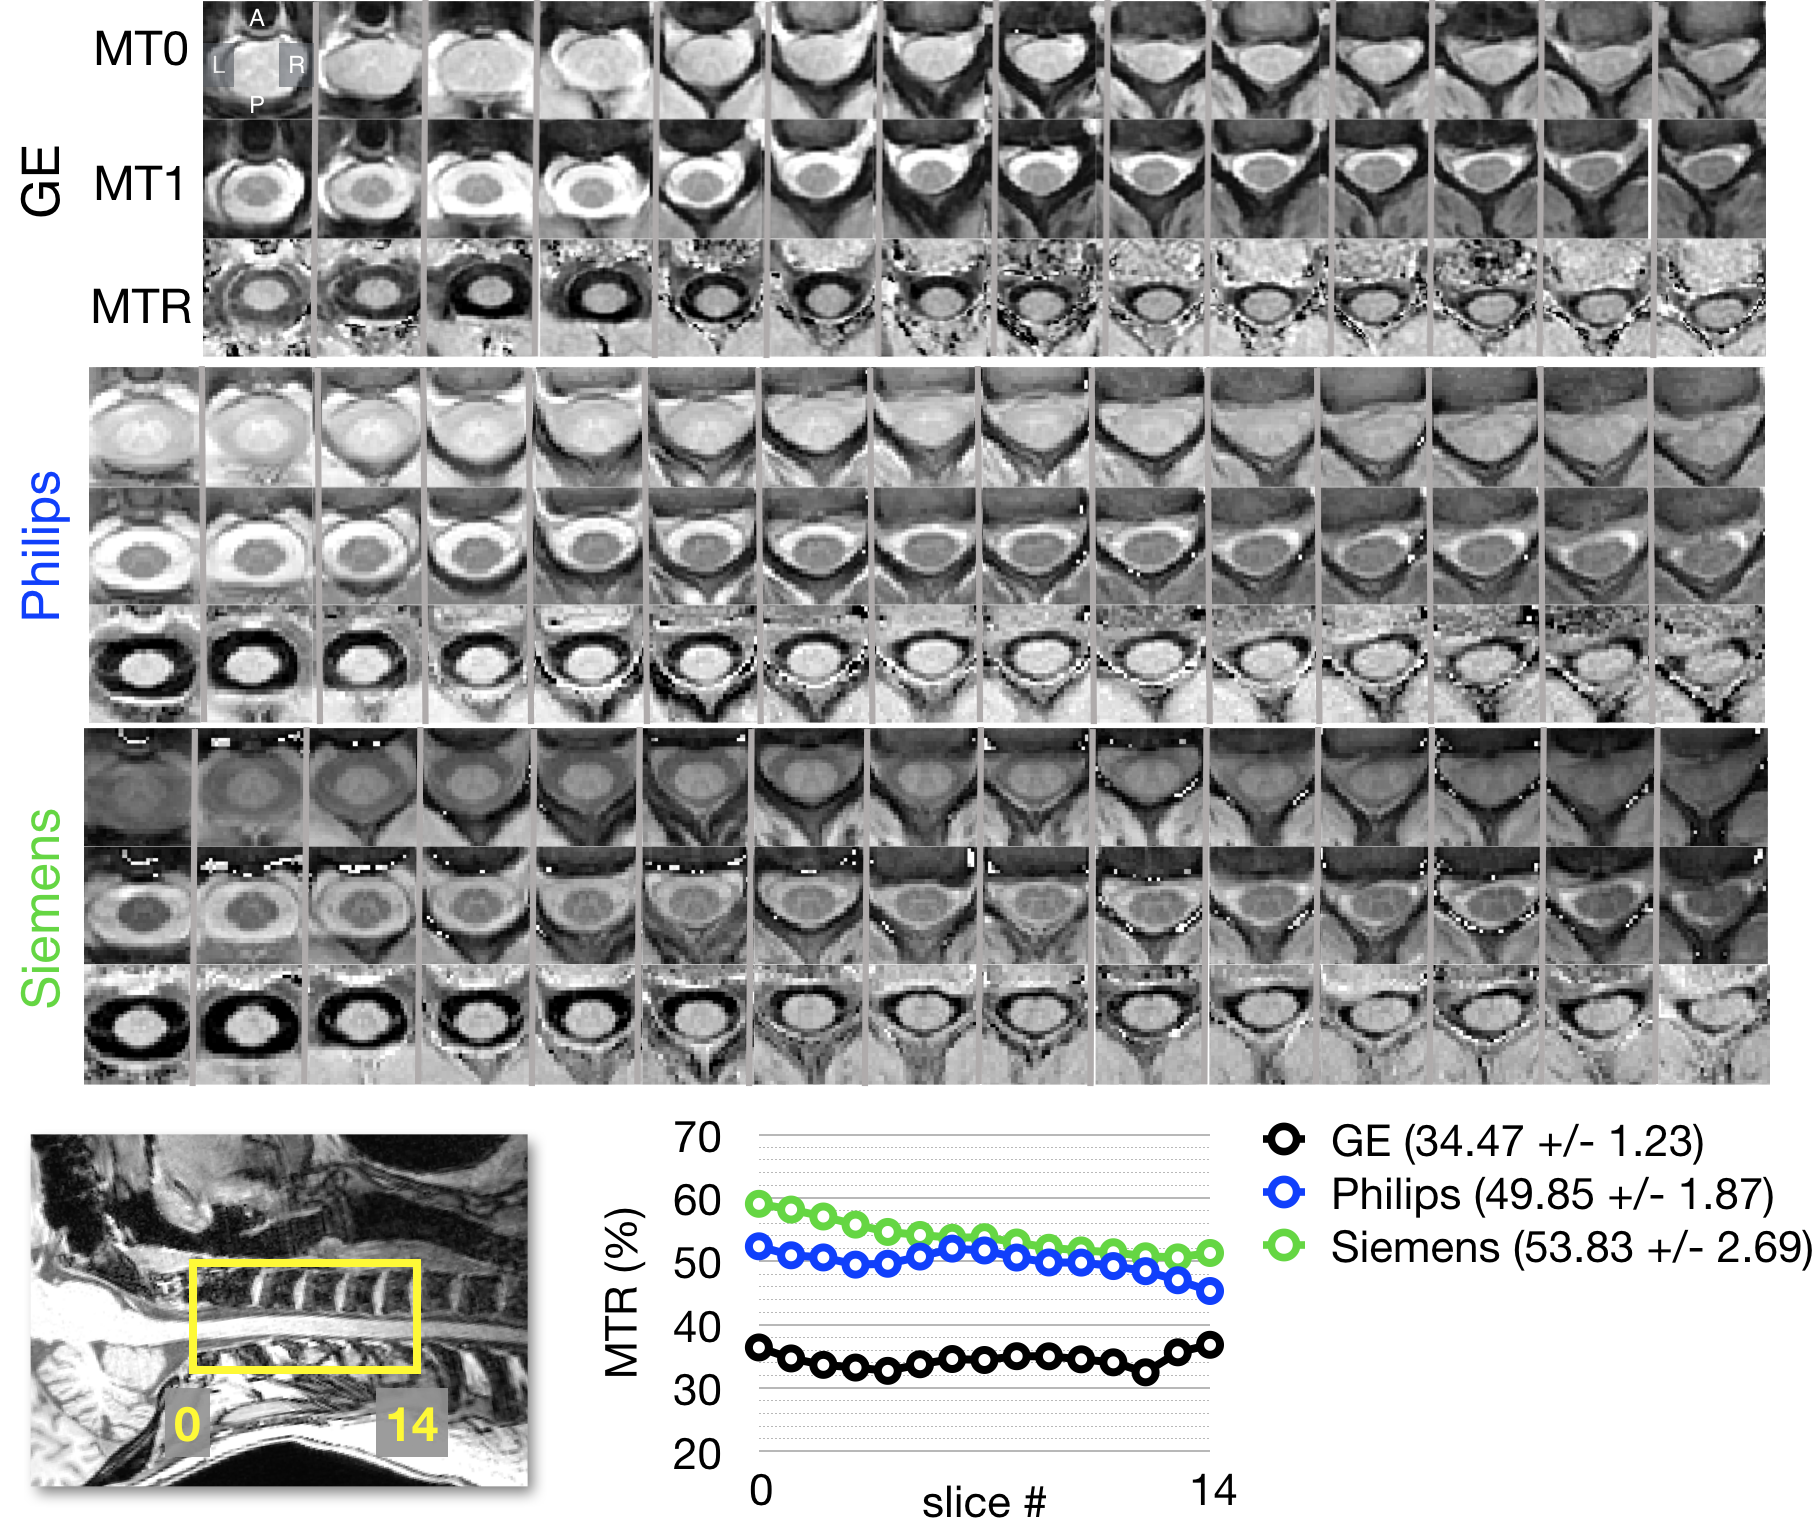
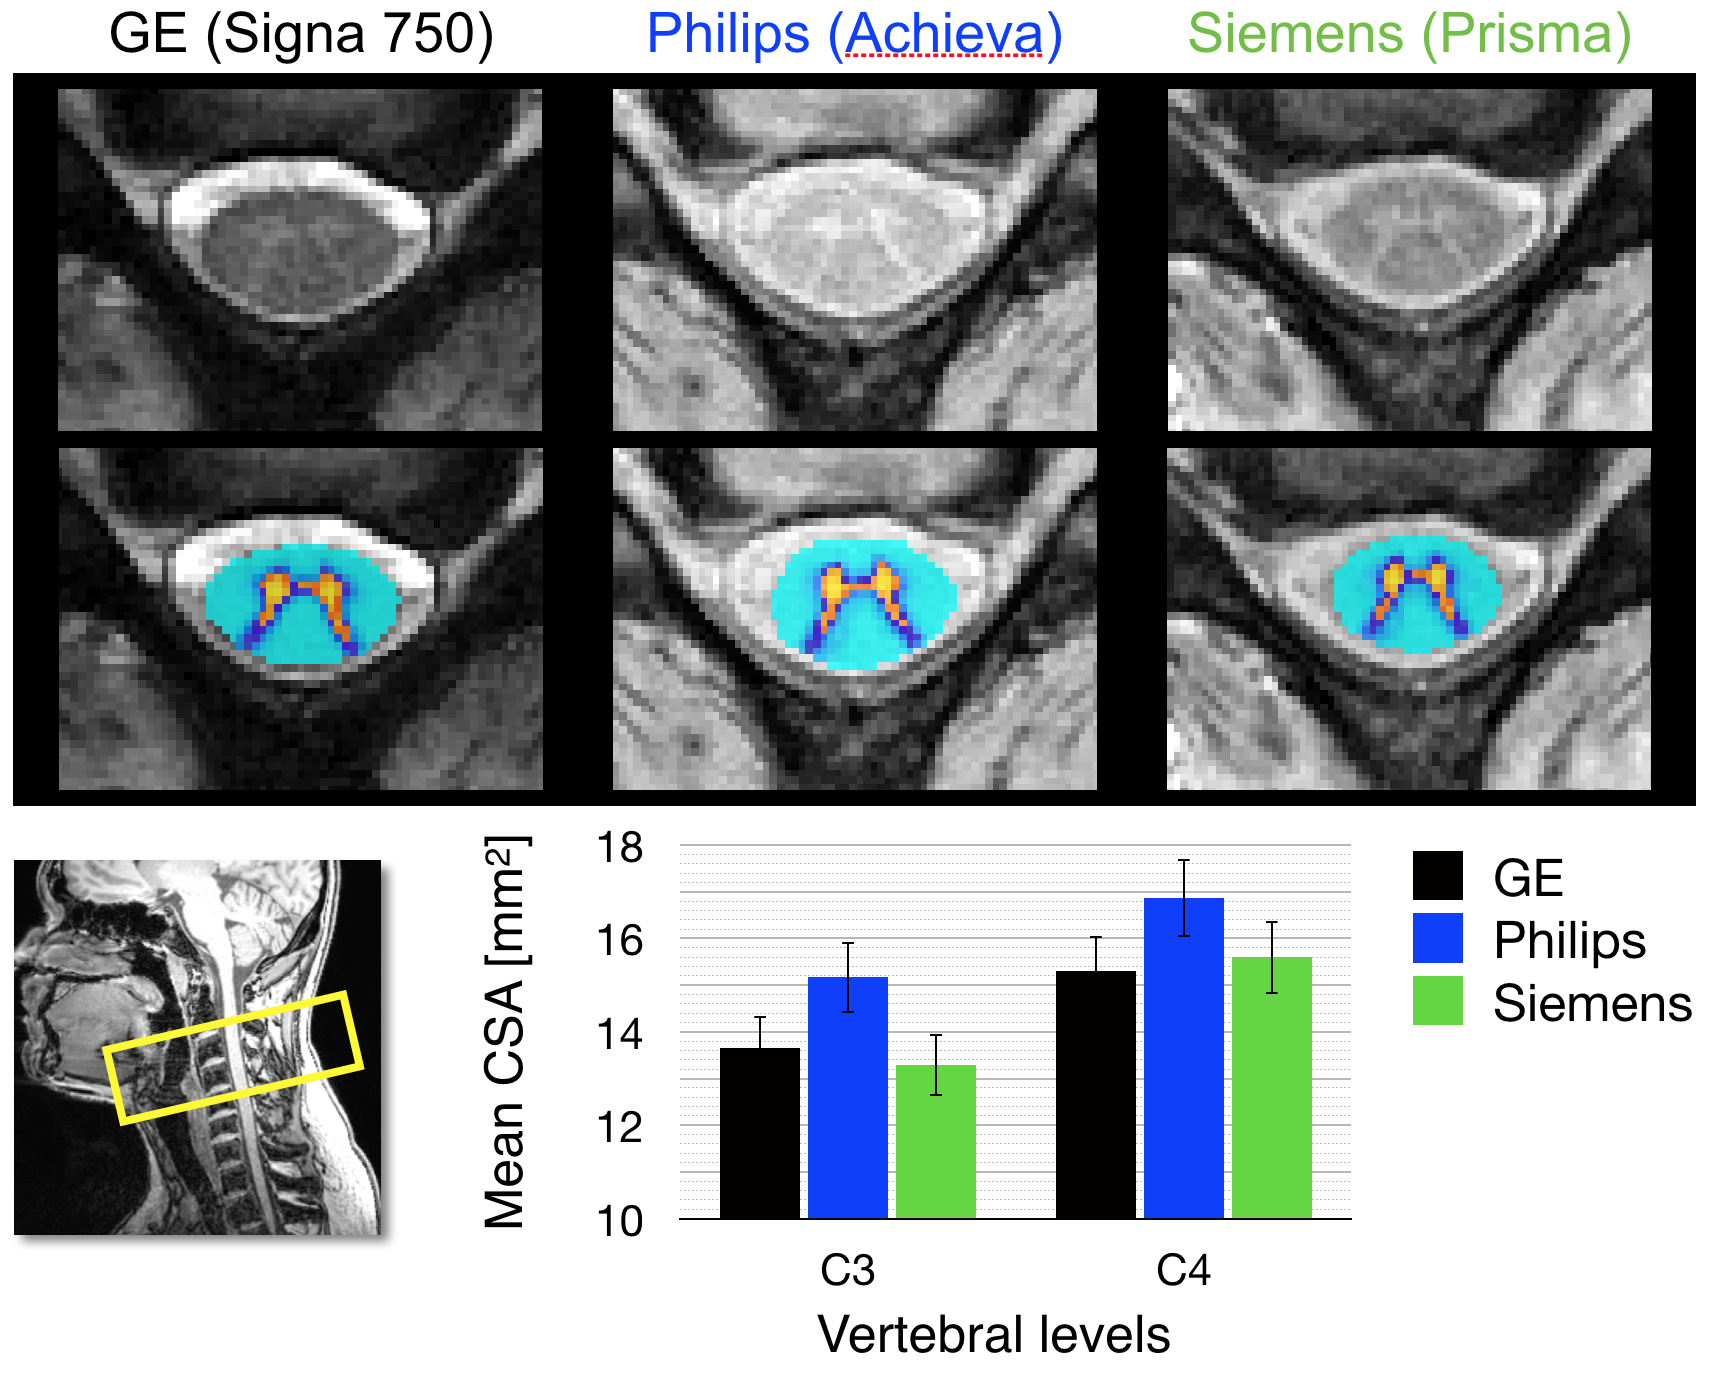
The mean CSA per vertebral level is shown for levels C2 to C7 across platforms for T1w images (Figure 1) and for T2w images (Figure 2). The measurements from the T1w images are in agreement for all three platforms. The CSA values extracted from the T2w images are also consistent, although more inter-site variability is observed. Figure 3 examines FA values along the cervical cord across all platforms. Overall, Siemens and Philips systems are in agreement and consistent across slices, but GE values exhibit lower FA. Figure 4 compares the MTR value along a portion of the cervical cord for each of the three platforms. The results for Siemens and Philips are comparable, while the metric value calculated for the GE acquisition is somewhat reduced. Figure 5 shows GRE-ME images with an overlay of automatic gray matter segmentation and gray matter CSA measurements for C3 and C4.Discussion and conclusion
We demonstrate the design and use of a consensus c-spine acquisition protocol across different platforms in this preliminary study. We extracted multiple qMRI metrics from a single subject and show a degree of overall consistency between the platforms; however, further optimization is still required. In particular, inter-site discrepancies in the CSA measures from the T2w scan might be mitigated by aiming for more similar cord/CSF contrast (e.g., by adjusting TE). MTR variability can be caused by different MT pulses, fat saturation methods and the use of additional sat bands (which also create an MT effect) and thus could also be further standardized. Finally, the DTI protocol could be adjusted for each site in order to reach similar metric reliability. Due to inherent hardware differences (e.g., maximum gradient strength, receive coil coverage), the spatial resolution and/or number of diffusion directions could be adjusted for each platform in order to match the overall SNR. Despite these discrepancies, the results provide a promising foundation for expanding the study to include additional subjects and sites, which are necessary steps for deriving reliability and reproducibility measures.Acknowledgements
This study was funded by the Canada Research Chair in Quantitative Magnetic Resonance Imaging (JCA), the Canadian Institute of Health Research [CIHR FDN-143263], the Canada Foundation for Innovation [32454, 34824], the Fonds de Recherche du Québec - Santé [28826], the Fonds de Recherche du Québec - Nature et Technologies [2015-PR-182754], the Natural Sciences and Engineering Research Council of Canada [435897-2013], the Quebec BioImaging Network, the EPSRC (EP/M020533/1; CMIC Pump-Priming Awards), Horizon2020-EU.3.1 (ref: 634541), UK MS Society, and NIHR Biomedical Research Centres (BRC R&D03/10/RAG0449). The authors would like to thank Ives Levesque (Glen Hospital, McGill University), the CHUM, Antonys Melek (PERFORM Center, Concordia University), the Unité de Neuroimagerie Fonctionnelle (UNF, CRIUGM) and Suchandrima Banerjee (GE Healthcare) for helping with data acquisition.References
[1] K. J. Gorgolewski, et al., Scientific Data, 2016. 3(160044). [2] B. De Leener, et al., NeuroImage, 2017. [3] B. De Leener, et al., NeuroImage, 2017. 145(Pt A): p. 24-43. [4] B. De Leener, et al., NeuroImage, 2014. 98: p. 528-536. [5] S.M. Dupont, et al., NeuroImage, 2017. 150: p. 358-372. [6] S Lévy, et al., NeuroImage, 2015. 119: p. 262-271.Figures