0797
Comparison of the Tofts and the Shutter Speed Model for DCE-MRI in patients with Brain Glioma1Department of Surgery and Cancer, Imperial College London, London, United Kingdom, 2Department of Computer, Control and Management Engineering Antonio Ruberti, La Sapienza University of Rome, Rome, Italy, 3Department of Imaging, Imperial College Healthcare NHS Trust, London, United Kingdom, 4Department of Medicine, Imperial College London, London, United Kingdom, 5Centre for Clinical Brain Sciences, The University of Edinburgh, Edinburgh, United Kingdom
Synopsis
DCE-MRI allows interrogation of patho-physiological insular micro-environments through the passage of contrast agents and model-based pharmacokinetic analysis. In this study, we analysed data from 14 patients with suspected primary glioma who underwent DCE-MRI. Using both the Tofts model and the shutter speed model (SSM), we evaluated the performance and variability of each extracted parameter. We then analysed the ability of the two models to discriminate between tumour and healthy tissue to test the differences between the two methods. Results showed higher performance for the SSM, with a high robustness for the mean capillary water molecule lifetime τi.
Abstract
Introduction
Dynamic contrast-enhanced (DCE) MRI allows tissue perfusion quantification with the acquisition of T1-weighted images before, during and after injection of a gadolinium-based contrast reagent (CR). Data is frequently modelled by the Tofts model (TM), which embeds the implicit assumption that equilibrium transcytolemmal water exchange is infinitely fast1. The effect of water exchange on the MRI signal amplitude is incorporated by the shutter speed model (SSM), which introduces a further pharmacokinetic parameter τi, the mean intracellular water lifetime2. The Tofts pharmacokinetic assumes a linear dependence of R1 on [CR]. However, tissue parenchyma cannot be considered as a single homogeneous solution. A voxel in MR will contain different tissue compartments which may affect the signal and are considered in the modification for the SSM3. We assess the robustness of the two methods by studying them in tumour lesions and contra-lateral white matter (CWM).
Methods
14 patients (7 male, 7 female; aged 23-73 years, mean 40 years) with suspected primary supratentorial glioma were recruited to this study. Ethical approval was given by the local ethics committee and informed consent was obtained from all patients. MR images were acquired on a 3T Siemens Verio MRI system using a 32 channel head coil; including pre- and post-contrast T1-weighted images, T2-FLAIR images and a DCE sequence with a variable flip angle pre-contrast T1 map acquisition. VOIs were drawn by a Radiologist and confirmed by a Consultant Neuroradiologist for each patient around T2-FLAIR hyperintense regions and on a 2cm diameter circular region on CWM. 3 patients with bilateral disease were excluded from the analysis.
Pharmacokinetic analysis was performed with TM and SSM and resulted with 3D parametric maps of Ktrans (contrast agent plasma/interstitium transfer rate constant), Kep (intravasation rate constant), ve (extravascular and extracellular volume fraction) and τi (mean capillary water molecule lifetime), in the tumour and the CWM. A Wilcoxon Rank sum test was performed to assess for statistical difference between mean values for the pharmacokinetic maps evaluated with the two models in the lesion and the CWM. Receiver operating characteristic curve (ROC) analysis was then computed for both pharmacokinetic models to further investigate their ability in the classification of the tissue.
Results
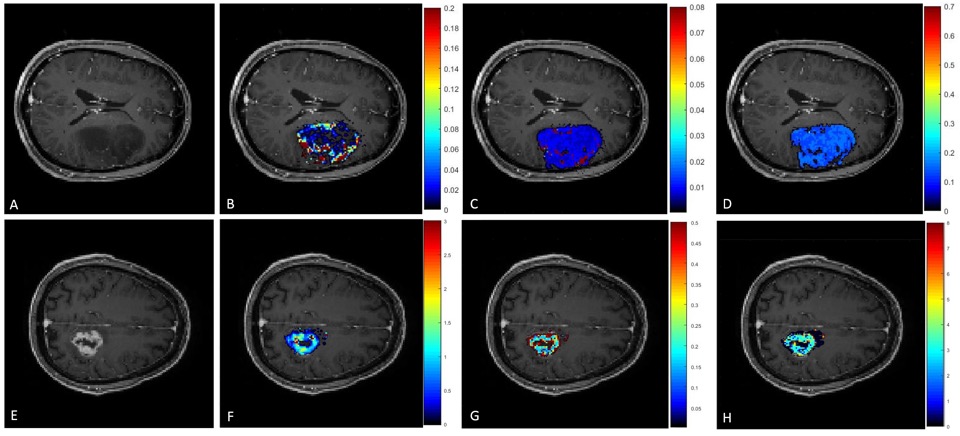
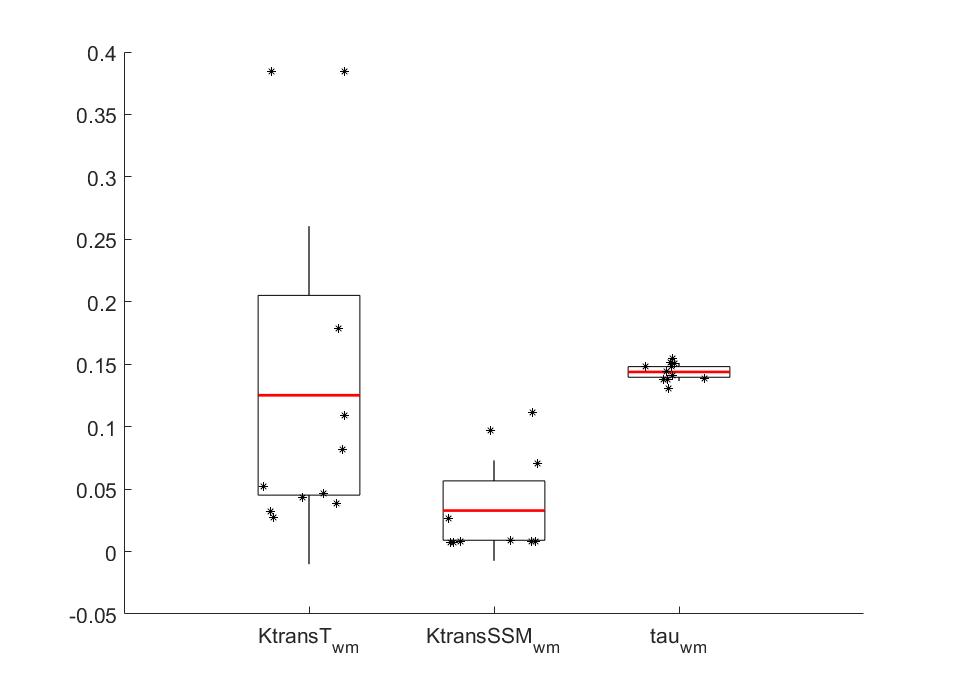
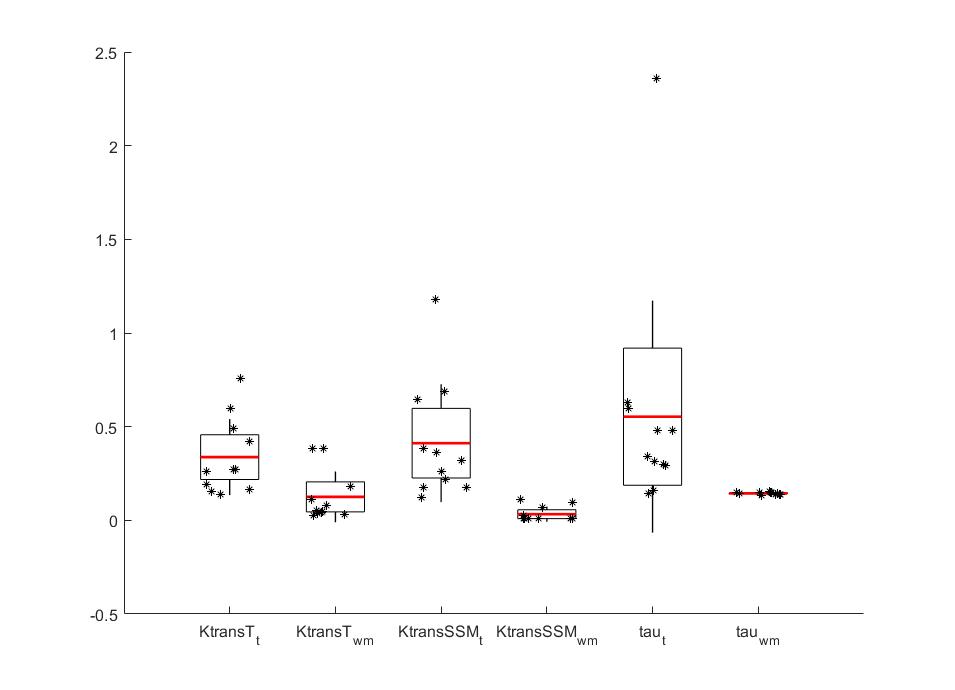
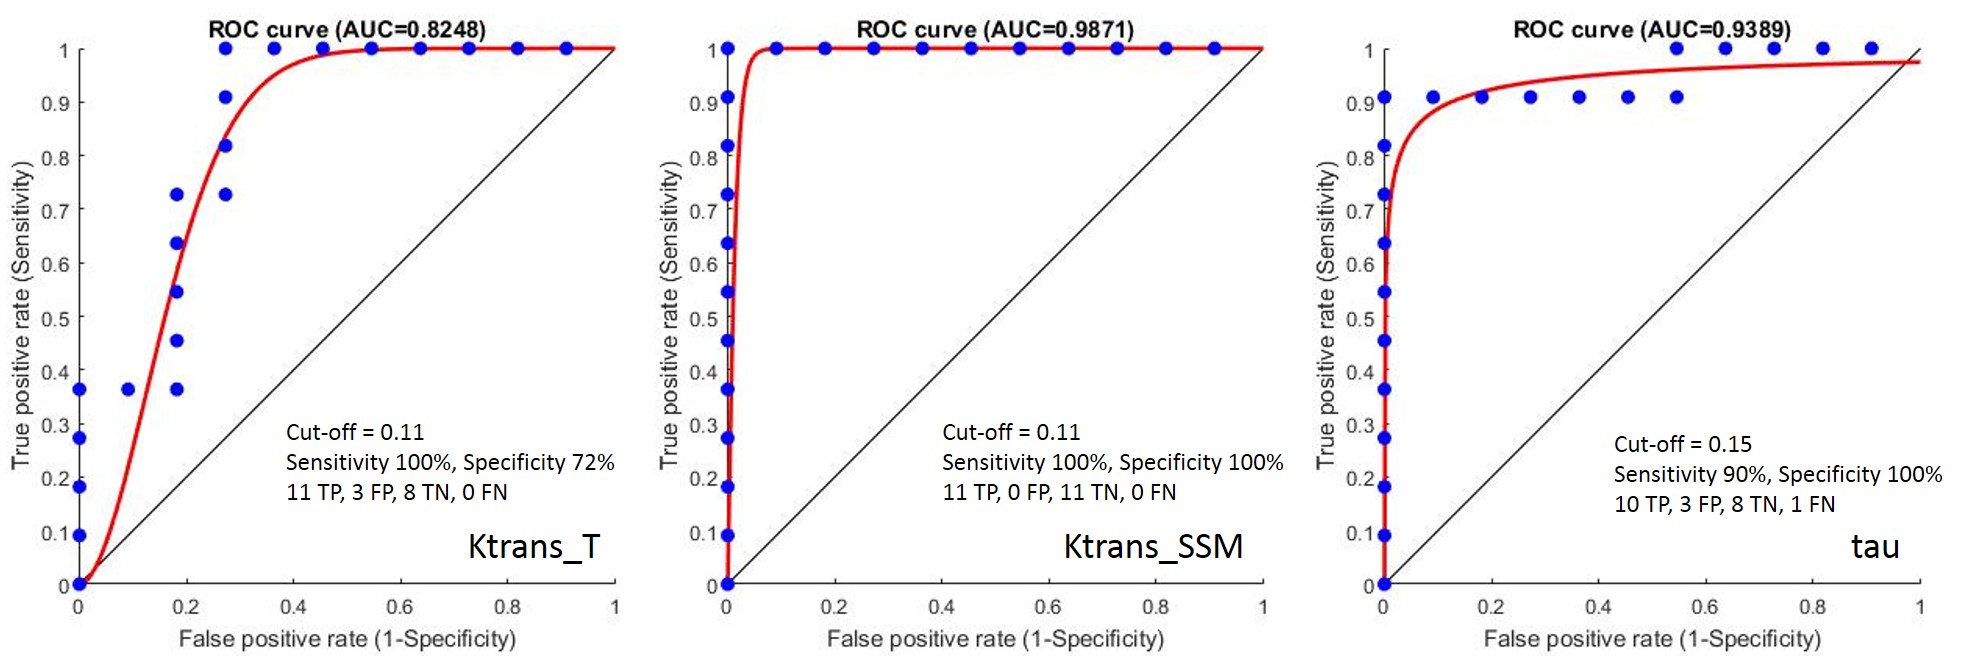
Parametric maps of TM and SSM estimates of Ktrans and τi for one axial slice of a non-enhancing and an enhancing tumour are shown in Fig.1. Boxplots of TM and SSM Ktrans and τi evaluated in the CWM are shown in Fig.2. Fig. 3 shows the boxplot of mean values of Ktrans (TM and SSM) and τi maps in tumour and CWM. Results for the ROC analysis are shown in Fig 4. Results showed a strong statistical difference between tumour and CWM for the Tofts’ Ktrans (p<0.01) and for the SSM Ktrans and τi (p<<0.01).
Discussion
The feasibility of the SSM DCE-MRI pharmacokinetic analysis in brain was previously investigated on 6 healthy, 6 multiple sclerosis and 5 glioblastoma subjects4. Cerebral τi maps were found to represent metabolic activity in the brain4. However, to our knowledge the importance of τi and a comparison between the TM and the SSM in brain tumours hasn’t been carried out. In this work, we presented the results of the application of TM and SSM to primary glioma. The analysis of the CWM showed a high variability for the Ktrans (TM: coefficient of variation (CV) 108%; SSM: CV 122%) while τi CV was low at 5% (Fig.2). Comparing tumour and CWM, both models were found to statistically discriminate between the two (p<0.05), however the TM-Ktrans showed some overlapping values (Fig. 3). ROC analysis confirmed the higher performance of the SSM with an AUC=0.987 for Ktrans and an AUC=0.939 for τi.
Conclusion
DCE-MRI methods hold great promise for quantitative in vivo evaluation of vascular properties under many different pathophysiological conditions. In our study, the higher performance of the SSM and the lower variability of its τi in the description of the CWM showed a more robust characterization of the lesion and we hypothesize that τi may reflect pathophysiology relevant to tumour. Furthermore, the lower variance of the SSM-Ktrans may improve performance and tumour characterisation with less overlap in intra-tumoural values. Future studies will need to assess the textural features of the TM and SSM parameters in heterogeneous regions of the tumour.
Acknowledgements
This work was part funded by the National Institute for Health Research Imperial Comprehensive Biomedical Research Centre, the Brain Tumour Charity and the Brain Tumour Research Campaign. MR acquisitions were carried out at the Imperial College Clinical Imaging Facility. The authors thank Katherine Ordidge and Tara Barwick for their help in setting up this study.References
[1] Tofts, P.S.. (2010). T1-weighted DCE imaging concepts: Modelling, acquisition and analysis. MAGNETOM Flash. 3. 30-39.
[2] Yankeelov TE, Rooney WD, Li X, Springer CS. Variation of the relaxographic "shutter-speed" for transcytolemmal water exchange affects the CR bolus-tracking curve shape. Magnetic Resonance in Medicine. 2003;50:1151-69. doi:10.1002/mrm.10624.
[3] Landis CS, Li X, Telang FW, Molina PE, Palyka I, Vetek G, Springer CS (1999) Equilibrium transcytolemmal water-exchange kinetics in skeletal muscle in vivo. Magn Reson Med 42(3), 467-478.
[4] Rooney, W. D., Li, X., Sammi, M. K., Bourdette, D. N., Neuwelt, E. A., & Springer, C. S. (2015). Mapping human brain capillary water lifetime: high‐resolution metabolic neuroimaging. NMR in Biomedicine, 28(6), 607-623.
Figures