0796
Absolute Cerebral Blood Flow Derived from Low GBCA Dose DCE-MRI in Patients with Type 2 Neurofibromatosis1Division of Informatics, Imaging and Data Science, University of Manchester, Manchester, United Kingdom, 2Department of Neurosurgery, Salford Royal NHS Foundation Trust, Manchester, United Kingdom
Synopsis
A newly developed low dose T1W-DCE-MRI method, ACcomb, was used to estimate the absolute CBF of vestibular schwannomas (VS) and normal appearing brain tissue in a group of 12 consecutive type 2 neurofibromatosis (NF2) patients, undergoing anti-angiogenic bevacizumab treatment. This new method consistently displayed excellent gray-white matter flow contrast and produced mean GM and WM CBF estimates consistent with previous literature values. Use of this new method showed that at 90 days post bevacizumab treatment, there was increased positive correlation between CBF and estimated plasma volume within the VS, and a significant increase in CBF within normal appearing white matter.
Introduction
We have recently developed a new methodology for
absolute CBF estimation using low gadolinium based contrast agent (GBCA) dose T1-DCE-MRI. The new method combined
two reciprocal ways for searching optimal points located in early transit time
window of the tissue concentration curves for GBCA concentration averaging. The
averaged
GBCA concentration
(AC) was then applied in a microsphere model for CBF calculation (1). In this
study we applied this method, named as ACcomb, to a group of patients with type
2 neurofibromatosis (NF2), who underwent bevacizumab treatment, for estimation
of perfusion in the vestibular schwannoma (VS) and normal appearing brain
tissues.
Methods
Twelve consecutive NF2 patients with a total of 21 VS were recruited. Each tumor was classified according to response to anti-angiogenic therapy over the 90 day period. Response was defined as a volume reduction exceeding 0.125 cm3 or a relative volume decrease exceeding 5%. A low GBCA dose high temporal resolution (LDHT-) DCE-MRI with ∆t = 1.0 s was acquired, following intravenous injection of 0.02 mmol/kg of a macrocyclic type of GBCA. Tissue concentration curve, Ct(t), was derived using the LDHT-DCE and 3D native T1N maps from a series of 3D variable flip angle images, α = [2°,8°,15°,20°].
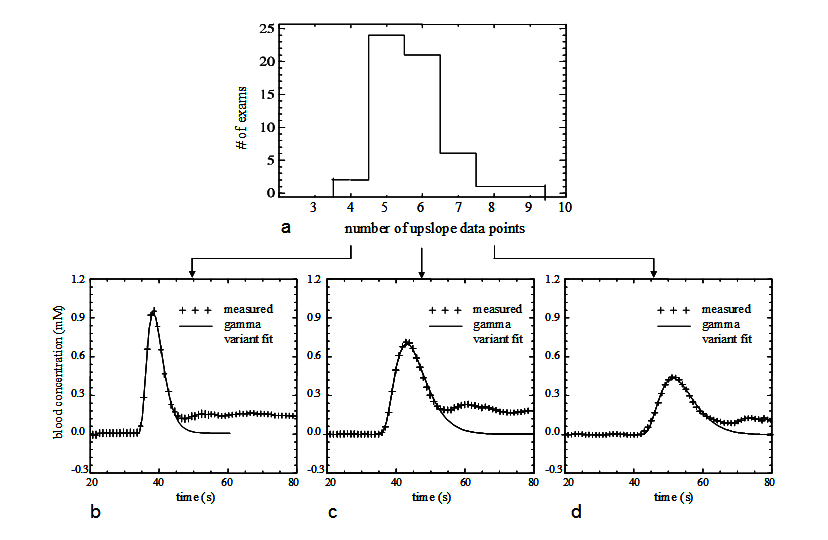
Absolute CBF was obtained by incorporating the ACcomb with individually measured vascular input function, VIF(1). To investigate possible variations in the shape and amplitude of VIFs, we retrospectively inspected VIFs from an extended cohort. Patients in the extended cohort were scanned with the same LDHT-DCE protocol (Fig. 1).
A concurrent kinetic analysis was also
performed with the same DCE-MRI using extended-Tofts model, to produce the
plasma volume (vp) and transfer constant (Ktrans).
Results
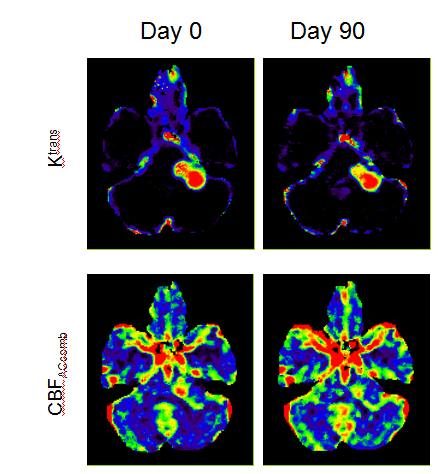
Figure 2 shows maps of Ktrans and CBFACcomb from a NF2 patient with a large left sided VS, scanned with LDHT-T1W-DCE-MRI pre-(day0) and 90 days post-treatment(day90).
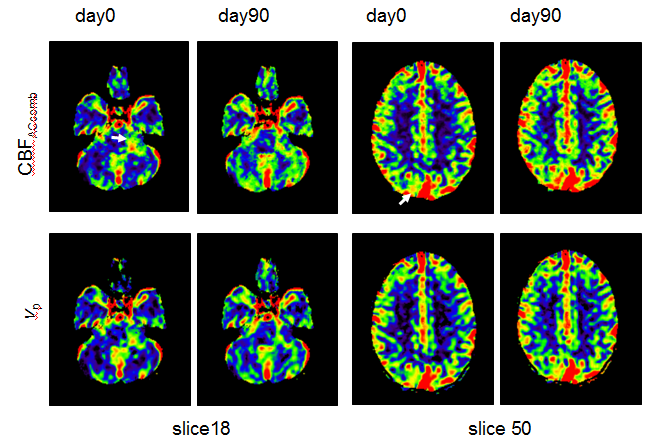
Figure 3 shows CBFACcomb maps of a NF2 patient with a large left sided VS and four meningiomas, on day0 and day90. The vp images are also displayed for comparison. Slices from two levels of the 3D parametric images are shown. The appearances of the T1W-CBFACcomb are similar to vp maps. As can be seen there is some reduction of CBFACcomb and vp within the VS on 90 days after treatment.
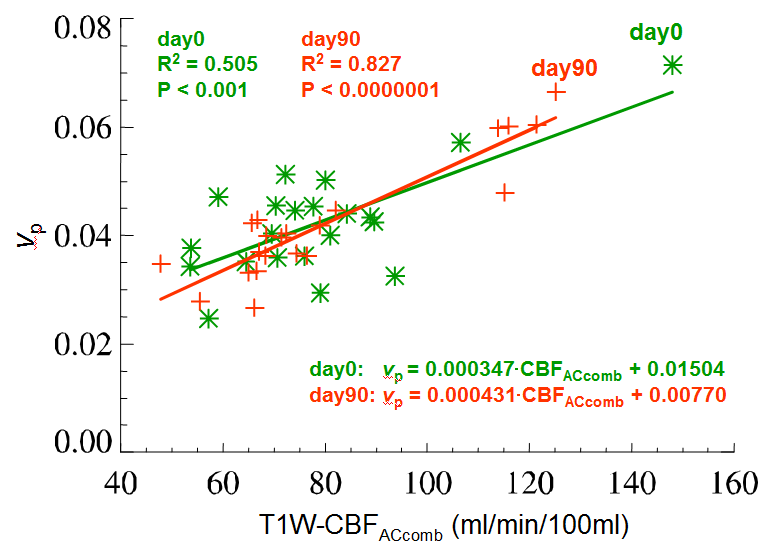
Figure 4 shows an inter-subject, inter-tumor comparison between the mean values of T1W-CBFACcomb and vp from the 21 tumors (VS) of the 12 NF2 patients, undergoing bevacizumab treatment. Linear regression analysis shows that T1W-CBFACcomb and vp are significantly correlated, on both pre- and post-treatment (day0 and day90). The correlation is much stronger on day90 (R2 = 0.827, p < 0.0000) than day0 (R2 = 0.505, p < 0.001).
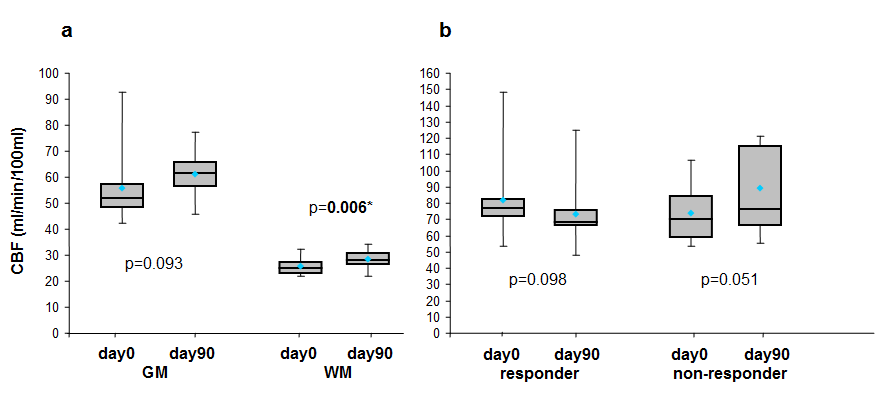
Figure 5a shows mean CBFACcom values in GM: 55.9 ± 14 (day0), 61.0 ± 8.3 (day90) ml/min/100ml, in WM: 25.8 ± 3.5 (day0), 28.4 ± 3.4 (day90) ml/min/100ml and mean gray/white ratio: 2.15 ± 0.3 (day0), 2.15 ± 0.2 (day90). All values were consistent to those reported in literature. There is a significant increase of CBF in normal appearing WM after treatment. Figure 5b shows differences between mean CBF in VS before and after treatment for the responders and non-responders.
Discussion
This study provides new information regarding cerebral blood flow in NF2 patients undergoing anti-angiogenic therapy. Firstly, our AC data provide evidence that the mean values of absolute CBF of normal appearing WM and GM are consistent with literature values in healthy volunteers measured using the model-based deconvolution approaches (2,3). Secondly, whilst the mean pre-treatment CBF values of the VS are within the range of normal appearing GM, the concurrent measured Ktrans is much higher than GM suggesting the tumor vessels are more leaky. Post bevacizumab treatment the correlation between the CBF and plasma volume of all VS was much stronger than pre-treatment, and there was heterogeneity in VS response, with responders showing a trend to decreasing tumor CBF whereas non-responders showed increasing CBF. Furthermore, within the normal appearing brain, there was an interesting finding of significantly increased WM CBF 90 days treatment.
The clinical application of the new ACcomb method consistently displayed excellent gray-white matter flow contrast compared with previous reported DCE-MRI study (4), while using a much lower GBCA dose than those of DSC-MRI (5). Reduced GBCA dose is a pertinent clinical concern, as patients with benign CNS tumors may receive many contrast-enhanced MR scans throughout their lifetime.
Conclusion
Combining the merits of the low GBCA dose, fast acquisition and large volume coverage, the T1W-CBFACcomb could be a potential valuable marker for monitoring the therapy responses of CNS tumors to anti-angiogenic therapies.Acknowledgements
This work was supported by CRUK [C8742/A18097]. This is a contribution from the Cancer Imaging Centre in Cambridge & Manchester, which is funded by the EPSRC and Cancer Research UK.References
1.
Whole
Brain Absolute CBF Measurements Using Ultra-Low GBCA DCE-MRI and Microsphere
Model. Submitted to ISMRM 2018.
2. Larsson
HB, Hansen AE, Berg HK, Rostrup E, Haraldseth O. Dynamic contrast-enhanced
quantitative perfusion measurement of the brain using T1-weighted MRI at 3T. J
Magn Reson Imaging 2008;27(4):754-762.
3. Sourbron S, Ingrisch M, Siefert A, Reiser M, Herrmann K. Quantification of cerebral blood flow, cerebral blood volume, and blood-brain-barrier leakage with DCE-MRI. Magn Reson Med 2009;62(1):205-217.
4. Moody AR, Martel A, Kenton A, et al. Contrast-reduced imaging of tissue concentration and arterial level (CRITICAL) for assessment of cerebral hemodynamics in acute stroke by magnetic resonance. Invest Radiol 2000;35(7):401-411.
5.
Kwong
KK, Chesler DA. Early time points perfusion imaging: theoretical analysis of
correction factors for relative cerebral blood flow estimation given local
arterial input function. Neuroimage 2011;57(1):182-189.
3.
Figures