0794
Assessment of the total iron mass using Quantitative Susceptibility Mapping (QSM): Deep gray matter iron depletion in multiple sclerosis?1Buffalo Neuroimaging Analysis Center, Department of Neurology, Jacobs School of Medicine and Biomedical Sciences, University at Buffalo, The State University of New York, Buffalo, NY, United States, 2Center for Biomedical Imaging, Clinical and Translational Science Institute, University at Buffalo, The State University of New York, Buffalo, NY, United States, 3MR Research Laboratory, IRCCS, Don Gnocchi Foundation ONLUS, Milan, Italy, 4BairdMS Center, Department of Neurology, Jacobs School of Medicine and Biomedical Sciences, University at Buffalo, The State University of New York, Buffalo, NY, United States
Synopsis
It is often overlooked that iron concentrations, as determined, e.g., via Quantitative Susceptibility Mapping (QSM), reflect the mass of iron per unit volume. Consequently, structural atrophy alone (i.e. decreased volume) increases the tissue iron concentration if the total mass of iron remains constant.
In this work, we present a technique to assess the mass of regional tissue iron in milligrams (mg). We retrospectively applied the technique to data from a recently published 2-year longitudinal study, in which we had investigated iron concentration changes in Multiple Sclerosis (MS).
Introduction
It is a widely adopted notion that changes in the magnetic susceptibility $$$\Delta \chi$$$ of deep gray matter (DGM) are dominated by changes in the local tissue concentration $$$\Delta c_\mathrm{Fe}$$$ of non-heme iron,
$$\Delta \chi = \chi_\mathrm{Fe} \cdot \Delta c_\mathrm{Fe},$$
where $$$\chi_\mathrm{Fe}$$$ is a proportionality constant.
However, it is often overlooked that iron concentrations, as determined, e.g., via QSM, reflect the mass of iron per unit volume. Consequently, structural atrophy alone (i.e. decreased volume) increases the tissue iron concentration if the total mass of iron remains constant. Hence, past reports of “increased iron” in clinical studies of brain diseases1-3 may have been driven entirely by atrophy.
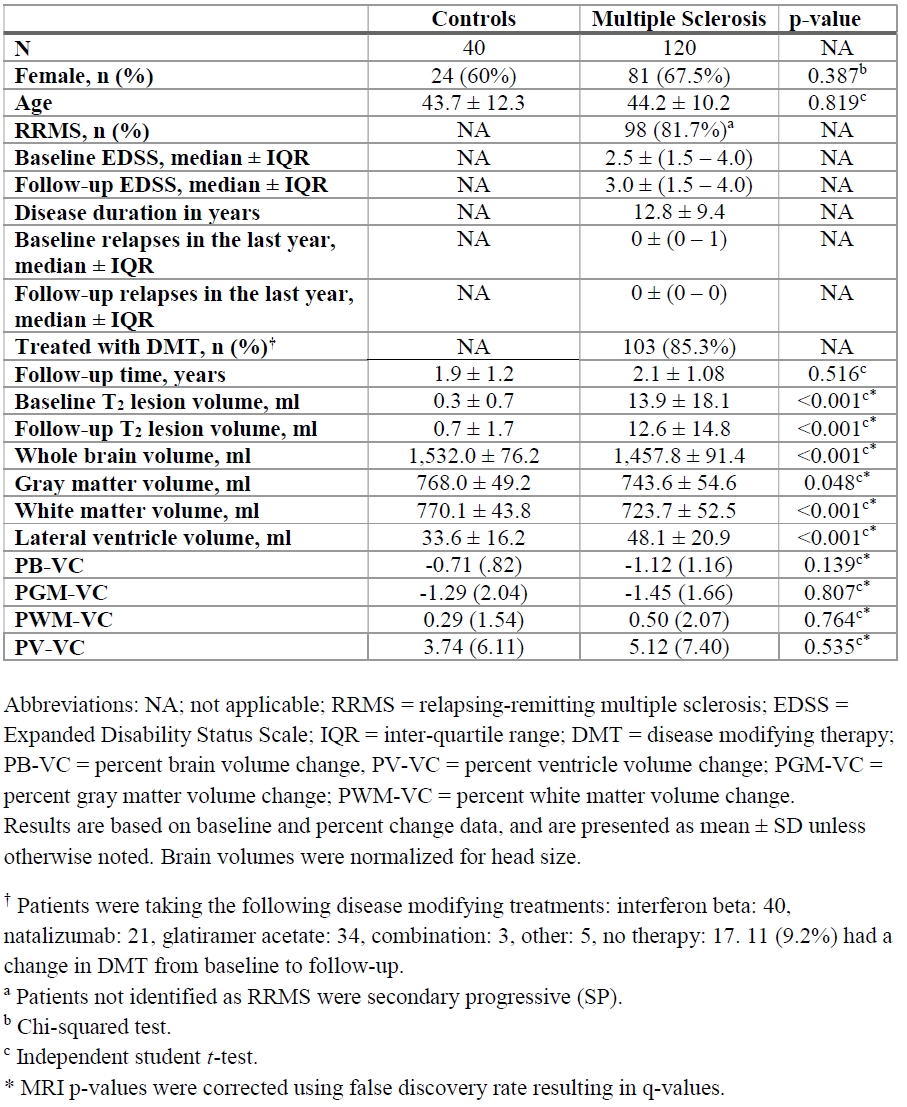
In the present work, we present a technique to assess the mass of regional tissue iron in milligrams (mg). We retrospectively applied the technique to data from a recently published 2-year longitudinal study (Table 1), in which we had investigated iron concentration changes (as reflected by QSM) in multiple sclerosis (MS).4
Methods
Subjects were imaged at 3T (GE Signa Excite HD 12.0) using single-echo gradient-echo (matrix 512x192x64; 0.5x1x2mm3; 12° flip, TE/TR=22ms/40ms, bandwidth=13.89kHz). QSM involved phase unwrapping,5 background-field correction,6,7 and HEIDI.8 Anatomical DGM regions were segmented with FSL-FIRST on 3D-T1w images corrected for T1-hypointensity misclassification.9
We determined $$$\chi_\mathrm{Fe}$$$ by comparing $$$\Delta \chi$$$ determined in normal controls (NCs) with the histochemically determined mass of iron in mg per 100g tissue wet weight (mg/100g-ww).10 We determined the regional mass of iron $$$m_\mathrm{Fe}$$$ by converting the local magnetic susceptibility into iron concentration, $$$c_\mathrm{Fe}$$$, and multiplying the concentration with the region’s volume $$$V$$$:
$$c_\mathrm{Fe} \cdot V = m_\mathrm{Fe}.$$
Within-study-group time effects were tested using the paired t-test, and between-study-group baseline and follow-up differences were tested using the Student’s t-test. Mixed factorial ANOVA was performed to investigate whether temporal trajectories of the dependent measures differed between study groups. For improved assessment of similarly/absence of change between groups, we report 95% confidence intervals.
Results
The conversion between susceptibility $$$\chi$$$ (in ppb) and iron concentration was determined as:
$$c_\mathrm{Fe} = 4.885\, \textrm{mg/100g-ww} + \chi \cdot 0.147\, \textrm{mg/100g-ww per ppb}.$$
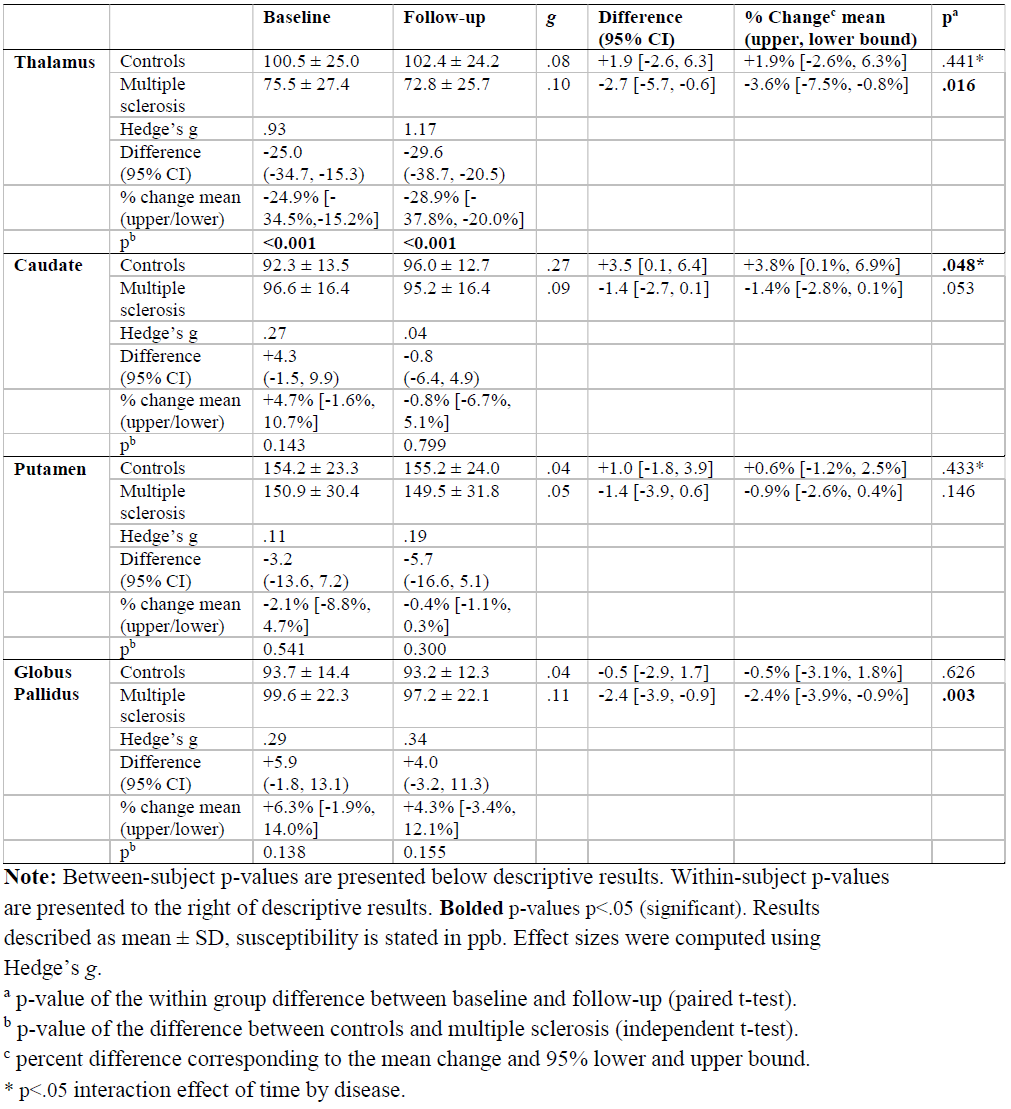
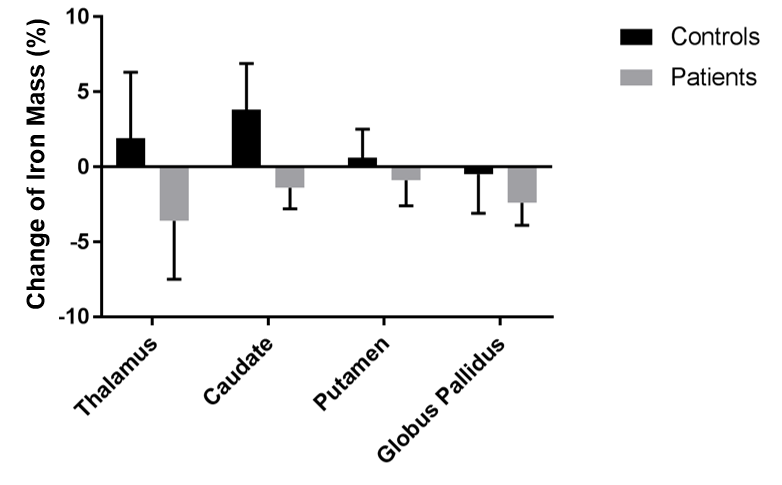
Table 2 summarizes the calculated values of the iron mass in each DGM region studied. Figure 1 summarizes the relative changes of the regional iron mass over two years in each group.
Cross-sectionally, we found a significantly lower iron mass in the thalamus (THA) of patients at both time points (≤-24.9%; p<0.001). A relatively high inter-subject variability of the iron mass rendered the group differences in globus pallidus (GP) and caudate (CAU) statistically insignificant. On the contrary, the iron mass was relatively stable in the putamen (PUT), reflected by a narrow confidence interval at the follow-up time [-1.1%; +0.3%].
In NCs, the mass of iron increased over 2 years in all regions, except the GP (-0.5%), but these changes reached significance only in the CAU (+3.8%; p=0.048). In patients, contrary to the NCs, iron mass decreased in all regions and findings reached statistical significance in both THA (-3.6%; p=0.016) and GP (-2.4%; p=0.003).
Discussion
We presented a methodology to investigate the tissue iron mass based on the tissue’s magnetic susceptibility and the regional volume. The technique compensates for alterations in the tissue iron concentration that are concomitant to volumetric changes (atrophy) frequently seen in many neurological diseases as well as healthy aging.
In our previous study using QSM in the same cohort, we found longitudinal changes of iron concentration only in the CAU (both groups). The present work suggests that elevated iron concentrations resulting from regional atrophy in THA and GP had masked an actual decrease in iron mass in these regions.
Conclusion
The presented methodology reveals that temporal changes in magnetic susceptibility of DGM in MS patients can only be explained by a removal of iron. Hence, contrary to the current notion that neurodegeneration is associated with increased tissue iron, our study suggests a loss of iron-containing cells or a depletion of iron from those cells.Acknowledgements
Research reported in this publication was funded by the National Center for Advancing Translational Sciences of the National Institutes of Health under Award Number UL1TR001412. The content is solely the responsibility of the authors and does not necessarily represent the official views of the NIH.References
[1] C. Stüber, D. Pitt, and Y. Wang, “Iron in Multiple Sclerosis and Its Noninvasive Imaging with Quantitative Susceptibility Mapping,” Int J Mol Sci, 17(1):100; 2016.
[2] A. M. Daugherty and N. Raz, “Appraising the Role of Iron in Brain Aging and Cognition: Promises and Limitations of MRI Methods,” Neuropsych Rev, 25(3):272–287; 2015.
[3] M. Hadzhieva, E. Kirches, and C. Mawrin, “Review: iron metabolism and the role of iron in neurodegenerative disorders.” Neuropathol Appl Neurobiol, 40(3):240–57; 2014.
[4] J. Hagemeier, R. Zivadinov, M. G. Dwyer, P. Polak, N. P. Bergsland, B. Weinstock-Guttman, J. Zalis, A. Deistung, J. R. Reichenbach, and F. Schweser, “Changes of deep gray matter magnetic susceptibility over 2 years in multiple sclerosis and healthy control brain,” NeuroImage: Clinical (in press).
[5] H. S. Abdul-Rahman, M. A. Gdeisat, D. R. Burton, M. J. Lalor, F. Lilley, and C. J. Moore, “Fast and robust three-dimensional best path phase unwrapping algorithm.” Appl Opt, 46(26):6623–35; 2007.
[6] W. Li, B. Wu, and C. Liu, “Quantitative susceptibility mapping of human brain reflects spatial variation in tissue composition.” NeuroImage, 55(4):1645–56; 2011.
[7] F. Schweser, A. Deistung, B. W. Lehr, and J. R. Reichenbach, “Quantitative imaging of intrinsic magnetic tissue properties using MRI signal phase: An approach to in vivo brain iron metabolism?” NeuroImage, 54(4):2789–2807; 2011.
[8] F. Schweser, K. Sommer, A. Deistung, and J. R. Reichenbach, “Quantitative susceptibility mapping for investigating subtle susceptibility variations in the human brain.” NeuroImage, 62(3):2083–2100; 2012.
[9] B. Patenaude, S. M. Smith, D. N. Kennedy, and M. Jenkinson, “A Bayesian model of shape and appearance for subcortical brain segmentation.” NeuroImage, 56(3):907–22; 2011.
[10] B. Hallgren and P. Sourander, “The effect of age on the non-haemin iron in the human brain,” J Neurochem, 3:41–51, 1958.
Figures