0793
Quantitative T1 and T2 Brain Atlases for the Detection of Abnormal Relaxation Times1Advanced Clinical Imaging Technology, Siemens Healthcare AG, Lausanne, Switzerland, 2Biolab - Department of Electronics and Telecommunications, Polytechnic University of Turin, Turin, Italy, 3Department of Radiology, Centre Hospitalier Universitaire Vaudois (CHUV), Lausanne, Switzerland, 4LTS5, École Polytechnique Fédérale de Lausanne (EPFL), Lausanne, Switzerland, 5Neuroimaging Laboratory and Neurology Department, Basel University Hospital, Basel, Switzerland, 6Department of Clinical Neurosciences, Centre Hospitalier Universitaire Vaudois (CHUV) and University of Lausanne (UNIL), Lausanne, Switzerland
Synopsis
This work aims at the detection of abnormal relaxation times in the human brain. To that end, a pipeline for creating normative atlases was established. High-resolution atlases of normative T1 and T2 values were created based on mapping data from 52 healthy subjects. A regression model including gender and age was introduced and z-score maps calculated to compare T1 and T2 maps of a single-subject to the derived norms. Initial results based on multiple sclerosis patient data detect not only lesional tissue but also presumably altered normal-appearing white matter regions.
Introduction
Quantitative MRI (qMRI) provides a direct measure of tissue properties that - in a perfect setting - is independent from the employed hardware and imaging technique1 and may enable the detection of subtle tissue changes not visible to the naked eye. Alterations of T1 and T2 relaxation have already been shown to be connected to axonal loss, neuronal cell death or demyelination in diseases such as Multiple Sclerosis (MS), Parkinson’s Disease and Epilepsy.1–3
Recently developed fast imaging techniques enable the use of qMRI in clinical routine. To exploit the full clinical potential of qMRI, however, databases of normative values in healthy tissues are required.2 This work aims at establishing a database for T1 and T2 relaxation in the brain based on two fast and robust qMRI techniques. With the goal to detect abnormal relaxation values, parametric maps of healthy subjects (HS) are acquired, and a voxel-based method to compare a single subject to the healthy cohort is established. Initial patient results exploring the potential of this approach are shown on an MS case.
Methods
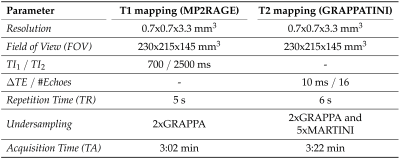
After obtaining written informed consent, T1 and T2 maps from 52 HS (24 men/28 women; median age, 27.5 years; range, 21-48 years) were acquired at 3T (MAGNETOM Skyra, Siemens Healthcare, Erlangen, Germany) using a standard 20-channel head/neck coil. Relaxation times were obtained through a synchronized mapping protocol based on the MP2RAGE4 (T1 maps) and a prototype T2 mapping technique (GRAPPATINI5,6), with a total acquisition time of 6:24 min and a resolution of 0.7x0.7x3.3mm3 (Table 1).
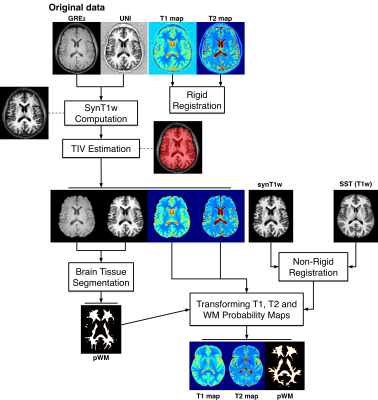
Based on total intracranial volume extracted using a previously proposed method7 and the Advanced Normalization Tools (ANTs)8, white matter (WM) probability maps were evaluated for each HS, using the MorphoBox9 prototype software. Images were registered with Elastix10 onto a study-specific template generated with ANTs. Brain masks and spatial non-linear transformations were then applied to T1, T2 and WM probability maps (Figure 1).
Healthy T1 and T2 relaxation atlases were established by fitting a linear model for each voxel ($$$\vec{r}$$$) across the aligned HS maps. Sex and age were used as predictive variables:
$$ E\{T\mathit{1}(\vec{r})\}=\beta_{\mathit{0},T\mathit{1}}(\vec{r})+\beta_{sex,T\mathit{1}}(\vec{r})*sex+\beta_{age,T\mathit{1}}(\vec{r})*age,$$
$$E\{T\mathit{2}(\vec{r})\}=\beta_{\mathit{0},T\mathit{2}}(\vec{r})+\beta_{sex,T\mathit{2}}(\vec{r})*sex+\beta_{age,T\mathit{2}}(\vec{r})*age,$$
with $$$\beta_\mathit{0}$$$ being the model intercept, sex = 1 if the subject is male, 0 if female.
A WM prior was computed by averaging the spatially normalized WM probability maps across all HS.
To demonstrate feasibility of single-subject comparison, relaxation maps of an MS patient (male, 31 yo) were acquired with the same protocol. Deviations from established atlases were voxel-wise calculated and expressed in z-score maps. The deviation analysis was restricted to WM using the WM prior.
Results
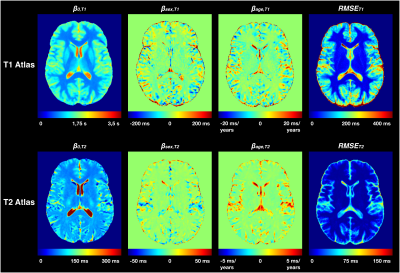
Figure 2 shows a representative slice of the established atlases for T1 and T2 normative values. The atlases exhibit a low Root Mean Squared Error (RMSE) in brain WM and deep GM structures (<30 ms for T1, <3 ms for T2), but higher RMSE in cortical GM (ΔT1 = 30-600 ms, median = 138 ms; ΔT2 = 5-80 ms, median = 12 ms).
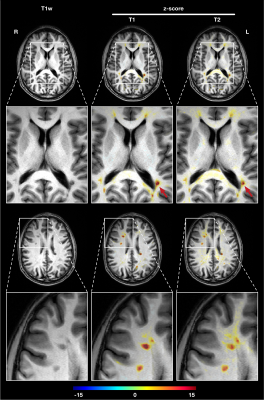
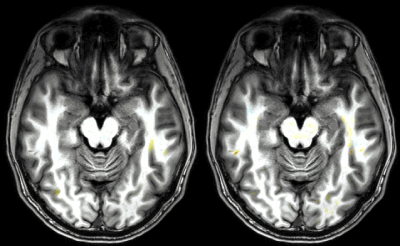
Z-score maps of the demonstration patient case were overlaid onto an anatomical T1-weighted image generated from the T1 map (Figure 3). T1 and T2 deviations in focal MS lesions are well detected (mean z-scores T1: 10.9, T2: 7.9) inside the plaque. More subtle and confluent deviations are detected in the corpus callosum and along fiber tracks between lesions, suggesting a clinically plausible inflammatory pattern (T2 z-scores between 2-4). In general, T1 deviations seem to provide better lesion delineation, whereas changes in T2 appear to diffuse into surrounding tissue. Figure 4 shows more example slices of T1 and T2 z-score maps.
Discussion
The method proved to be able to detect focal T1 and T2 changes in lesional tissue. Additional more confluent differences were observed in clinically plausible regions (between plaques, corpus callosum). Notably, these types of differences cannot be seen by the naked eye but might be of clinical significance (e.g. early detection of tissue inflammation).
Further work and clinical validation are needed to interpret these deviations. The currently narrow age range of healthy subject restricts the use of the method. Ongoing work aims at expanding this range. Lastly, the method is limited by the achievable registration accuracy in the cortex, leading us to currently restrain the analysis to WM.
Conclusion
In conclusion, a voxel-wise population-derived norm was established by modelling T1 and T2 distributions within a healthy cohort. The derived atlases exhibit low inter-subject variability and demonstrated good sensitivity in revealing small tissue alterations. Feasibility of single-subject comparisons was shown on an exemplary MS case. Our preliminary results demonstrate the clinical potential of qMRI in combination with normative atlases.Acknowledgements
No acknowledgement found.References
1. Deoni SCL. Quantitative relaxometry of the brain. Top Magn Reson imaging TMRI. 2010;21(2):101.
2. Bonnier G, Roche A, Romascano D, et al. Advanced MRI unravels the nature of tissue alterations in early multiple sclerosis. Ann Clin Transl Neurol. 2014;1(6):423-432.
3. Bernhardt BC, Fadaie F, De Wael RV, et al. Preferential susceptibility of limbic cortices to microstructural damage in temporal lobe epilepsy: a quantitative T1 mapping study. Neuroimage. 2017.
4. Marques JP, Kober T, Krueger G, van der Zwaag W, Van de Moortele P-F, Gruetter R. MP2RAGE, a self bias-field corrected sequence for improved segmentation and T1-mapping at high field. Neuroimage. 2010;49(2):1271-1281.
5. Sumpf TJ, Uecker M, Boretius S, Frahm J. Model‐based nonlinear inverse reconstruction for T2 mapping using highly undersampled spin‐echo MRI. J Magn Reson Imaging. 2011;34(2):420-428.
6. Hilbert T, Kober T, Sumpf TJ, et al. MARTINI and GRAPPA-When Speed is Taste. In: Proc. Intl. Soc. Mag. Reson. Med. ; 2014.
7. Fujimoto K, Polimeni JR, Van Der Kouwe AJW, et al. Quantitative comparison of cortical surface reconstructions from MP2RAGE and multi-echo MPRAGE data at 3 and 7T. Neuroimage. 2014;90:60-73.
8. Avants BB, Yushkevich P, Pluta J, et al. The optimal template effect in hippocampus studies of diseased populations. Neuroimage. 2010;49(3):2457-2466.
9. Schmitter D, Roche A, Maréchal B, et al. An evaluation of volume-based morphometry for prediction of mild cognitive impairment and Alzheimer’s disease. NeuroImage Clin. 2015;7:7-17.
10. Klein S, Staring M, Murphy K, Viergever MA, Pluim JPW. Elastix: a toolbox for intensity-based medical image registration. IEEE Trans Med Imaging. 2010;29(1):196-205.
Figures
