0792
Longitudinal assessment of adolescent brain myelination using a pulsed magnetization transfer approach1Advanced MRI, LFMI, NINDS, NIH, Bethesda, MD, United States, 2Georgetown Center for Functional and Molecular Imaging, Washington, DC, United States, 3Program for Translational Research on Adversity and Neurodevelopment, The Pennsylvania State University, University Park, MD, United States
Synopsis
The spatiotemporal growth trajectories of white matter, and in particular myelin, are an important part of cognitive development during adolescence. Quantitative magnetization transfer (qMT) imaging can be used to measure the fraction of non-water protons (fMT) as an estimate of myelin in vivo. Here we used a recently developed, time-efficient pulsed MT approach to extract fMT from white matter regions at different stages of development in a community-based cohort of adolescents. We tested the sensitivity of this approach for detecting region-specific change in fMT in repeated scans that covered a period of 18 months.
Introduction
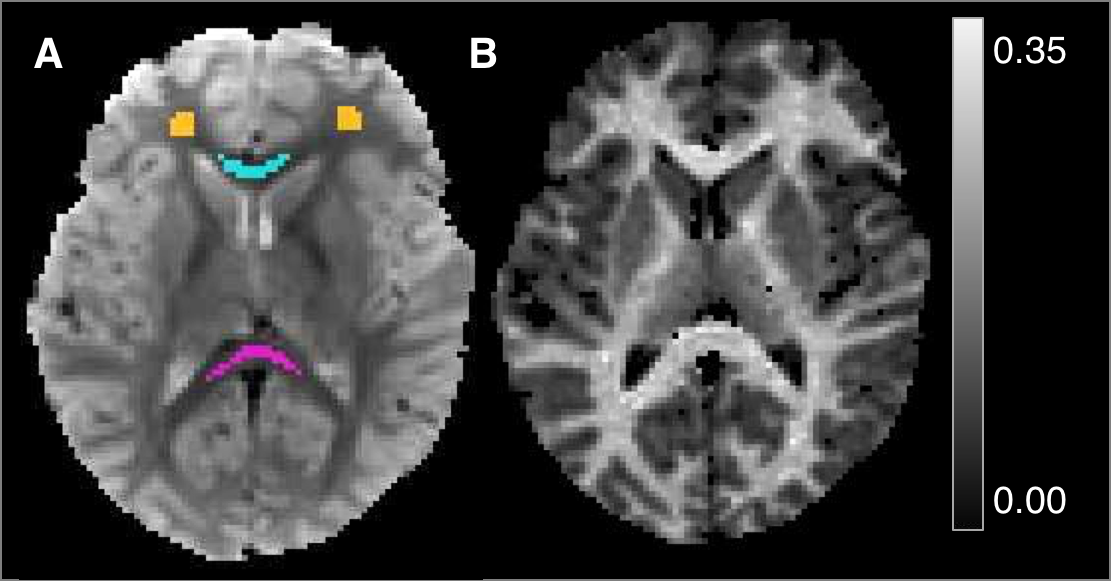
Neuroimaging studies of adolescent development have provided evidence for the regional maturation of white matter, particularly for late-myelinating regions such as frontal lobe.1 While these changes are concurrent with histological evidence of increased myelination,2,3 standard techniques typically used in longitudinal studies, such as volume and diffusion metrics, are nonspecific to myelin as they represent the combined effects of multiple tissue and acquisition parameters.4,5 Alternatively, quantitative magnetization transfer (qMT) imaging can be used to estimate distinct tissue characteristics, i.e. the fraction of non-water, mostly macromolecular protons (MP), that are abundant in myelinated tissue.6 To do this in a time-efficient manner, we applied a recently developed qMT approach to estimate MP fraction (fMT) in a longitudinal study of adolescents. Using a brief, efficient MT pulse followed by a gradient-echo EPI sequence, the transient saturation of MPs was measured as a function of variable delay time after each pulse.7,8 The feasibility of this technique for use in developmental studies was tested by extracting fMT in white matter regions selected to span both early and late maturation trajectories, including optic radiation (OR), splenium (SCC) and genu (GCC) of the corpus callosum, and frontal white matter (FLWM), respectively. We hypothesized late-myelinating regions (FLWM, GCC) would have increased fMT versus early myelinating regions (SCC, OR) that have reached “peak” maturation during the period of investigation.Methods
Fifty-six adolescent participants were scanned two times, 18 months apart (average ages 14.31±0.72; 15.86±0.73, respectively), on a 3T Siemens MRI scanner using a 12-channel receive array. A two-pool model of exchange was used to estimate fMT from saturation recovery experiments as performed in 7,8. To allow for accurate extraction of fMT, two sets of EPI scans were acquired using 1) a transient, double inversion pre-pulse (“MT”) to saturate the MP pool, and 2) a single inversion pre-pulse (IR) to establish T1 relaxation of the free water pool. The MT pulse was applied at five variable delay times (t=10, 71, 132, 193, and 254ms), a pulse duration of 6ms, and pulse amplitude (B1) of 750Hz for a total of eighteen repetitions (three with no pulse for reference) and scan time of 6:16min. The IR pulse was applied at five delay times (t=9, 203, 461, 843, and 1600ms), a pulse duration of 5.12ms, and B1 amplitude of 750Hz. IR scans had four repetitions (two for reference) and scan time of 1:24min. Both EPI scans had a resolution of 1.7mm3 and SENSE=2. The TE was 30ms, and TRs were 2 and 3s for MT and IR experiments, respectively. ROIs were drawn on EPI reference images. MT exchange was estimated over time (t) using a bi-exponential model.8,9 From this, we calculated the MP pool fraction, or fMT, and compared results from each scan within individuals. Variation across volunteers within each ROI was also assessed as the ratio of SD to mean fMT (SD/mean*100).Results
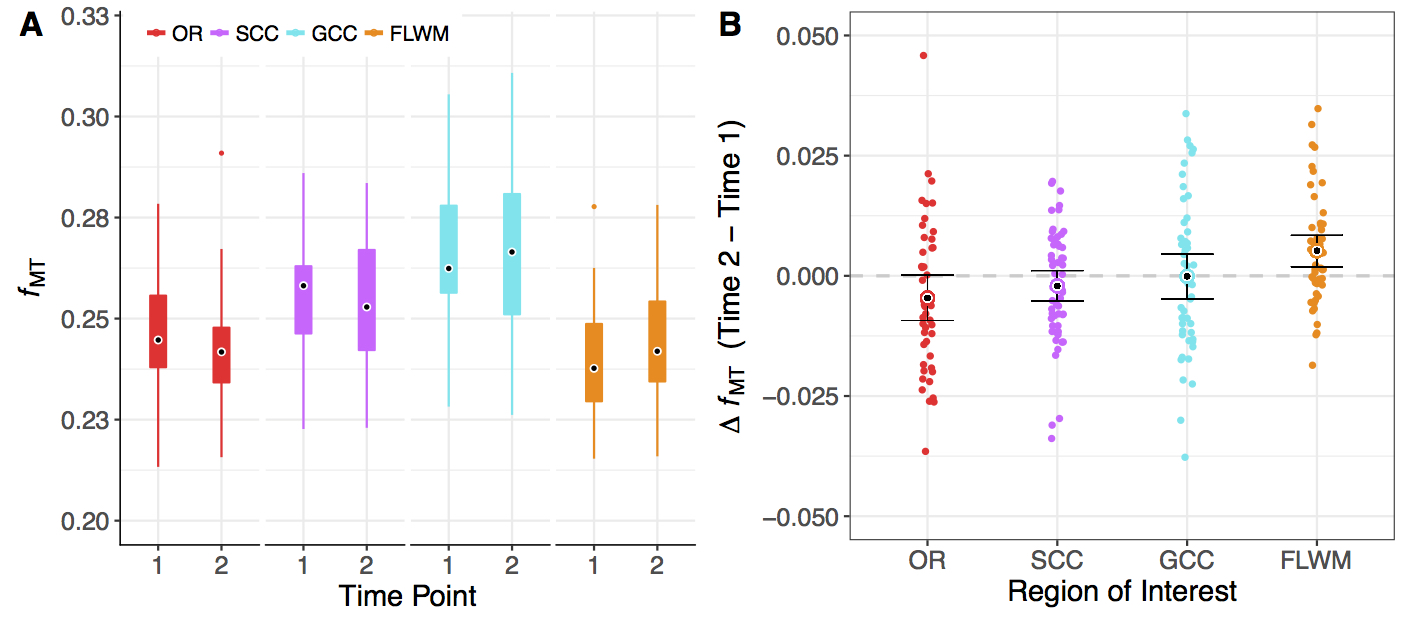
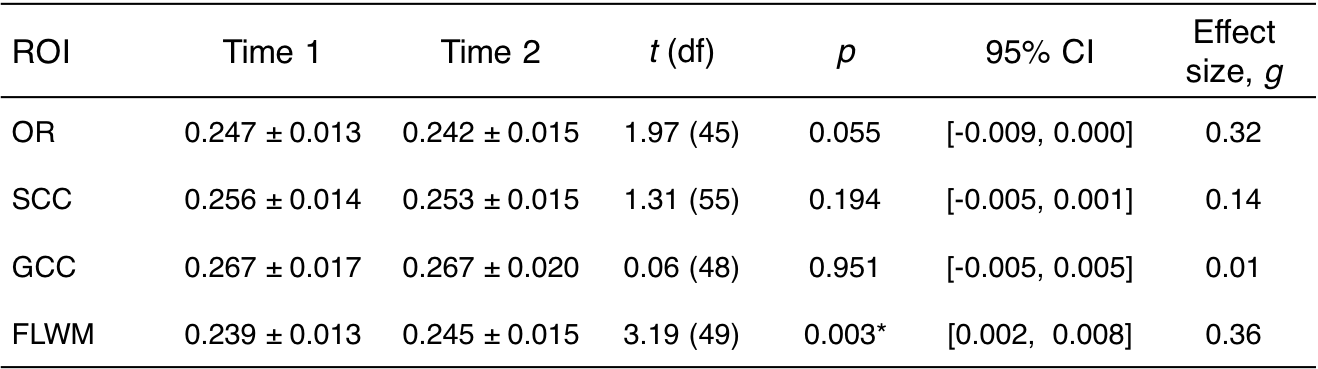
The OR, SCC, and GCC ROIs did not show a significant change between time points; however, FLWM was significantly increased (t(49)=3.19, p<0.003). From this moderate effect (Hedges’s g =0.36), we observed 31 total participants, or ~60%, to have increased fMT. There were no within subject deltas greater than 15% for any white matter region with average increase in FLWM being ~2.5% for all individuals. The across-cohort variability of each ROI ranged from 5.3-6.3% for Time 1, and 6.0-7.6% for Time 2. Low variability (<10%) was to be expected, given the narrow age range and healthy status of participants at each time point.Discussion
Using a rapid qMT approach, we observed a significant increase in FLWM fMT (~2.5%) over an 18-month time span in a community-sample of adolescents. This result was consistent with protracted maturation in frontal lobe, although we did not detect change in GCC, which sub-serves interhemispheric communication to frontal regions. This may be due to the narrow age range sampled for this study, or that GCC is relatively mature by mid- to late-adolescence. Alternatively, detecting small longitudinal effects is dependent on the stability of the technique; however, there were no changes greater than 15% for any region indicating excellent precision of fMT estimation. Previous test-retest results (repeated scans at 3T, n=5 adults) reported only small errors (0.5%) in fMT8, contributing towards its high reproducibility and sensitivity. Assuming similar error, variance across volunteers (~6%) far surpassed this threshold; thus, it is plausible for use in the detection of biological differences. Future longitudinal studies would benefit from rapid acquisition of fMT estimation as presented in this abstract. In addition, the MT pulse used has low RF power deposition and is insensitive to B1 inhomogeneities, facilitating use at ultra-high field (e.g. 7T) where increased SNR and T1 relaxation contribute to enhanced MT effects.Acknowledgements
This research was supported in part by the NIH/NIAAA
1R01AA01998301, Intramural Research Program of the NIH/NINDS, and the Metropolitan
Washington Chapter of Achievement Rewards for College Scientists.
References
1. Lebel C, Beaulieu C. Longitudinal development of human brain wiring continues from childhood into adulthood. J Neurosci. 2011;31(30):10937-10947.
2. Yakovlev PI, Lecours A-R. The myelogenetic cycles of regional maturation of the brain. In: Regional Development of Brain in Early Life; 1967:3-70.
3. Flechsig P. Anatomie des menschlichen Gehirns und Rückenmarks auf myelogentischer Grundlage. 1920:9-37.
4. Tamnes CK, Roalf DR, Goddings A, Lebel C. Diffusion MRI of white matter microstructure development in childhood and adolescence: Methods, challenges and progress. bioRxiv preprint. 2017.
5. Mills KL, Tamnes CK. Methods and considerations for longitudinal structural brain imaging analysis across development. Dev Cogn Neurosci. 2014;9:172-190.
6. Henkelman RM, Huang X, Xiang Q, Stanisz GJ, Swanson SD, Bronskill MJ. Quantitative interpretation of magnetization transfer. Magn Reson Med. 1993;29:759-766.
7. van Gelderen P, Jiang X, Duyn JH. Exploring a flexible pulse design for studying magnetization transfer. Intl Soc Mag Reson Med 23. 2015;630(2001):996.
8. van Gelderen P, Jiang X, Duyn JH. Rapid measurement of brain macromolecular proton fraction with transient saturation transfer MRI. Magn Reson Med. 2016;77:2174-2185.
9. van Gelderen P, Jiang X, Duyn JH. Effects of magnetization transfer on T1 contrast in human brain white matter. NeuroImage. 2016;128:85-95.
Figures