0791
Disentangling the contributions of brain tissue fraction and composition to quantitative MRI1The Edmond and Lily Safra Center for Brain Science, The Hebrew University of Jerusalem, Jerusalem, Israel
Synopsis
In-vivo quantitative MRI (qMRI) aims at characterizing the biological properties of brain tissue. However, qMRI parameters are sensitive both to the molecular tissue properties and to the water content within each voxel. We introduce a novel approach that disentangles these two contributions to qMRI parameters and provides tissue-specific measurements. This is achieved by evaluating the dependency of qMRI parameters on the non-water fraction. Using phantoms, we show that this dependency changes as a function of molecular composition. In the human brain, our method reveals unique tissue signatures for different brain regions, along with region-specific age-related changes.
INTRODUCTION
In-vivo quantitative MRI (qMRI) aims at characterizing the structural and biological properties of brain tissue1. However, as water content governs MR signal intensity, qMRI relaxation parameters are influenced by both the underlying variability in water content and the specific tissue composition2–6. Water content can be estimated using qMRI. This measurement, along with its complementary the lipid and macromolecular tissue volume (MTV), are independent of tissue composition2. Here we introduce a novel method that exploits the MTV quantification to overcome the confounding effect of water content on qMRI parameters and reveal tissue-specific properties. To this end, we propose to estimate the local linear dependency of qMRI parameters on MTV. This estimation provides a new transformation of qMRI measurements that enhances their sensitivity to the lipid and macromolecular content. First, we show that our approach can separate between phantoms containing different lipid compositions. Next, these novel qMRI contrasts were estimated in the human brain. We found unique tissue signatures for different brain regions, along with age-related alterations.METHODS
Phantoms: We prepared liposomes with different phospholipid compositions (phosphatidylserine, phosphatidylcholine, phosphatidylcholine-cholesterol, sphingomyelin)2,3 and varying water concentrations. The phantoms were scanned using the same protocols used for the human subjects (below).
Human subjects: 15 healthy volunteers (10 under 30, 5 over 55) were scanned on a 3T MRI scanner for multi-parametric mapping: MTV and R12, MT saturation (MTsat)7, R2*8, R29 and diffusion imaging. Different brain regions were segmented using FreeSurfer10, and the voxels at the border of each ROI were excluded to reduce partial volume effects.
RESULTS
Figure 1 shows the linear dependency of two qMRI parameters on MTV in phantoms with different phospholipids. This linear dependency changes as function of the phospholipid content, with high reproducibility in test-retest. In addition, each qMRI parameter demonstrates a different sensitivity to the molecular composition. For example, PC-cholesterol and sphingomyelin are indistinguishable in terms of their MTsat slope, but differ in terms of their R1 slope. Other phospholipids were found to be separated by MTsat, R2 and R2*.
In agreement with the lipid phantoms, we also found a linear relationship between qMRI parameters and MTV in the human brain (Figures 2-3). Different brain regions exhibit distinct dependencies on MTV, that can be quantified by the slope of the linear fit (2c,3c). This slope is conserved across subjects (2d,3d). Moreover, each qMRI parameter presents a different slope compared to MTV. For example, in the Putamen the R1 slope is similar to the Thalamus and Pallidum. However, their MTsat slopes are different. Thus, by combining the local dependencies of different qMRI parameters on MTV, a unique signature for different brain regions is revealed (Figure 4). Indeed, multiple dimentions of this signature can be found with additional qMRI parameters (R2, R2* and diffusivity).
In addition, the dependency of qMRI parameters on MTV allows better interpretation of age-related changes. Figure 5 shows a comparison of MTV, MTsat and MTsat to MTV slope in the thalamus between younger (under 30) to older (over 55) subjects. Our preliminary results demonstrate that in the thalamus, age dependent contrast emerges by the measurement of the MTsat slope. In the cortex, we find that the MTsat slope is similar between the age groups. The cortex MTsat variation with age can be explained by the MTV variation and not by tissue composition. Thus, the slope analysis allowed us to separate the contributions of the water content and the underlying tissue composition to qMRI changes measured as function of age.
DISCUSSION
In this work we examine the dependency of qMRI parameters on MTV. Our results indicate that this approach enhances the sensitivity of different MR contrast to tissue composition. First, we validated this using phantom experiments. We show that it is possible to use qMRI to extract a unique signature of lipids composition. In the human brain we found a unique tissue signature for different brain regions. Taken together, our findings imply that the dependency of qMRI parameters on MTV captures information that relates to the tissue composition of the human brain. Preliminary evidence for the importance of this new approach is provided by the comparison between younger and older subjects. Properties of human brain tissue change across the lifespan. We show that a deeper understanding of such changes can be obtained by evaluating the MTV dependencies.
CONCLUSION
We present a novel approach that strengthens the link between qMRI parameters and the underlying tissue characteristics. By expanding this framework to other qMRI parameters, we may be able to reveal a unique signature of various processes in the normal and diseased human brain.Acknowledgements
No acknowledgement found.References
- Tofts PS. Quantitative MRI of the Brain.; 2003. doi:10.1002/0470869526.
- Mezer A, Yeatman JD, Stikov N, et al. Quantifying the local tissue volume and composition in individual brains with magnetic resonance imaging. Nat Med. 2013;19(12):1667-1672. doi:10.1038/nm.3390.
- Kucharczyk W, Macdonald PM, Stanisz GJ, Henkelman RM. Relaxivity and magnetization transfer of white matter lipids at MR imaging: importance of cerebrosides and pH. Radiology. 1994;192(2):521-529. doi:10.1148/radiology.192.2.8029426.
- Koenig SH. Cholesterol of myelin is the determinant of gray-white contrast in MRI of brain. Magn Reson Med. 1991;20(2):285-291. doi:10.1002/mrm.1910200210.
- Gelman N, Ewing JR, Gorell JM, Spickler EM, Solomon EG. Interregional variation of longitudinal relaxation rates in human brain at 3.0 T: relation to estimated iron and water contents. Magn Reson Med. 2001;45:71-79.
- Callaghan MF, Helms G, Lutti A, Mohammadi S, Weiskopf N. A general linear relaxometry model of R1 using imaging data. Magn Reson Med. 2015;73(3):1309-1314. doi:10.1002/mrm.25210.
- Helms G, Dathe H, Kallenberg K, Dechent P. High-resolution maps of magnetization transfer with inherent correction for RF inhomogeneity and T 1 relaxation obtained from 3D FLASH MRI. Magn Reson Med. 2008;60(6):1396-1407. doi:10.1002/mrm.21732.
- Weiskopf N, Suckling J, Williams G, et al. Quantitative multi-parameter mapping of R1, PD*, MT, and R2* at 3T: A multi-center validation. Front Neurosci. 2013. doi:10.3389/fnins.2013.00095.
- Ben-Eliezer N, Sodickson DK, Block KT. Rapid and accurate T 2 mapping from multi-spin-echo data using Bloch-simulation-based reconstruction. Magn Reson Med. 2015;73(2):809-817. doi:10.1002/mrm.25156.
- Fischl B. FreeSurfer. Neuroimage. 2012;62(2):774-781. doi:10.1016/j.neuroimage.2012.01.021.
Figures
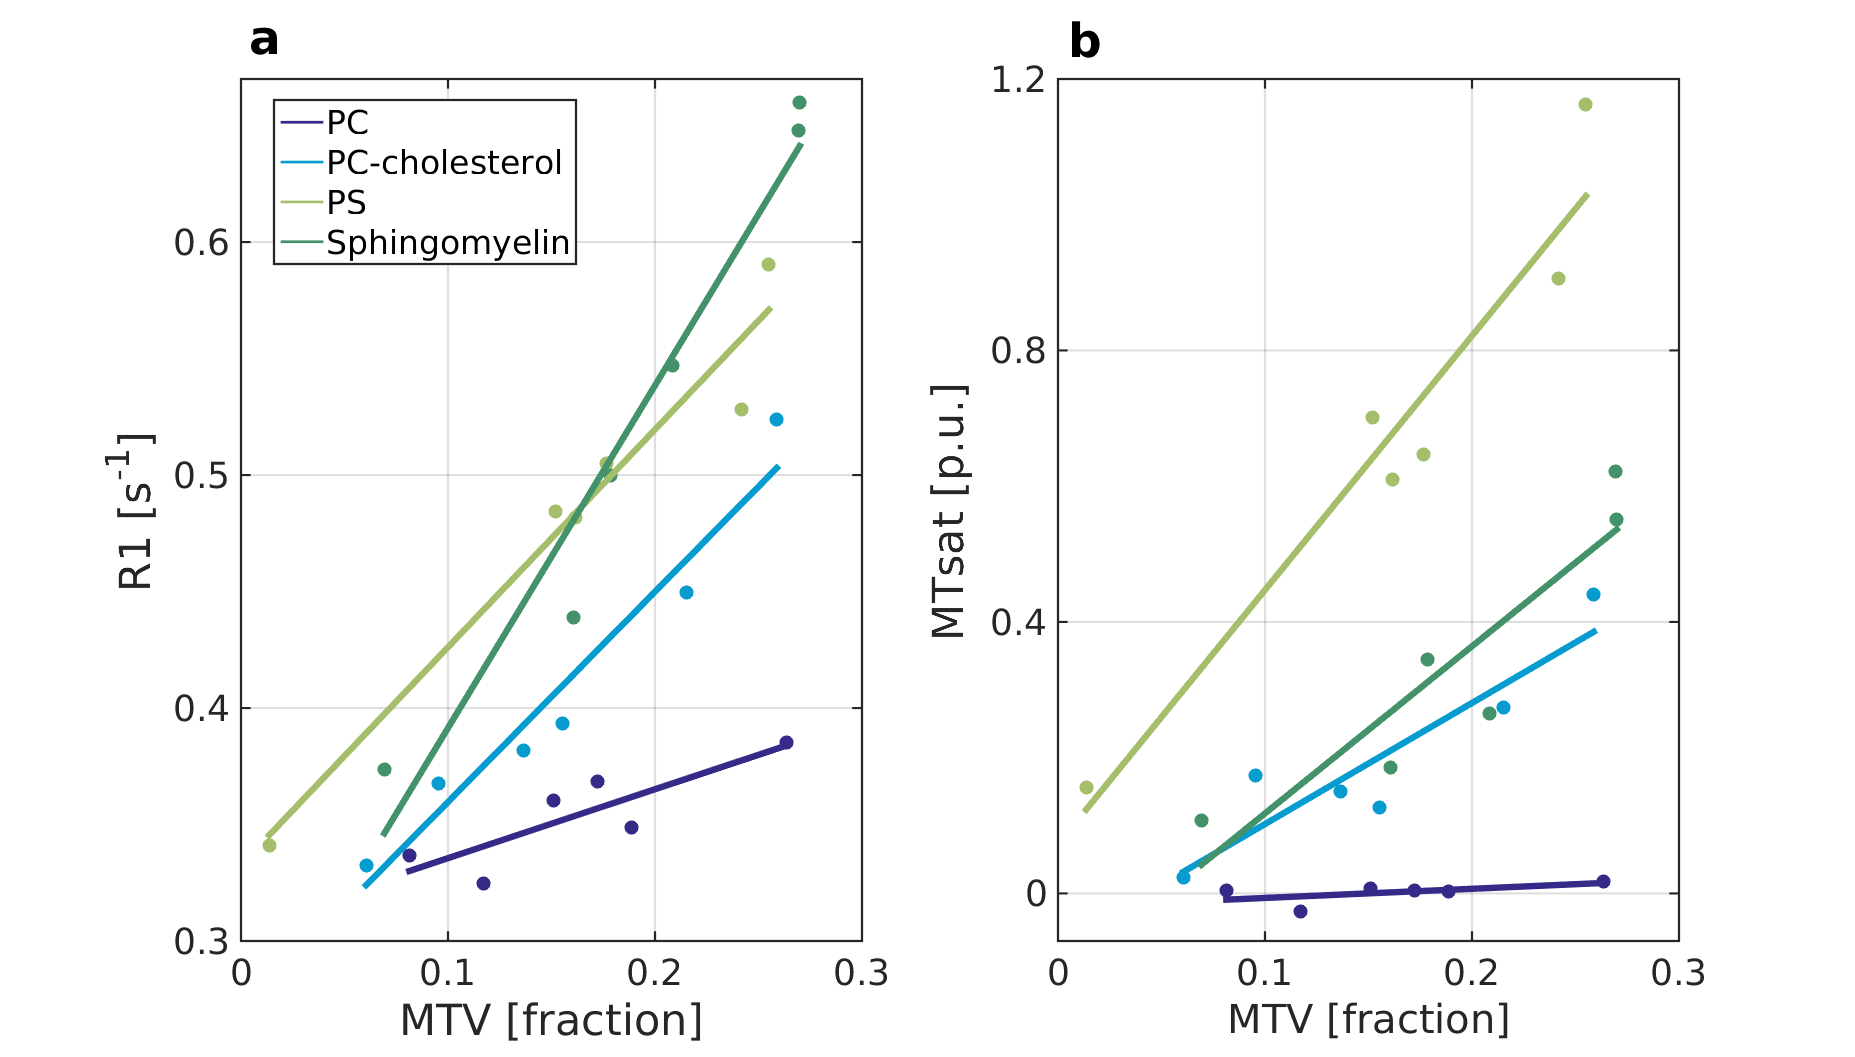
The linear relationship between R1 and MTsat to MTV for phantoms composed of different phospholipids.
Phantoms with varying water concentration and different lipid content were scanned (phosphatidylserine (PS), phosphatidylcholine (PC), PC-cholesterol, sphingomyelin). For each lipid phantom, R1 (a) and MTsat (b) are plotted against MTV (colored dots). The linear dependencies between R1 and MTsat to MTV is marked by lines. A difference between these linear dependencies can be found across phospholipids and qMRI parameters (with high reproducibility in scan-rescan). For example, PC-cholesterol and sphingomyelin are indistinguishable in terms of their MTsat slope, but differ in terms of their R1 slope.
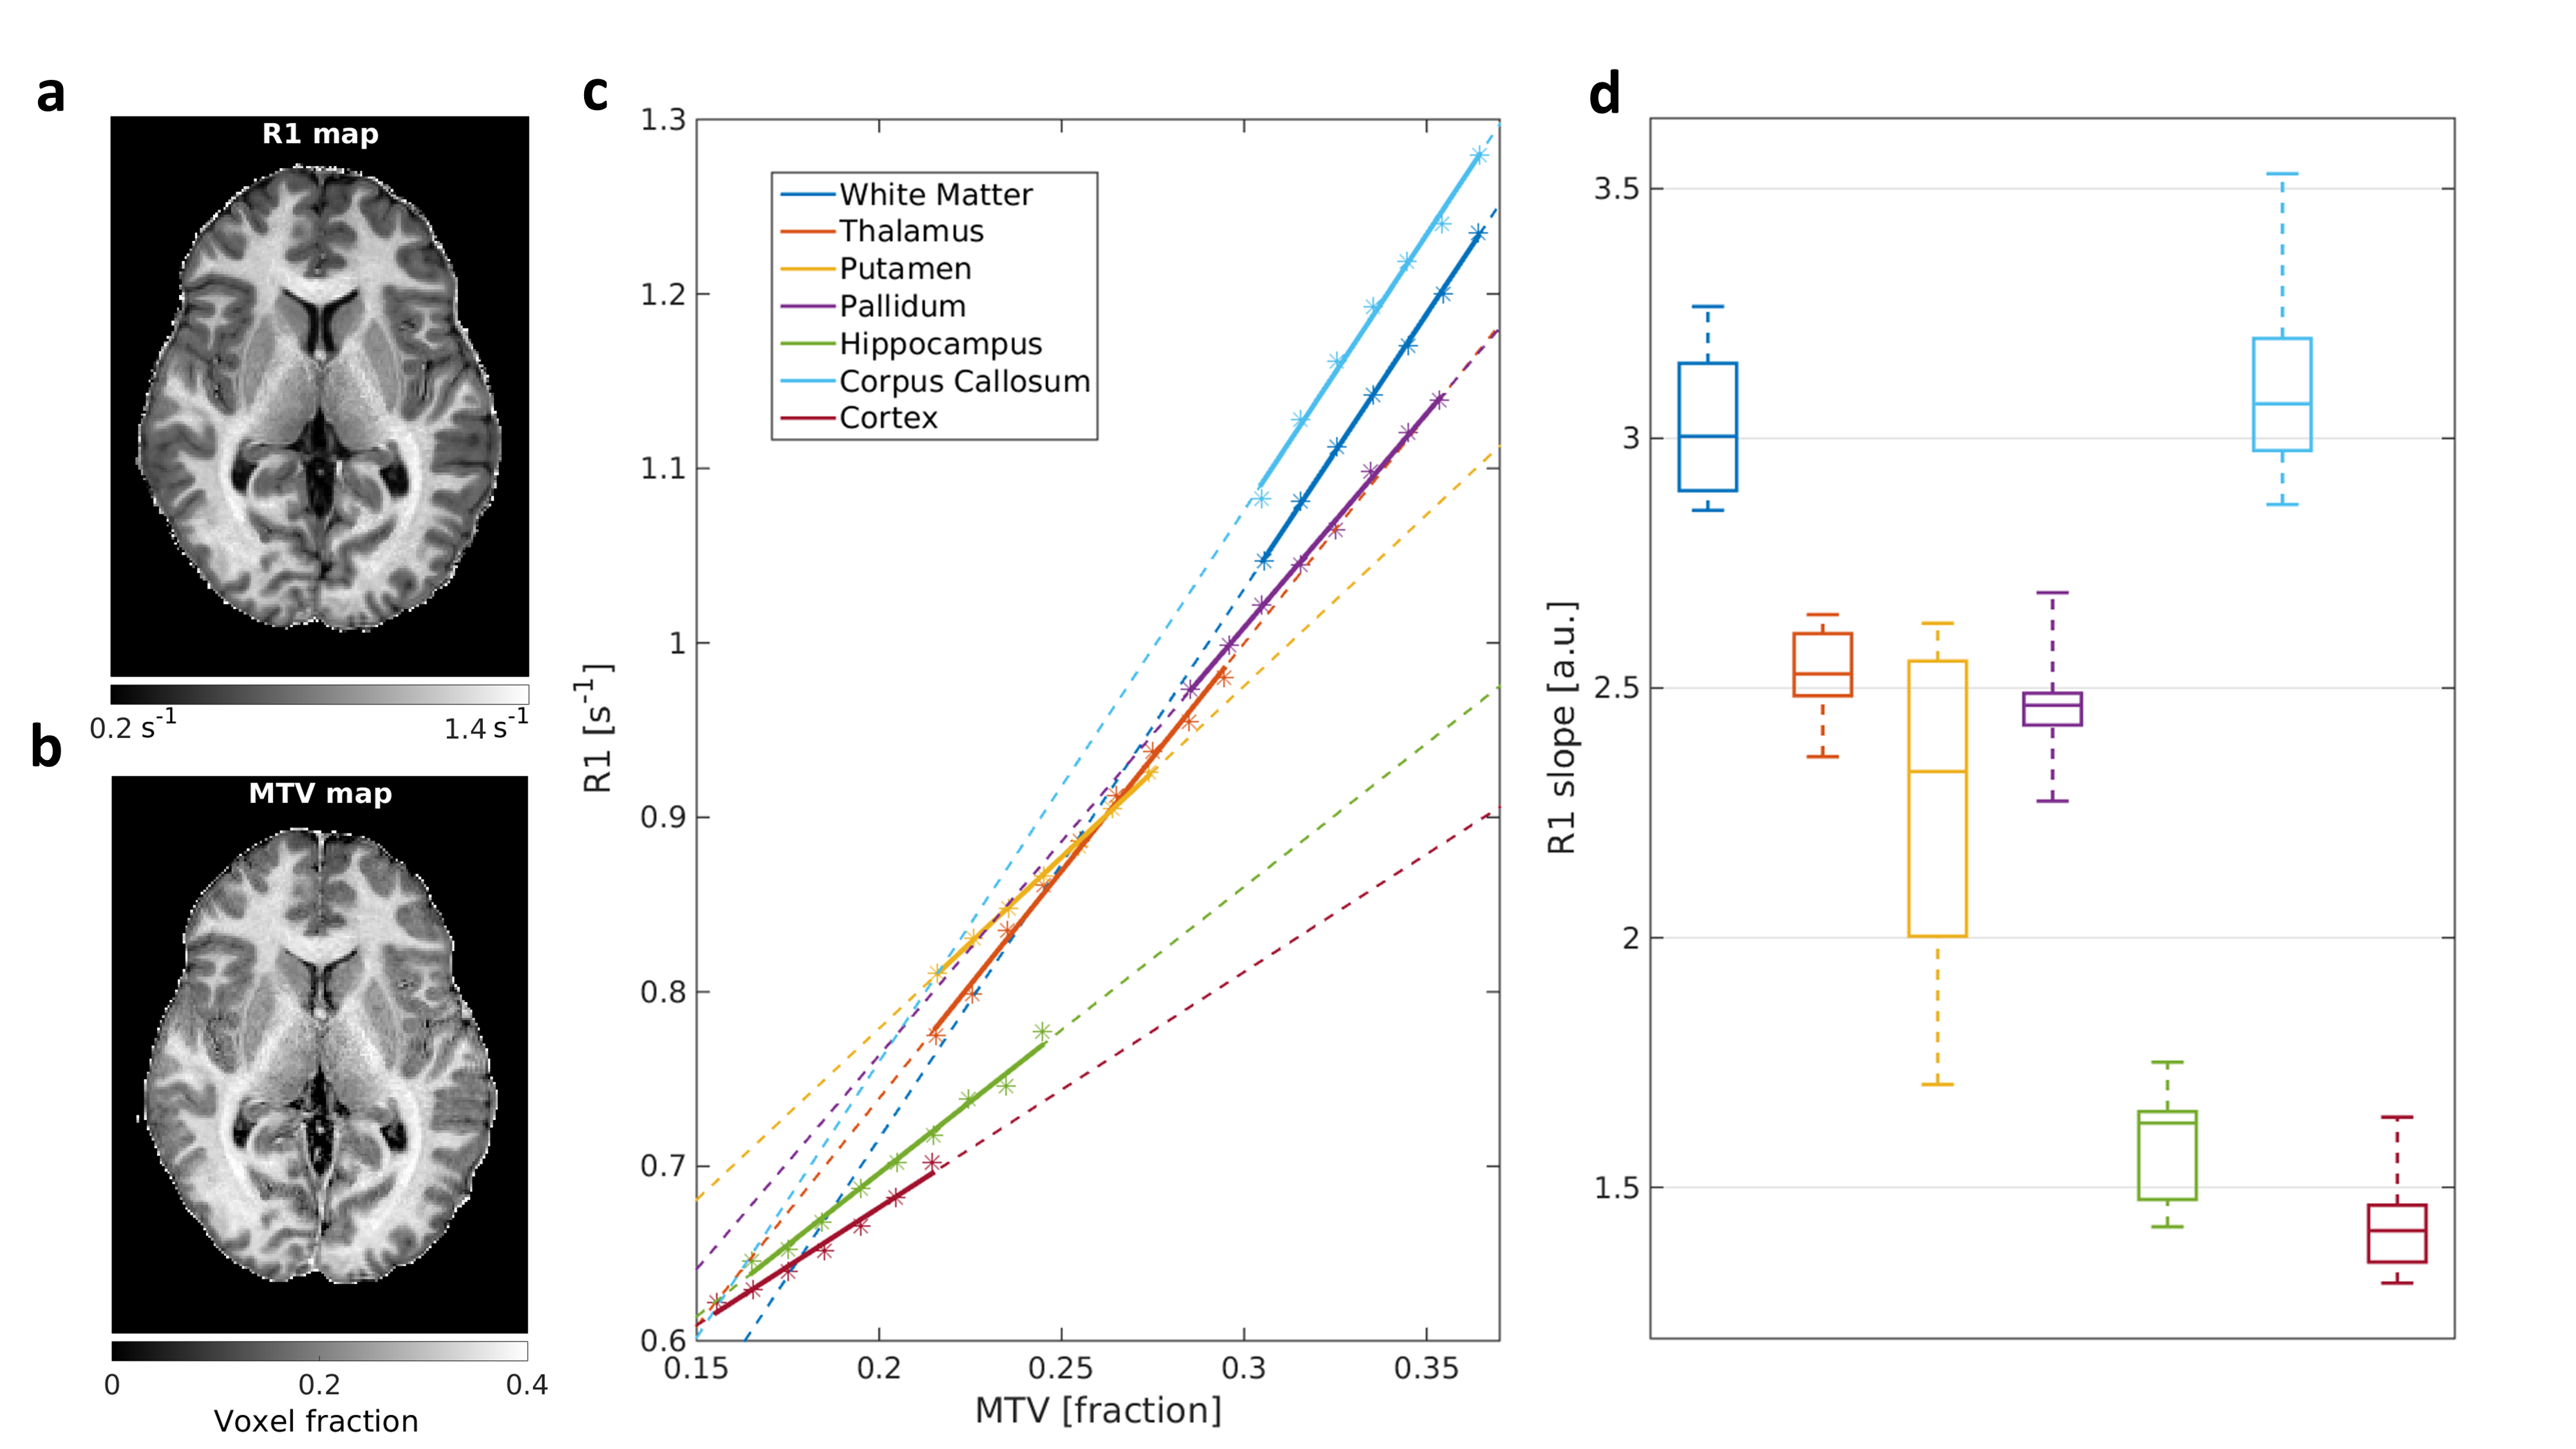
R1 dependency on MTV for different brain regions in the left hemisphere.
(a,b) Representative R1 and MTV maps.
(c) MTV values, pooled into bins (asterisks) in different brain regions of a single subject. For each region, the linear fit between R1 and MTV was calculated (colored lines. Dashed lines are extrapolations), and the slope was extracted.
(d) Boxplot of the different brain regions’ slopes across young subjects (n=10). In each box the ticks represent the 25th, 50th and 75th percentiles; whiskers are extreme data points. Different brain regions show different dependencies between R1 and MTV.
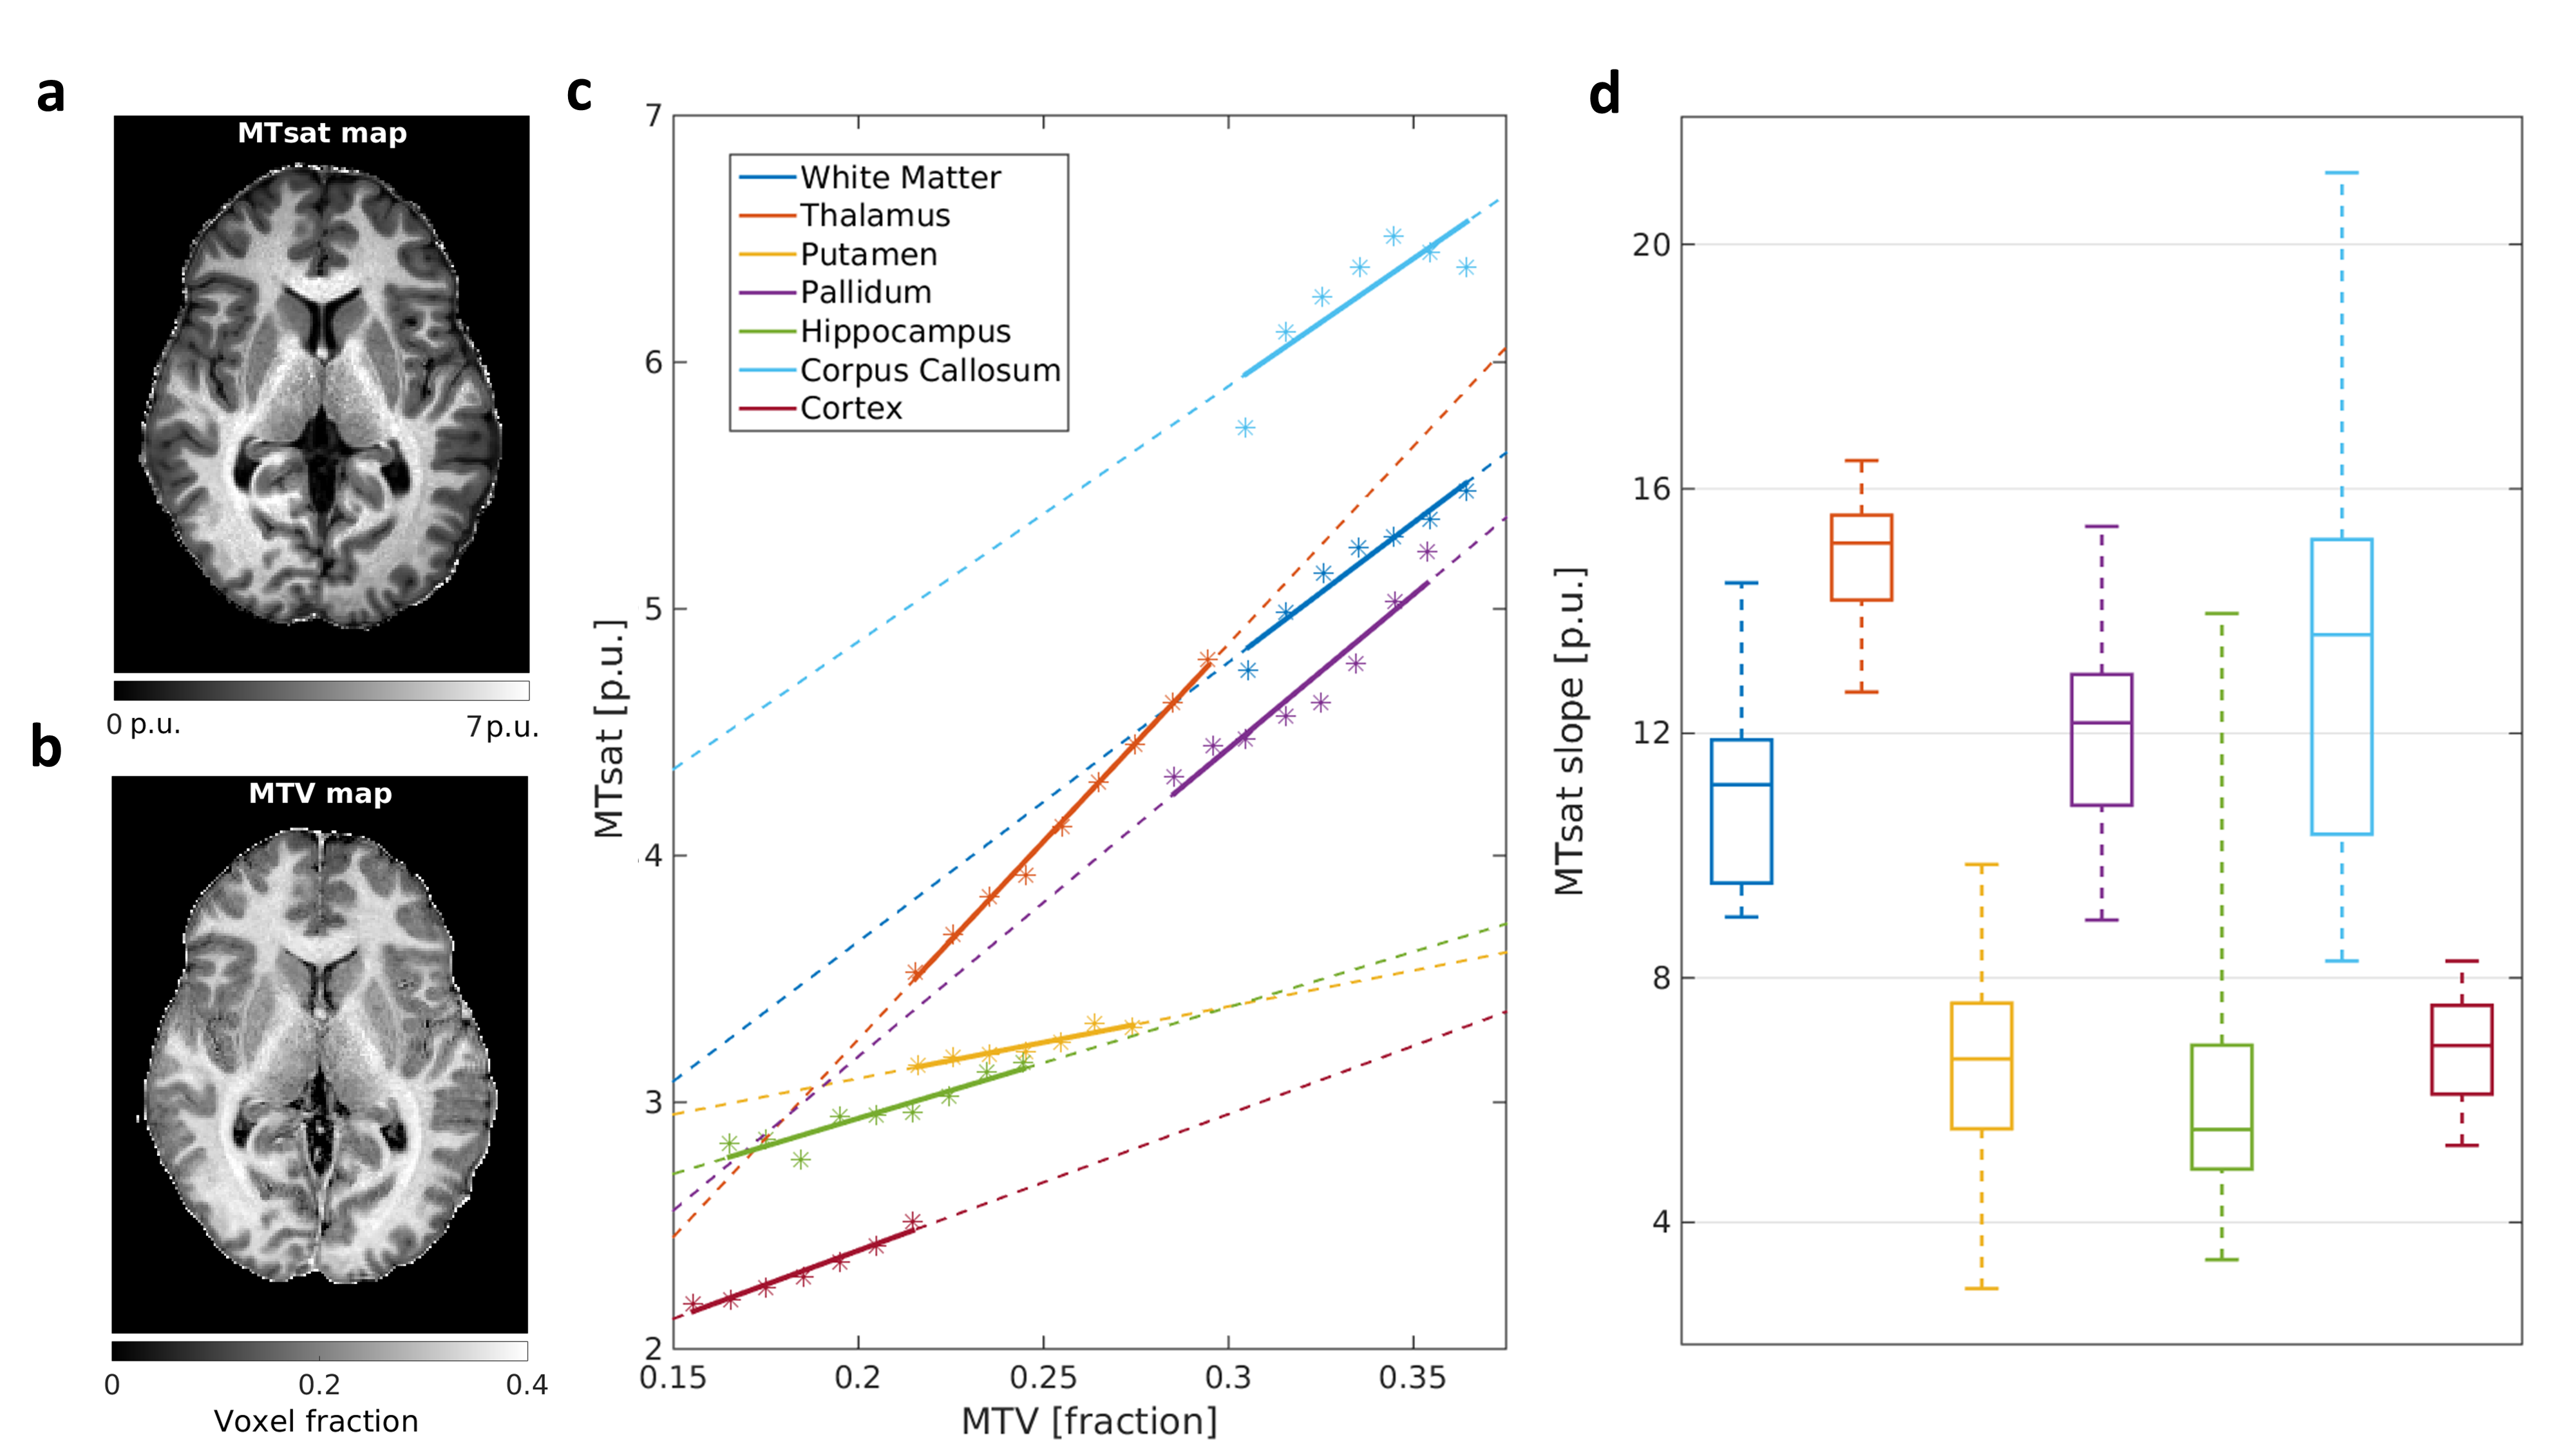
MTsat dependency on MTV for different brain regions in the left hemisphere.
(a,b) Representative MTsat and MTV maps.
(c) MTV values, pooled into bins (asterisks) in different brain regions of a single subject. For each region, the linear fit between MTsat and MTV was calculated (colored lines. Dashed lines are extrapolations), and the slope was extracted.
(d) Boxplot of the different brain regions’ slopes across young subjects (n=10). In each box the ticks represent the 25th, 50th and 75th percentiles; whiskers are most extreme data points. Different brain regions show different dependencies between MTsat and MTV.
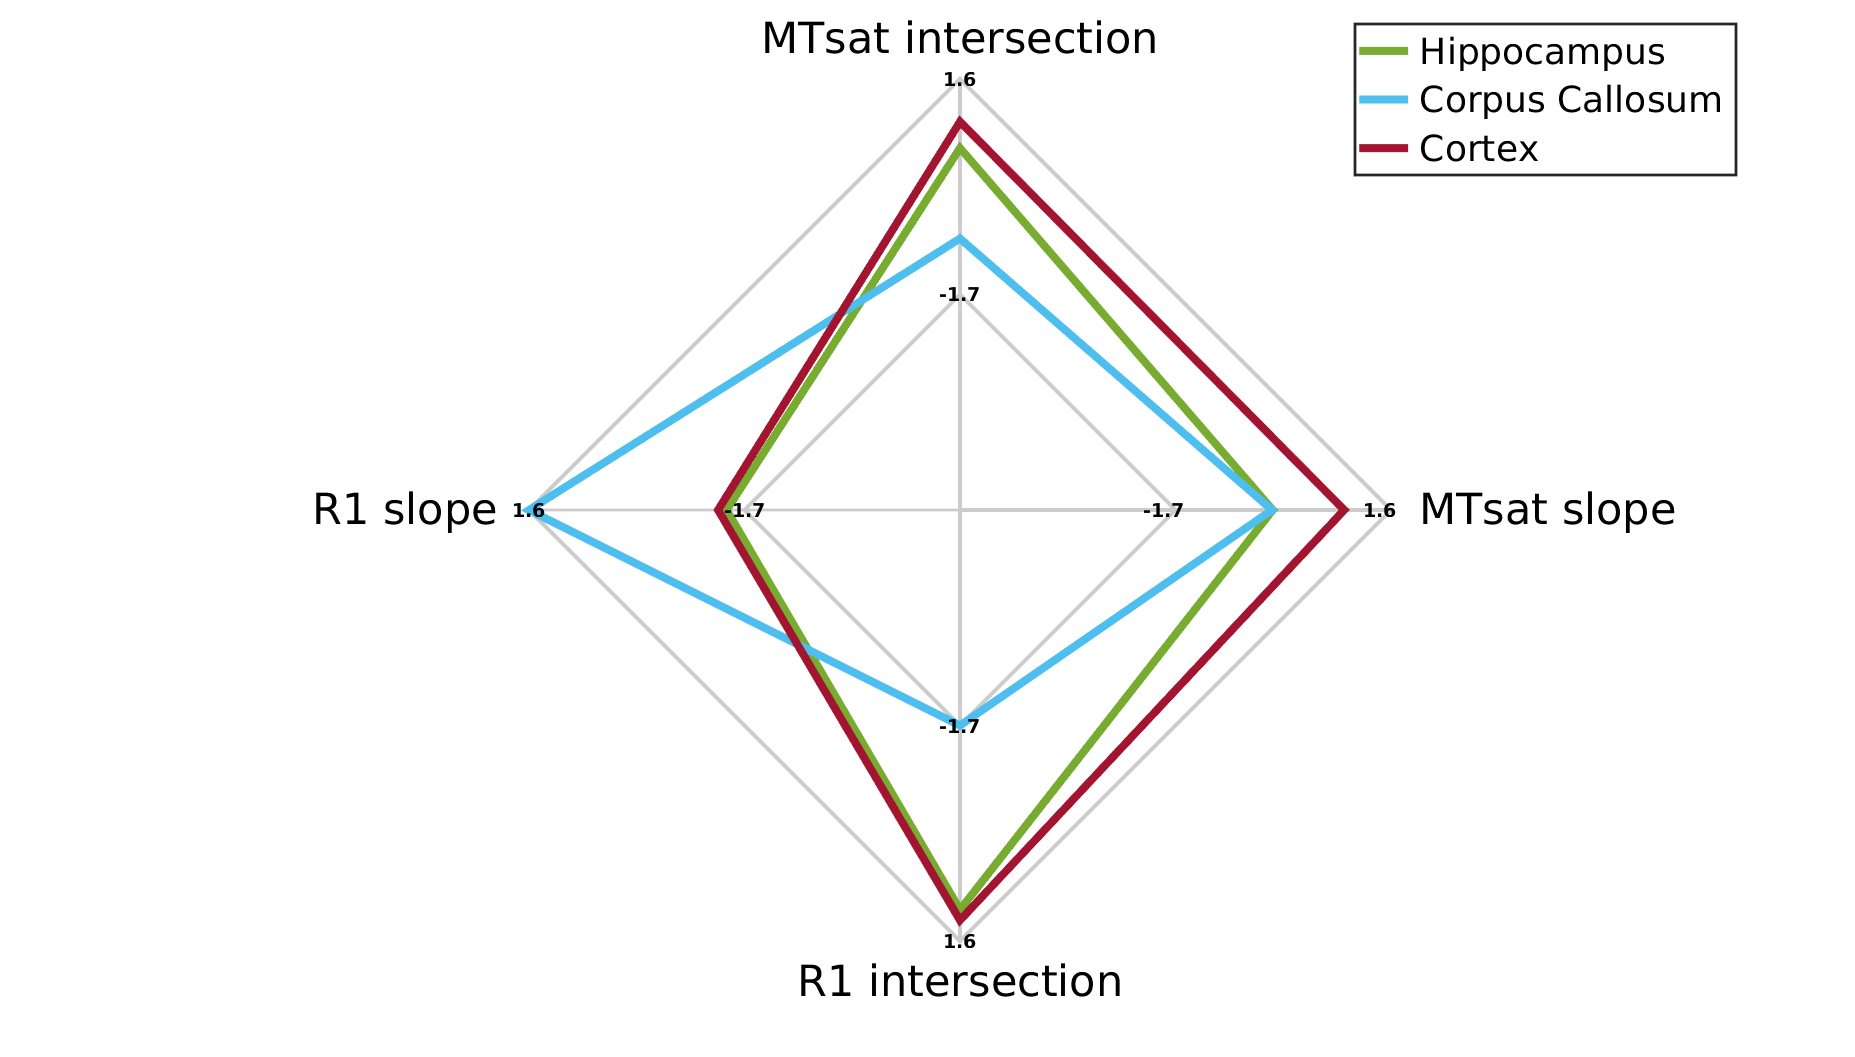
Quantifying unique signatures of different brain regions.
For each brain region, the median slope and intersection over subjects were calculated from the fit between R1 and MTsat to MTV (n=10). The spider plot shows these values (z-scored) for three example brain regions (corpus-callosum, cortex and hippocampus). Each axis generates a different separation between the regions. Together they can represent a unique tissue signature for brain regions. This signature captures the contribution of the underlying tissue to the qMRI signal after accounting for the water content contribution.
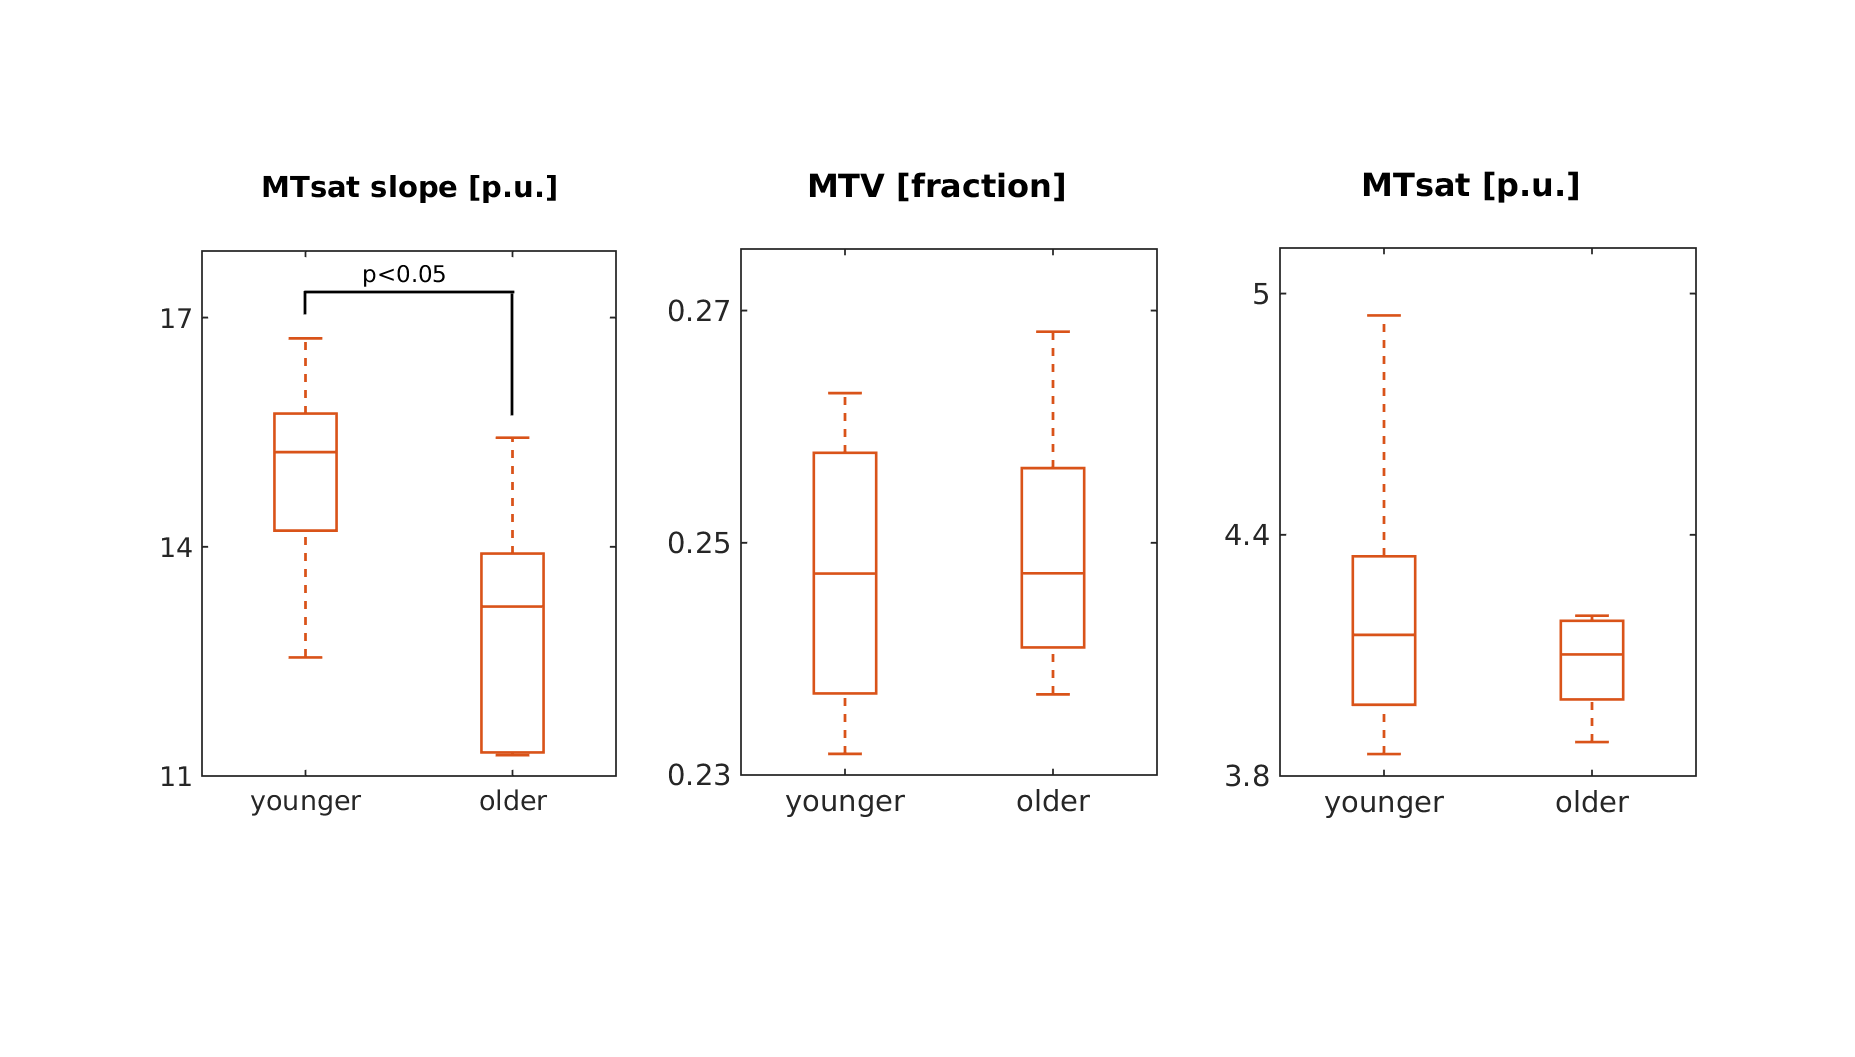
Tissue signature can reveal age related changes.
Mean MTV, mean MTsat and MTsat slope in the thalamus for younger (under 30, n=10) and older (over 55, n=5) subjects (box ticks are as in Figure 2). Significant p-values are shown (not corrected for multiple comparisons). In the thalamus, age-related effects emerge by the measurement of the MTsat slope.