0790
3D microscopy with CLARITY on human brain tissue: a tool for informing and validating MRI-based histology1Paul Flechsig Institute for Brain Research, University of Leipzig, Leipzig, Germany, 2Department of Neurophysics, Max Planck Institute for Human Cognitive and Brain Sciences, Leipzig, Germany, 3Center for Cognitive Neuroscience Berlin, Free University Berlin, Berlin, Germany
Synopsis
Recent developments of methods for mapping tissue microstructure with MRI require histological 3D data for validation. Here, CLARITY on post mortem human brain was adapted for this purpose. We demonstrated clearing of up to 8 mm thick samples, 3D microscopy of up to 5 mm thick samples, and the application of multiple stains including markers for neurons, glia, and fibers. The result is a detailed histology-based characterization of cyto- and myelo-architectonics within a volume corresponding to a typical MRI voxel. This approach promises to help integrate MRI-based histology and optical microscopy in 3D, and enable the further development and validation of in vivo histology using MRI.
Introduction
Recent developments in magnetic resonance imaging (MRI) brought quantitative relaxometry and diffusion-weighted imaging with sub-millimeter resolution into reach. In combination with biophysical models of MR contrast these methods promise in vivo mapping of cyto- and myelo-architectonics, i.e., in vivo histology using MRI (hMRI) in humans1. The hMRI methods rely on histological reference data for validation and model building, which is currently provided by MRI on post mortem human brain tissue in combination with classical histology on 2D sections. This approach is, however, limited to 2D information, while a validation of hMRI requires 3D information across macroscopic volumes. We explore a promising histological method based on optical 3D imaging combined with a tissue clearing method, Clear Lipid-exchanged Acrylamide-hybridized Rigid Imaging compatible Tissue hYdrogel (CLARITY)2, for informing and validating hMRI methods. Applying CLARITY in aged post mortem human brain tissue is challenging due to poor antibody penetration into large sample volumes and their high opacity3. We achieved transparency of up to 8mm-thick and immunohistochemical staining of up to 5mm-thick post mortem human brain tissue using an optimized clearing and staining procedure. We combined 3D optical imaging of the cleared samples with tailored image processing methods and demonstrated that quantification of neuron density, fiber orientation distribution and cell type classification is feasible in 3D within a volume similarly sized to a typical MRI voxel. The combination of MRI, 3D optical microscopy and image processing is a promising tool for validation of MRI-based microstructure estimatesMethods
Blocks from two formalin fixed human post mortem brains (Case 1: female, 69 years old, post mortem interval prior to fixation (PMI) 24h, size 30 mm x 50 mm x 8 mm; Case 2: male, 54 years old, PMI 96h, 30 mm x 38 mm x 8 mm) were polymerized in hydrogel solution and cleared using a combination of active and mild passive clearing4 with prolonged clearing times (from 2 to 14 months). MRI was performed at primary stages of the clearing process on a whole body 7T MRI scanner (Magnetom, Siemens, Erlangen, Germany), to monitor tissue distortion and MR contrast changes upon clearing. Quantitative R1 maps were acquired with the MP2RAGE sequence5 with isotropic resolution of 0.36 mm, TI1/TI2=200/900 ms, repetition time TR=3 s. Quantitative R2* maps were obtained from multi-echo 3D FLASH images (6 echoes, TE1-6=4 .. 50 ms, TR=100 ms) with 0.3 mm isotropic resolution. To test for potential changes of protein content and microstructure due to clearing, tissue blocks were cut into smaller subsamples and stained for neurons (HuC/D), fast spiking interneurons (parvalbumin), myelinated fibers (myelin basic protein [MBP]), astro- (GFAP) and microglia (Iba-1) with a multiple immunofluorescence approach and optical 3D imaging. The tissue samples were scanned in 3D with a Zeiss confocal laser-scanning microscope (LSM 510 Meta, Zeiss, Jena, Germany) and a LaVision light-sheet fluorescence microscope (UltraMicroscope II, LaVision BioTec, Bielefeld, Germany). Random Forest classifiers were used to analyze 3D optical images.Results and Discussion
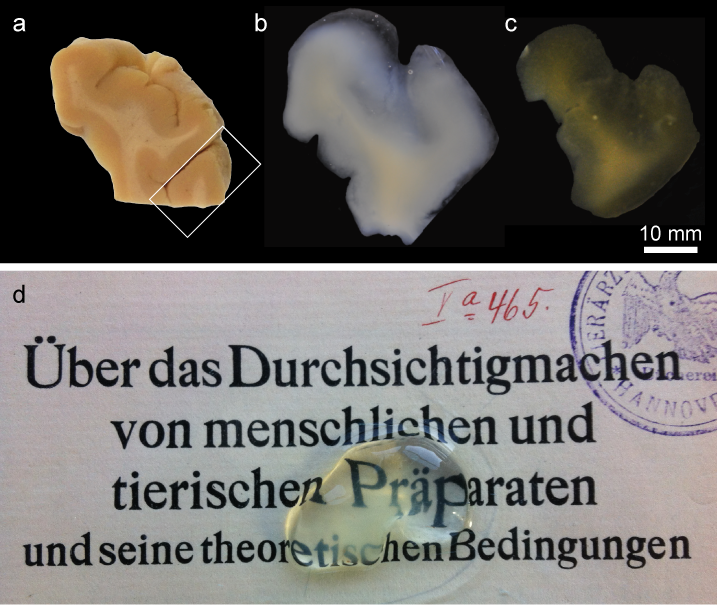
After two to fourteen months of active and
passive clearing all brain tissue blocks became transparent (Fig. 1). R1 and R2* decreased and contrast between white and grey matter vanished
upon clearing in line with the known major contribution of lipids to both relaxation
processes (Fig. 2). The immunohistochemical stains demonstrated that, despite
lipid removal due to CLARITY, most tissue proteins were well preserved,
allowing a visualization of multiple cellular and fiber compartments (Fig. 3). High
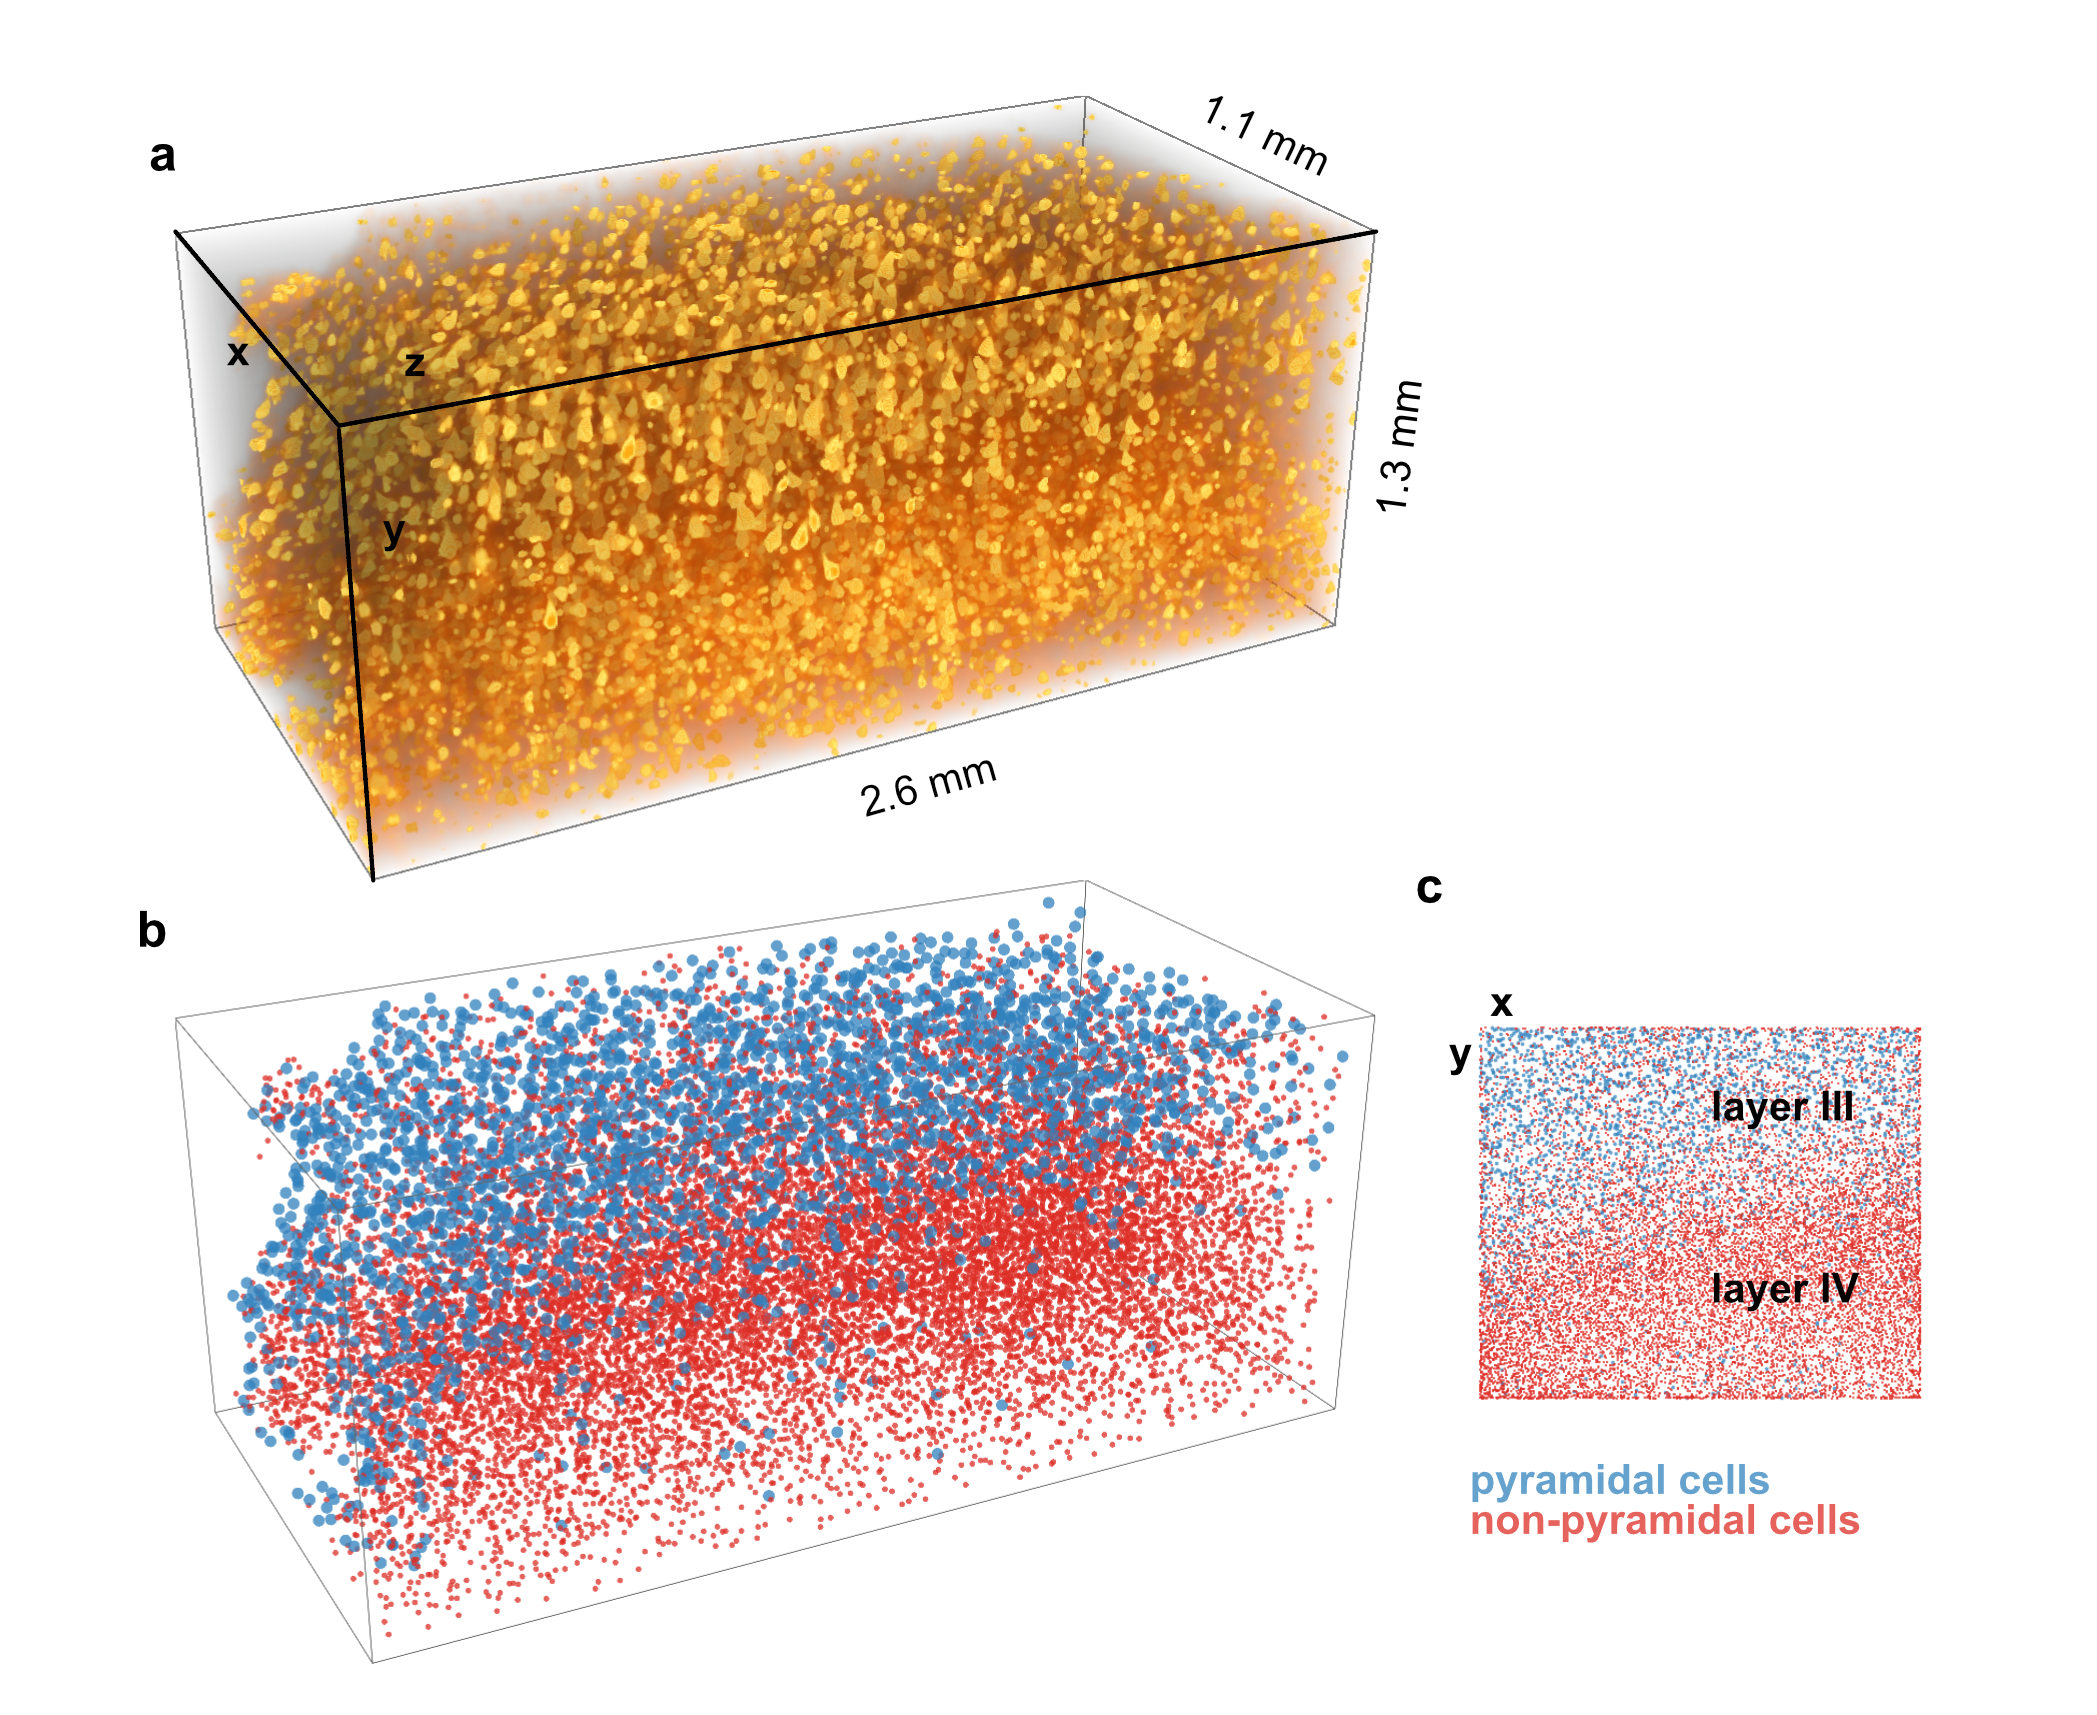
quality 3D optical imaging was performed on cleared subsamples stained for
neurons and myelinated fibers. Automated image analysis methods provided comprehensive
3D cytoarchitectonics in a volume of 2.6 mm x 2.6 mm x 2.2 mm (Fig. 4). Maps of
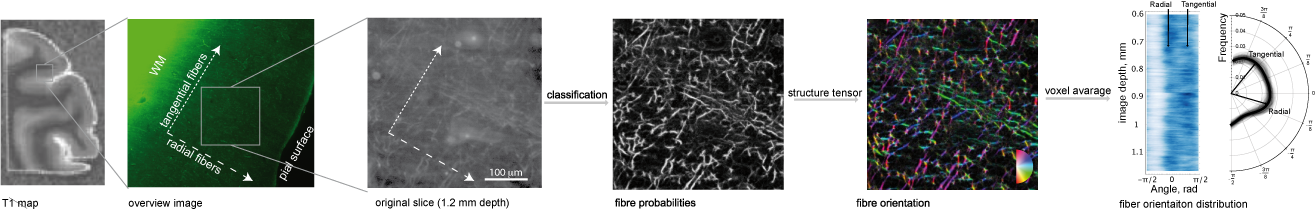
the distribution of fiber orientation in the volume of 1.2 mm x 1.2 mm x 1.2 mm
were extracted from 3D images (Fig. 5)Conclusions
We propose an advanced histological approach, which can be used to inform and validate methods for in vivo histology using MRI. The approach combines quantitative MRI, tissue clearing, fluorescent staining, 3D optical imaging and image analysis and can be applied to aged post mortem human brain tissue. We have shown that the procedure preserves the tissue’s primary microstructure and protein content thus enabling the comprehensive analysis of microstructure, cyto- and myeloarchitectonics of macroscopic human cortex samples in 3D. We demonstrated that the achieved tissue transparency facilitates single fiber identification and structure tensor analysis across a volume corresponding to the voxel size of state-of-the-art diffusion-weighted imaging acquisitions or even larger volumes. This approach promises to help integrate MRI-based histology and optical microscopy in 3D, and enable the further development of in vivo histology using MRI.Acknowledgements
We like to thank Dr. Jens Stieler for helping in modifying the electrophoresis chamber. Further we like to thank Dr. Uwe Schroer for optical imaging with commercial light-sheet microscope from LaVision (Bielefeld, Germany). The research leading to these results has received funding from the European Research Council under the European Union's Seventh Framework Programme (FP7/2007-2013) / ERC grant agreement n° 616905. This project has received funding from the BMBF (01EW1711A & B) in the framework of ERA-NET NEURON.References
1. Weiskopf, N., Mohammadi, S., Lutti, A. & Callaghan, M. F. Advances in MRI-based computational neuroanatomy: from morphometry to in-vivo histology. Curr. Opin. Neurol. 28, 313–322 (2015).
2. Chung, K. & Deisseroth, K. CLARITY for mapping the nervous system. Nat. Methods 10, 508–513 (2013).
3. Liu, A. K. L. et al. Bringing CLARITY to the human brain: visualization of Lewy pathology in three dimensions. Neuropathol. Appl. Neurobiol. 42, 573–587 (2016).
4. Costantini, I. et al. A versatile clearing agent for multi-modal brain imaging. Sci. Rep. 5, 9808 (2015).
5. Marques, J. P. et al. MP2RAGE, a self bias-field corrected sequence for improved segmentation and T1-mapping at high field. Neuroimage 49, 1271–1281 (2010).
6. Spalteholz, W. Über das Durchsichtigmachen von menschlichen und tierischen Präparaten und seine theoretischen Bedingungen, nebst Anhang: Über Knochenfärbung. (S. Hirzel, 1914).
Figures