0787
Towards short dipolar relaxation time, T1D, MRI1Division of MR Research, Radiology, Beth Israel Deaconess Medical Center, Harvard Medical School, Boston, MA, United States, 2CNRS, CRMBM, UMR 7339, Aix Marseille Universite, Marseille, France
Synopsis
The inhomogeneous magnetization transfer (ihMT) technique has shown myelin sensitivity, and is understood to be dependent on power and the dipolar relaxation time parameter, T1D, which is longer in myelinated tissues. Implementation of ihMT can be adapted to provide a smaller, but non-negligible signal from other, relatively short T1D tissues. Simulations showed a measurable ihMT signal, achieved from fixed low duty cycle MT preparations with high B1 pulses, decayed with pulse width at a rate dependent on T1D. Thus short, high B1 pulses were implemented to acquire ihMT data from ex-vivo samples of rat heart, kidney, and tail tendon, demonstrating the feasibility of short T1D imaging.
Introduction
The inhomogeneous magnetization transfer (ihMT) technique gained attention for its myelin-associated contrast.1 Further understanding of the nature of the ihMT signal associated its dependence on residual dipolar coupling.2 In terms of the two-pool model of MT, extended using spin temperature formalism, the ihMT signal is mediated by the dipolar relaxation time, T1D, parameter.3,4 T1Ds measured in ex-vivo white matter (WM) and gray matter (GM) are relatively long (at physiological temperature) compared to other tissues, and explain the selective signal observed in vivo.5 However the correlation of ihMT with T1D also provides evidence that an ihMT signal (albeit small) is measurable in other tissues.3 The use of low duty cycle ihMT preparations shows a measurable ihMT signal from the relatively short T1D tissue of muscle.6 Manning et al. have also shown that an ihMT signal is measurable from other non-lipid-based samples and point out its dependence on the power T1D product.4 We explore the use of short (of varying width), high B1 pulses in a low duty cycle preparation to obtain ihMT signal from organs outside the central nervous system to assess the feasibility of ihMT MRI outside the brain.Methods
Simulations were conducted based on steady-state solutions of the two-pool MT model differential equations for pulsed MT experiments7, with and without terms for the dipolar order of the restricted pool to account for single and dual frequency MT preparations.3,8 WM and GM parameters were taken from high-field quantitative MT literature.9 Tissues were excised from an 8-week old female Sprague-Dawley rat, in accordance with institutional animal care and use committee protocol, and placed in an abundance of formalin for ≥48hours, before placement in smaller containers for MRI. MRI was conducted on a 9.4T scanner (Biospec, Bruker) with a volume transmit coil and 4-channel receive mouse brain array. Temperature was monitored using a fiber optic probe (±1°C) and regulated by heated forced air (SA Instruments). IhMT data were acquired with single or dual off-resonance frequency preparatory pulses (Gaussian, with 0.4 shape ratio compared to rectangular pulse of same duration) applied every 50ms for 1s (B1,RMS=3μT), followed by 48 gradient-echo readouts (TE/TR=2.8/6.7ms), repeated to cover all phase encodes required for a 3D volume. Off-resonance RF was applied at: ±7kHz in the brain; ±10kHz for other tissues, and dual frequency preparations were achieved by appropriate cosine modulation. The ihMT signal was calculated as the difference between data prepared with single or dual frequency RF irradiation, and division by the signal following a B1,RMS=0μT preparation provided an ihMT ratio (ihMTR).Results
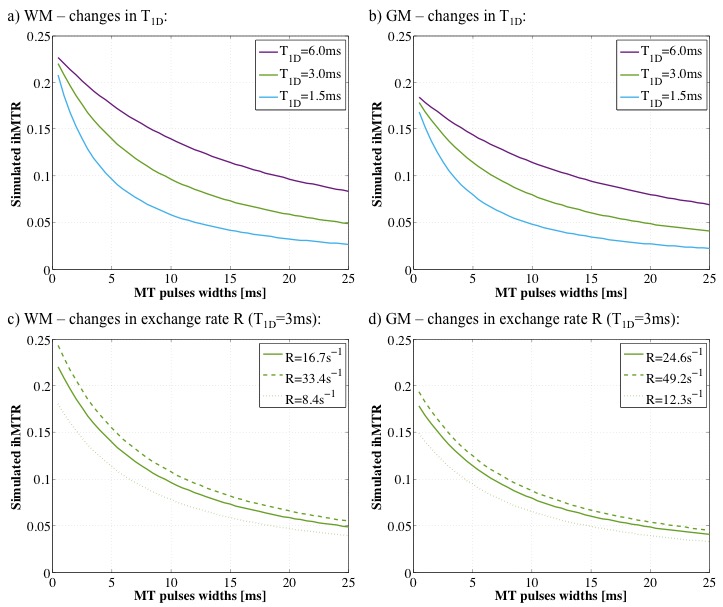
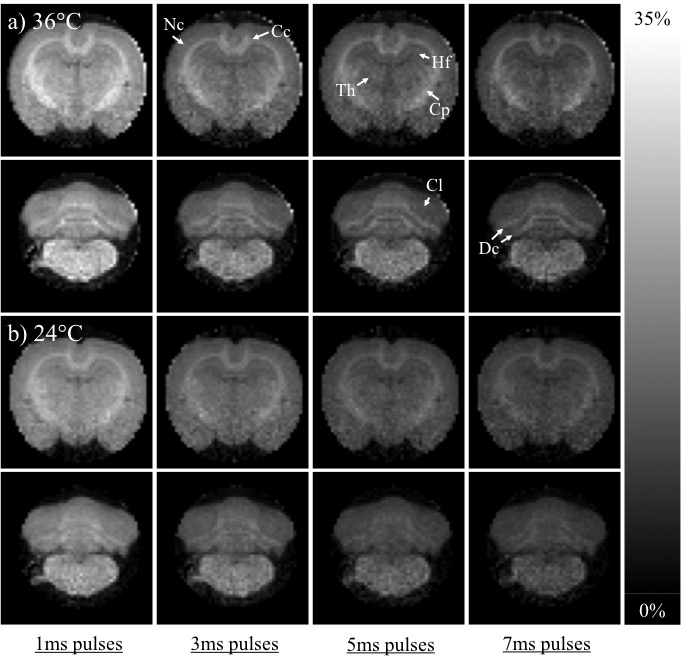
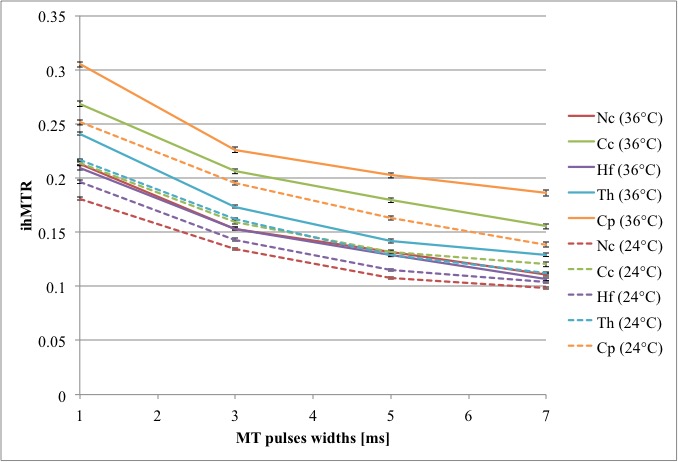
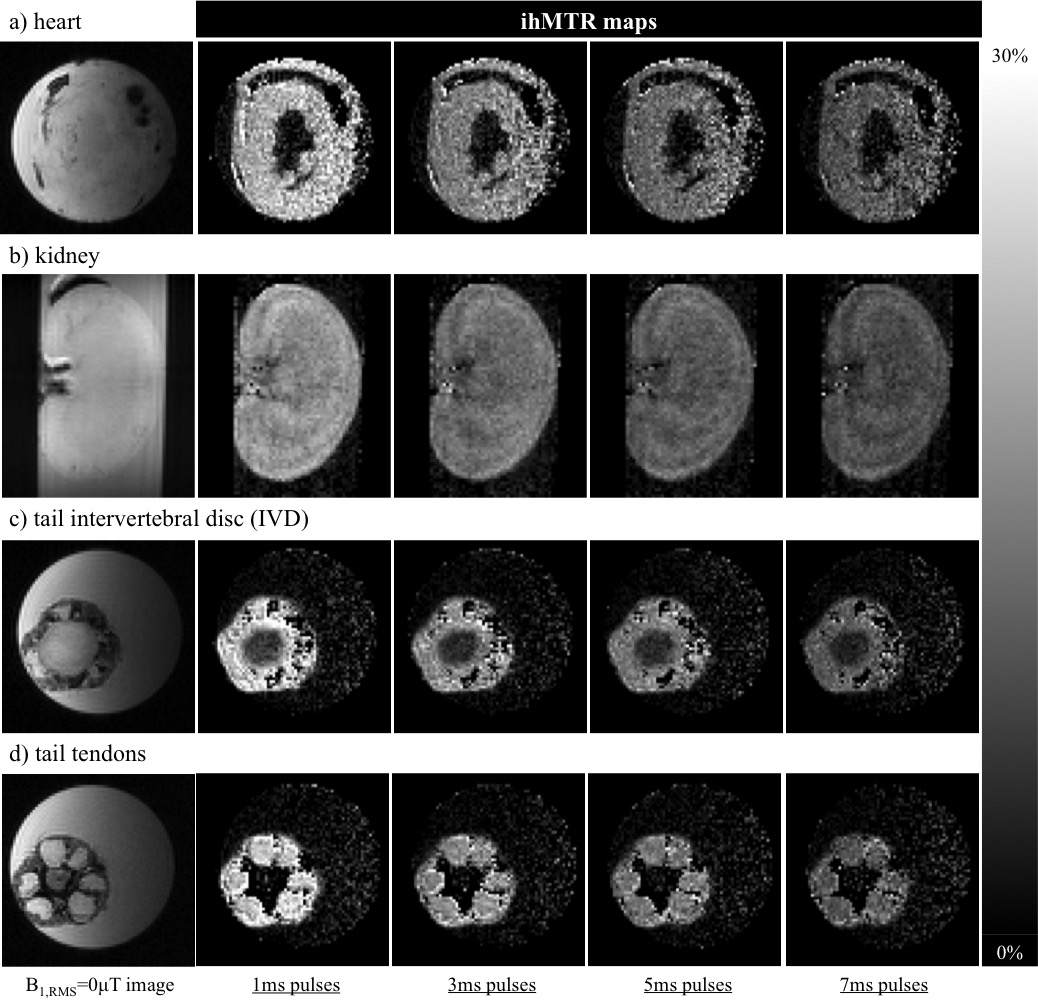
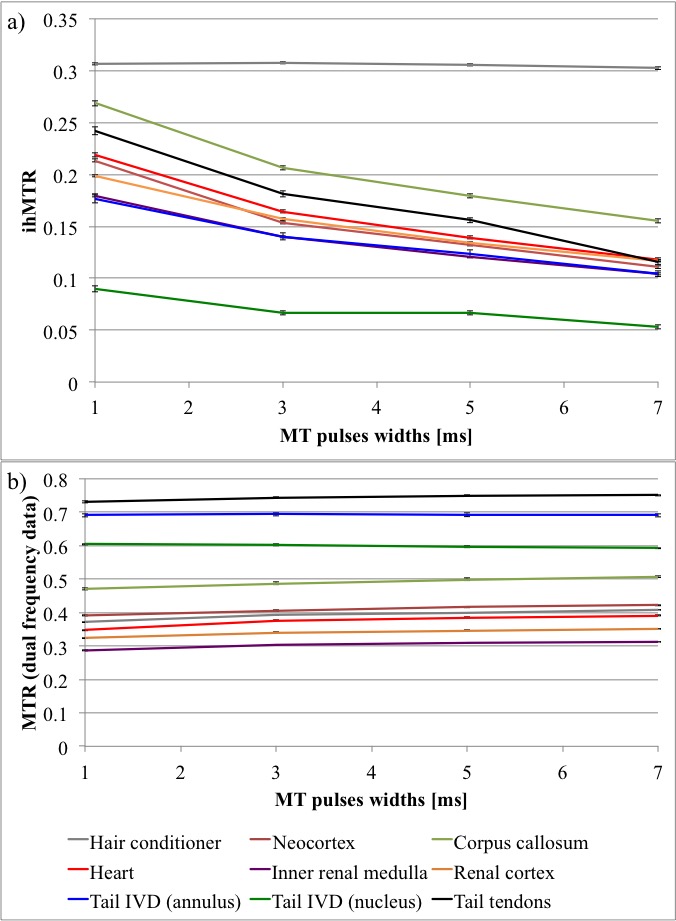
The simulated ihMTRs for WM and GM decayed with pulse width for a fixed repetition period and B1,RMS over that period (Fig. 1). A faster decay is apparent for shorter simulated T1D values, whereas for changes in the simulated exchange rate the decay rate remained more consistent. Differentiation of deeper cerebellum (Dc) from surrounding cell layer (Cl) was improved at 36°C (Fig. 2). Short 1ms pulses still provided a visible ihMTR contrast between WM and GM regions at room temperature (Figs. 2-3). Preparation with such short, high B1 pulses provided average ihMTRs ≥20% in the heart, renal cortex, and tail tendons (Fig. 4). The ihMTR in the annulus was twice that in the nucleus of a tail intervertebral disc (IVD). All samples showed the decrease in ihMTR with pulse width expected from simulations, while MTR (from dual frequency data) increased slightly (Fig. 5).Discussion
Simulation of ihMTR as a function of pulse width for a fixed repetition period in the ihMT preparation suggests a decay that is more rapid for decreasing T1D values (Fig. 1). However the simulated ihMTRs suggest a convergence for an infinitesimal pulse width. Thus short, high B1 pulses should provide ample ihMT signal in relatively short T1D tissues, and implementation of 1ms Gaussian pulses every 50ms with B1,RMS=3μT was shown to do so for ex-vivo samples of rat: brain at 24°C, heart, kidney, IVD and tendons (Figs. 2b,4). The difference in ihMTR for 1ms pulses and the decay with pulse width at 36°C and 24°C, in various regions of the brain, suggests a change in exchange rate (Figs. 1c-d,3). Relatively slow decay in ihMTR compared with simulation was likely the result of a mismatch in pulse shapes (Figs. 1a-b,5). Given the expectation of T1D mediated decay, further work will explore the potential for ihMT signal variation with pulse width to assist with quantification of T1D.Conclusions
The use of a low duty cycle preparation, i.e. short, high B1 pulses, provided measurable ihMT signal in ex-vivo tissues outside of the brain. The simulations and results provide a framework for translation in-vivo to explore the utility of ihMT MRI of relatively short T1D tissues.Acknowledgements
No acknowledgement found.References
1. Varma G, Duhamel G, de Bazelaire C, et al. Magnetization transfer from inhomogeneously broadened lines: A potential marker for myelin. Magn Reson Med. 2015;73(2):614-622.
2. Girard OM, Prevost VH, Varma G, et al. Magnetization from inhomogeneously broadened lines (ihMT): Experimental optimization of saturation parameters for human brain imaging at 1.5 Tesla. Magn Reson Med. 2015;73(6):699-709.
3. Varma G, Girard OM, Prevost VH, et al. Interpretation of magnetization transfer from inhomogeneously broadened lines (ihMT) in tissues as a dipolar order effect within motion restricted molecules. J Magn Reson. 2015;260:67-76.
4. Manning AP, Chang KL, MacKay AL, et al. The physical mechanism of “inhomogeneous” magnetization transfer MRI. J Magn Reson. 2017;274:125-136.
5. Swanson SD, Malyarenko DI, Fabiilli ML, et al. Molecular, dynamic, and structural origin of inhomogeneous magnetization transfer in lipid membranes. Magn Reson Med. 2017;77(3):1318-1328.
6. Varma G, Grant A, Girard O, et al. Modeling the increased inhomogeneous magnetization transfer (ihMT) signal from high amplitude, low duty cycle irradiation. Proc ISMRM. 2017:1986.
7. Portnoy S and Stanisz GJ. Modeling pulsed magnetization transfer. Magn Reson Med. 2007:58(1):144-155.
8. Sled J and Pike G. Quantitative interpretation of magnetization transfer in spoiled gradient echo sequences. J Magn Reson. 2000:145;24-36.
9. Naumova AV, Akulov AE, Khodanovich MY, et al. High-resolution three-dimensional macromolecular proton fraction mapping for quantitative neuroanatomical imaging of the rodent brain in ultra-high magnetic fields. NeuroImage 2017;147:985-993.
Figures