0786
Whole brain inhomogeneous Magnetization Transfer (ihMT) imaging at 3T: concentrating RF power to mitigate RF inhomogeneities effects1Aix Marseille Univ, CNRS, CRMBM, Marseille, France, 2BIDMC, Harvard Medical School, Boston, MA, United States, 3Phelma, INPG, Grenoble, France, 4Aix Marseille Univ, APHM, Hôpital de La Timone, Pôle d’Imagerie Médicale, CEMEREM, Marseille, France, 5Aix Marseille Univ, APHM, Hôpital de La Timone, Pôle de Neurosciences Cliniques, Service de Neurologie, APHM, Marseille, France
Synopsis
Inhomogeneous magnetization transfer (ihMT) is a new MRI modality that provides strong sensitivity to myelinated tissues. Previously, a 3D whole brain ihMT sequence, based on GRE readouts interleaved with bursts of MT saturation pulses, was developed and optimized at 1.5T. In this work we demonstrate that concentrating the MT pulse energy can mitigate the sensitivity of ihMT to RF inhomogeneities encountered in high field systems. Overall, this allows for 1.5mm3 resolution ihMTR maps to be acquired at 3T, with a reduced B1-induced bias and strong signal within the whole brain, allowing robust clinical applications of ihMT at 3T.
Purpose
Inhomogeneous magnetization transfer (ihMT) is a new MRI modality that provides strong sensitivity to myelinated tissue (1,2). It can be envisioned as a dipolar relaxation time (T1D)-weighted sequence (3) which can be configured to reveal selectively myelin associated long-T1D components (4,5). A strong correlation with myelin specific histology (6) was recently observed, showing promise for ihMT as an in vivo myelin biomarker. Previously, a 3D whole brain ihMT sequence, based on steady-state GRE readouts interleaved with bursts of MT saturation pulses, was developed and optimized at 1.5T (7). Studying this sequence revealed the strong impact of the temporal distribution of the MT pulse bursts (leading to more or less concentrated or distributed RF energy, see Fig.1), which modifies ihMT signal intensity and associated B1 dependency. Whereas a linear B1 dependency was obtained for a distributed RF deposition, saturation of the ihMT signal with B1 was observed for the most concentrated configuration (bursts of high power MT pulses followed by long readouts). The latter configuration should provide in principle a reduced sensitivity to the RF inhomogeneities that are encountered at high field. The purpose of this work is to investigate further this hypothesis and to assess strategies, different than those used at lower magnetic field, to implement and optimize ihMT at 3T.Methods
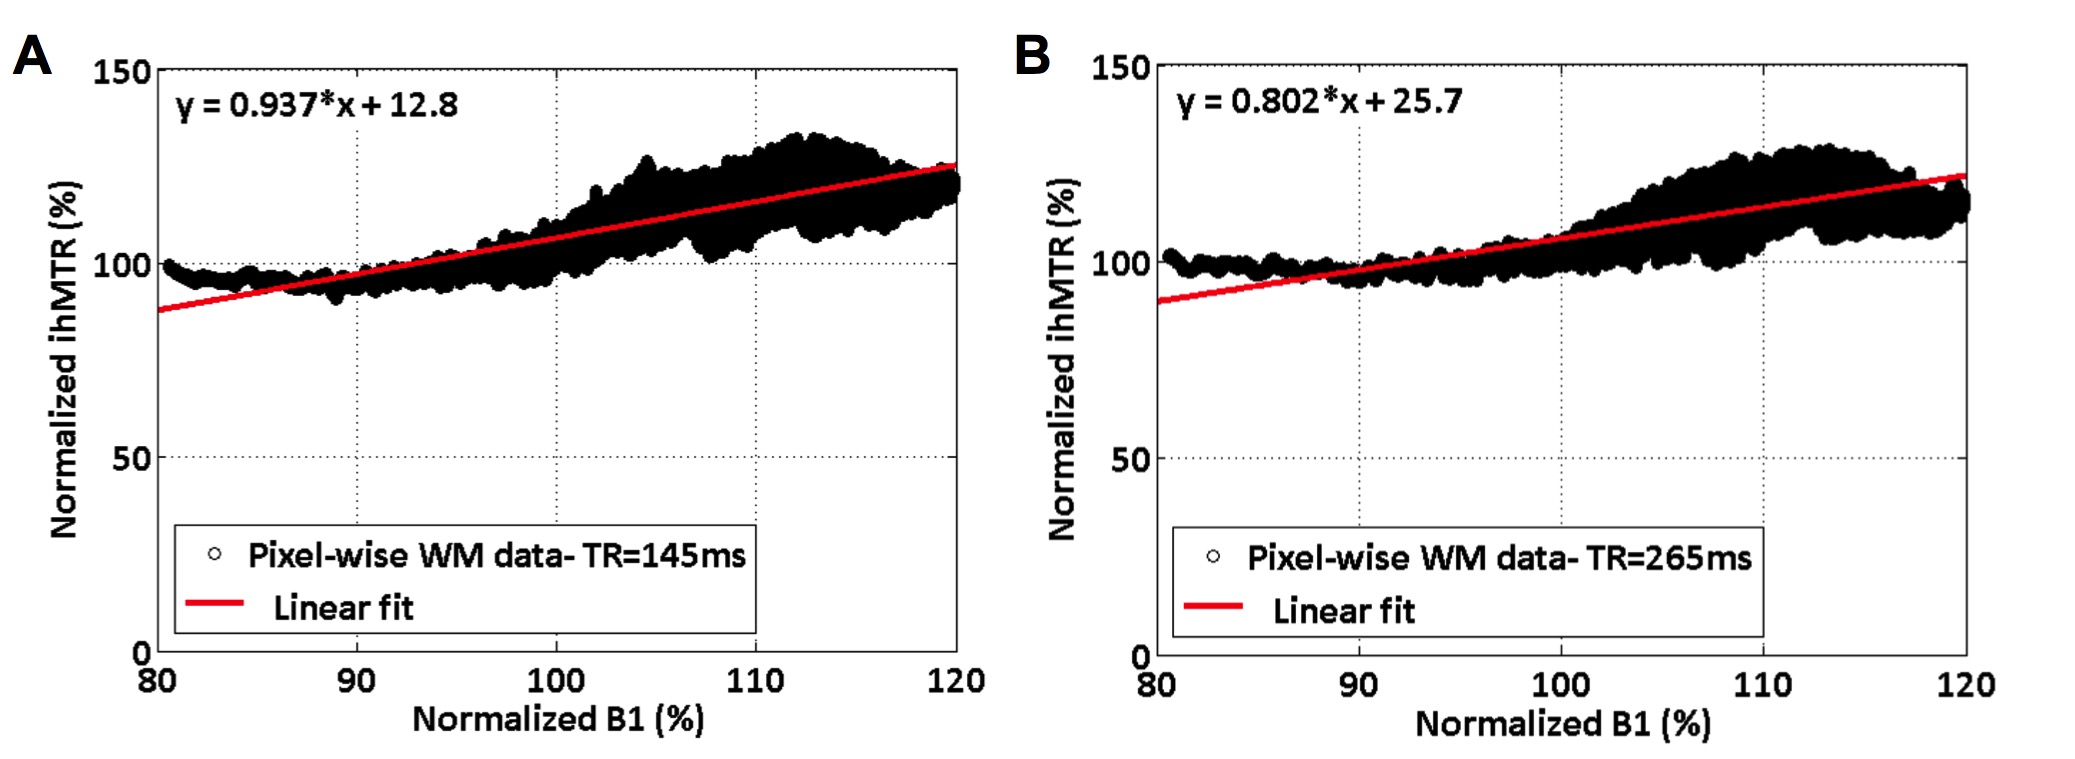
Experiments were performed on a 3T system (Verio, Siemens, Erlangen, Germany) with a 32-channel receive only head coil on healthy volunteers. The protocol included 3D MPRAGE imaging for automatic segmentation of brain structures, B1 mapping (VB17 Siemens WIP #658, spin echo variant comparing spin- and stimulated- echo signals) for measuring transmit B1 inhomogeneities and ihMT-GRE sequences. The latter were run for a constant B1RMS of 2.7uT with TR varying from 24 to 265ms (experimental parameters given in Fig.2), leading to progressive concentration of RF energy within the MT pulse bursts. ihMT-GRE scans were repeated with a reference voltage (Vref) set to 80% of its nominal values to assess the effect of a -20% drop in B1 intensity on the ihMT signal, as a way to mimic RF inhomogeneities. In a separate experiment, high resolution 1.5mm3 ihMT-GRE scans were run for high and moderate energy concentration (TR of 265ms and 145ms, respectively) and residual correlation with B1 was performed in the whole White Matter (WM) area by a linear fit of a smoothed pixelwise ihMTR vs. B1 representation. The ihMT signal processing and automatic segmentation were performed as documented in (7).Results & Discussion
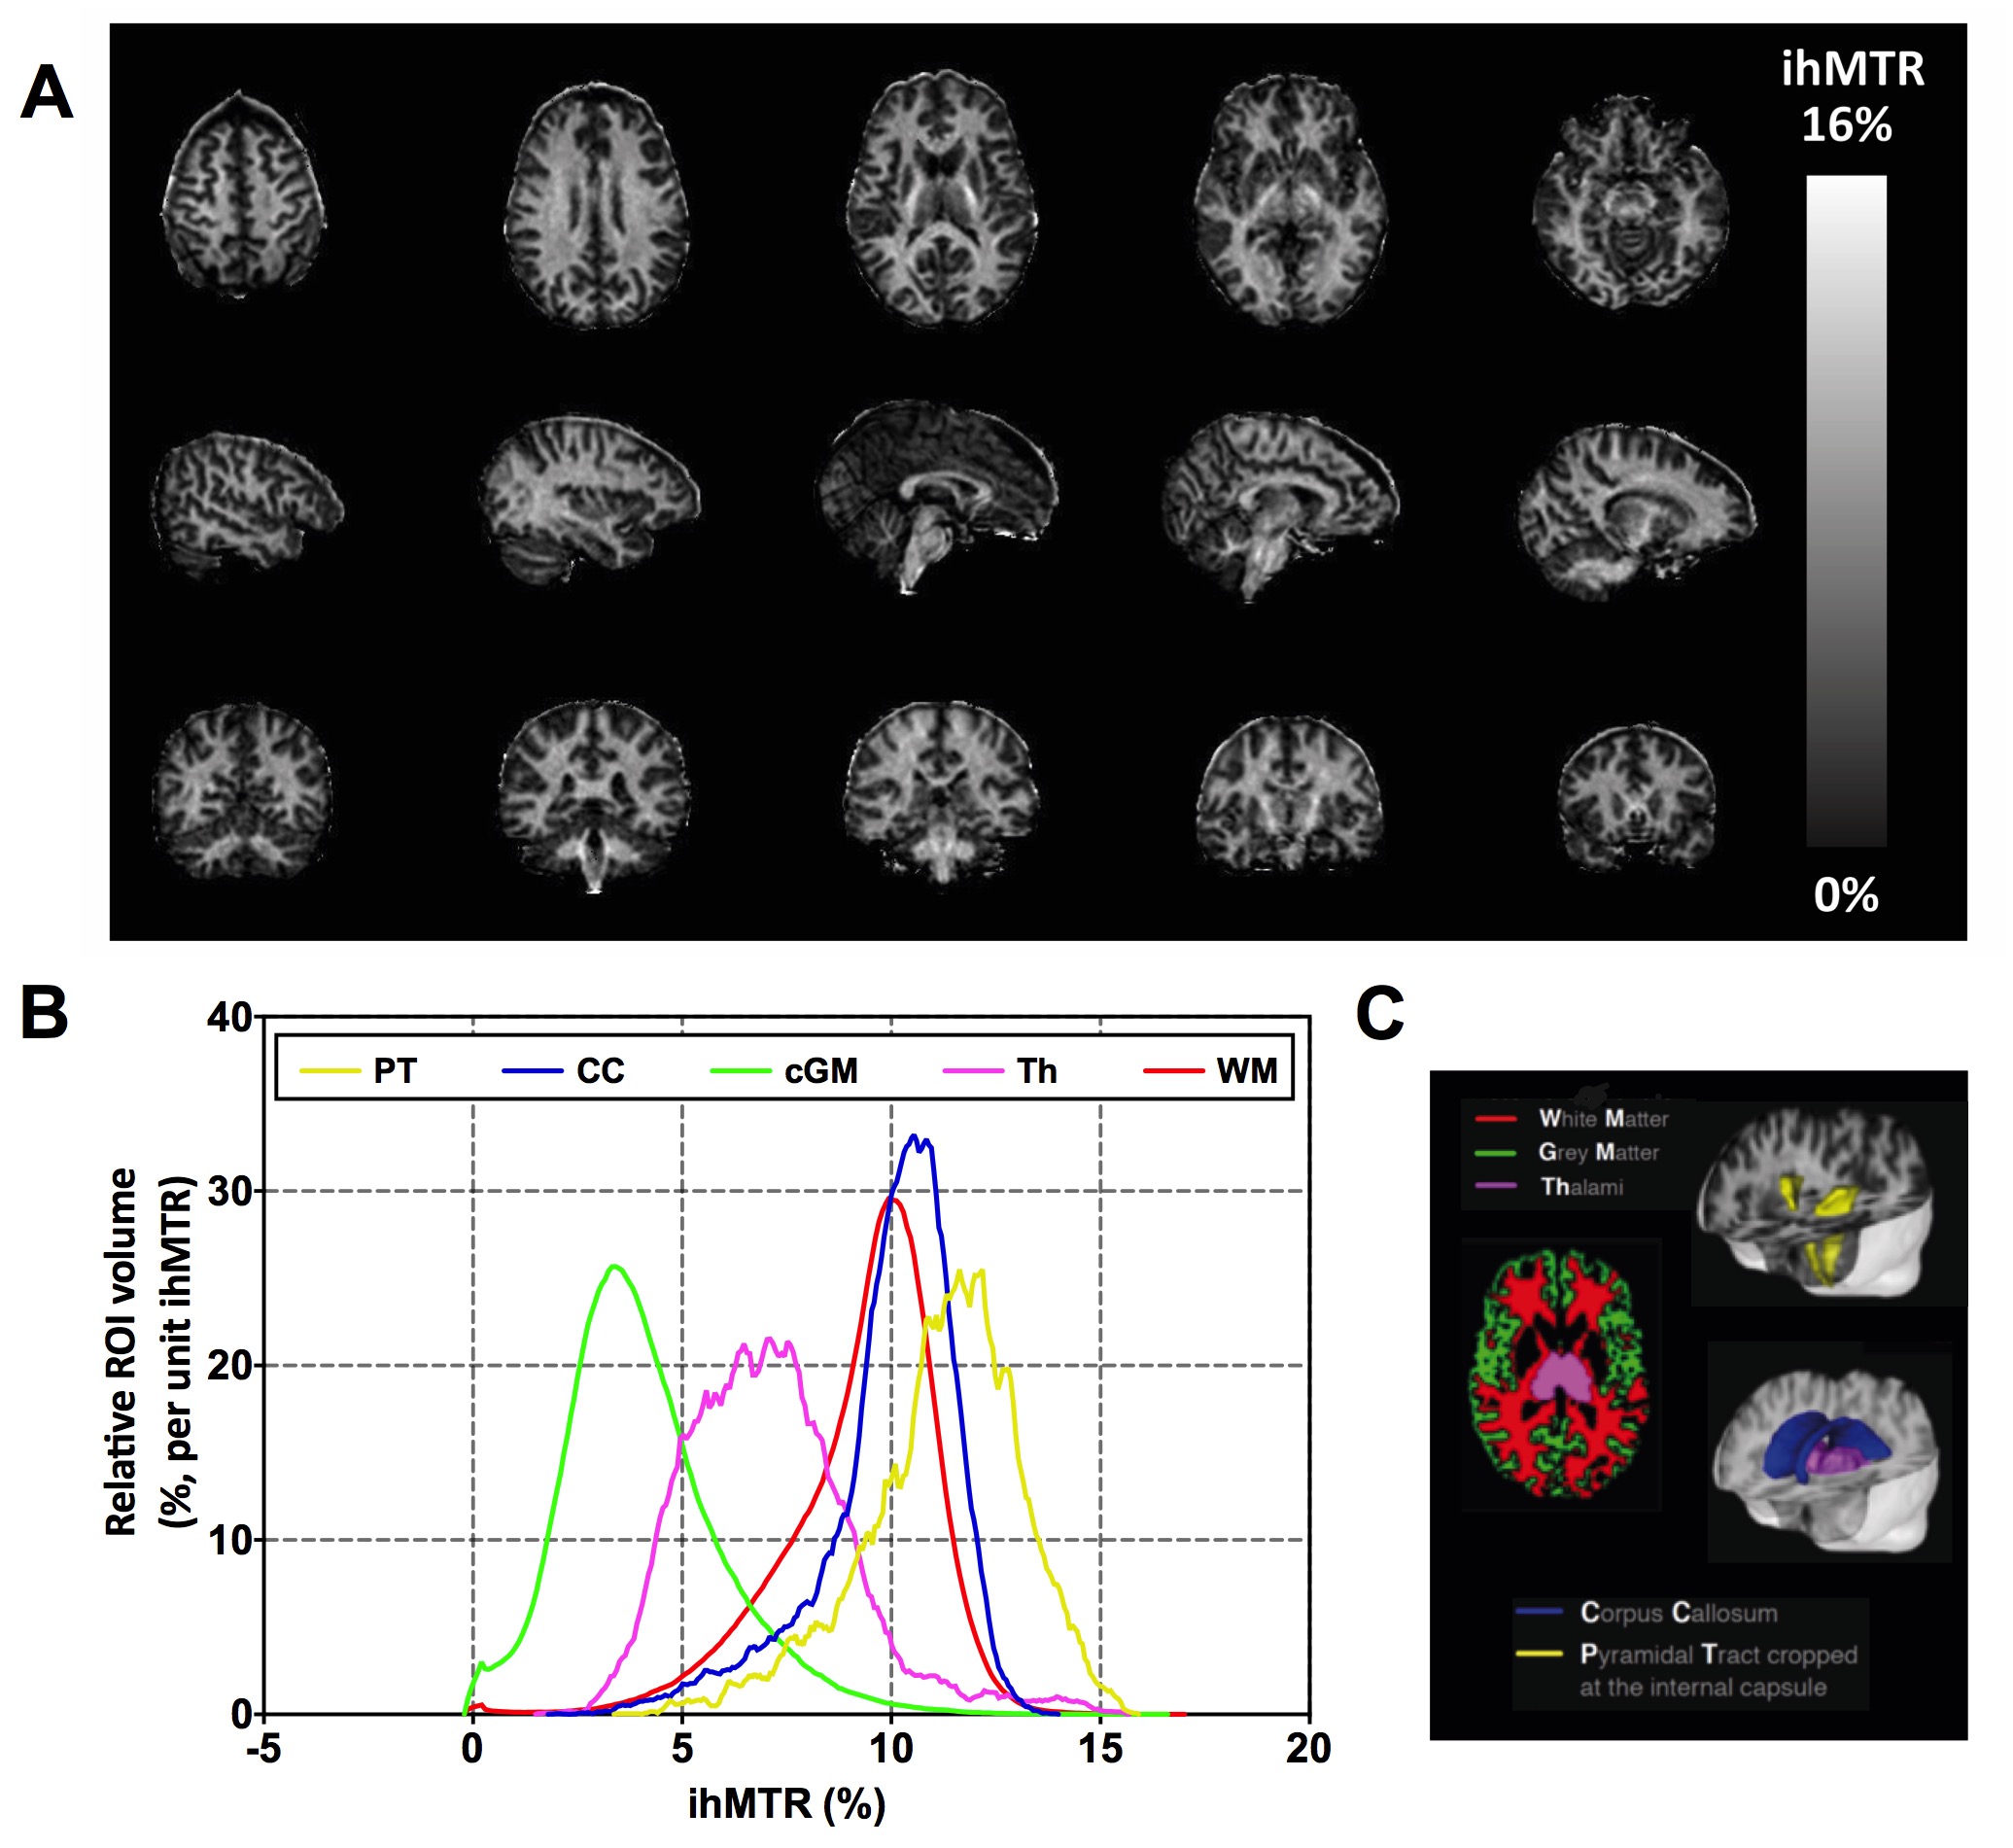
Fig.3A shows the ihMT signal averaged over the whole WM area as a function of TR for both reference voltage settings. Characteristic rising and falling curves are observed, analogous to previous findings at 1.5T describing the so-called ihMT boost effect (7). From these two curves, which tend to merge at long TRs, it appears that the sensitivity to B1 variations decrease with power concentration (i.e. with TR increase), as expected from the B1 dependence regimes characterized at 1.5T (7). The relative ihMT signal variation, associated with a 20% B1 drop, linearly decreases from 31.3% at TR = 24ms to only 10.1% at TR = 265ms (Fig.3B). In Fig.4 the sensitivity of ihMT with B1 was estimated using the high-resolution protocol from the smoothed pixel-wise ihMT vs. B1 representation of WM data. These data reveal a typical ± 20% B1 variation over the whole brain WM. A reduced correlation with B1 could be extrapolated for the most concentrated configuration (i.e. TR=265ms), in agreement with previous experiments (Fig. 3b). Of interest the data seem to diverge from a simple linear correlation model, perhaps due to the ihMT signal heterogeneity within WM. Extrapolating a reliable quantitative index of ihMT signal variation with B1 from such pixel-wise data remains to be explored. Finally, the high-resolution protocol is demonstrated in Fig.5, showing a good sensitivity for WM and exquisite contrast with Gray Matter (Fig.5A). The corresponding quantitative evaluation measured on several reference brain structures is reported in Fig 5B.
Conclusion
Instead of optimizing ihMT for maximum signal intensity, as was done previously at 1.5T (7), high field systems require to compromise between signal intensity and sensitivity to RF inhomogeneities. By concentrating the energy deposition, it is possible to mitigate the sensitivity of ihMT to the latter, while benefiting from an enhanced signal as compared to the most distributed short TR variant. Overall, by benefiting from these improvements, 1.5mm3 resolution ihMTR maps can be acquired at 3T within less than 15min, with a reduced B1 bias (on the order of ±10%) and strong signal within the whole brain, allowing robust clinical applications of ihMT at 3T.Acknowledgements
The authors would like to thank S. Confort-Gouny, V. Gimenez, L. Pini and P. Viout for MRI and volunteer management. This work was supported by the following funding sources: ARSEP Foundation (Research Grant 2017), ANR (Grant ANR-17-CE18-0030) and SATT Sud-Est. This work was performed by a laboratory member of France Life Imaging network (Grant ANR-11-INBS-0006).
References
- Varma G, Duhamel G, de Bazelaire C, at al. Magnetization Transfer from Inhomogeneously Broadened Lines: A Potential Marker for Myelin. Magn. Reson. Med. 2015;73:614–622. doi: 10.1002/mrm.25174.
- Girard OM, Prevost VH, Varma G, et al. Magnetization transfer from inhomogeneously broadened lines (ihMT): Experimental optimization of saturation parameters for human brain imaging at 1.5 Tesla. Magn. Reson. Med. 2015;73:2111–2121. doi: 10.1002/mrm.25330.
- Varma G, Girard OM, Prevost VH, et al. Interpretation of magnetization transfer from inhomogeneously broadened lines (ihMT) in tissues as a dipolar order effect within motion restricted molecules. J. Magn. Reson. 2015;260:67–76. doi: 10.1016/j.jmr.2015.08.024. 4.
- Varma G, Girard OM, Prevost VH, et al. In vivo measurement of a new source of contrast, the dipolar relaxation time, T1D, using a modified inhomogeneous magnetization transfer (ihMT) sequence. Magn. Reson. Med. 2016:n/a-n/a. doi: 10.1002/mrm.26523.
- Prevost VH, Girard OM, Mchinda S, et al. Optimization of inhomogeneous magnetization transfer (ihMT) MRI contrast for preclinical studies using dipolar relaxation time (T1D) filtering. NMR Biomed 2017. doi: 10.1002/nbm.3706.
- Prevost VH, Girard OM, Cayre M, et al. Validation of inhomogeneous Magnetization Transfer (ihMT) as a myelin biomarker. In: Proceedings of the ISMRM. Honolulu, HI, USA; 2017, #4549.
- Mchinda S, Varma G, Prevost VH, et al. Whole brain inhomogeneous magnetization transfer (ihMT) imaging: Sensitivity enhancement within a steady-state gradient echo sequence. Magn. Reson. Med. 2017. doi: 10.1002/mrm.26907.
Figures

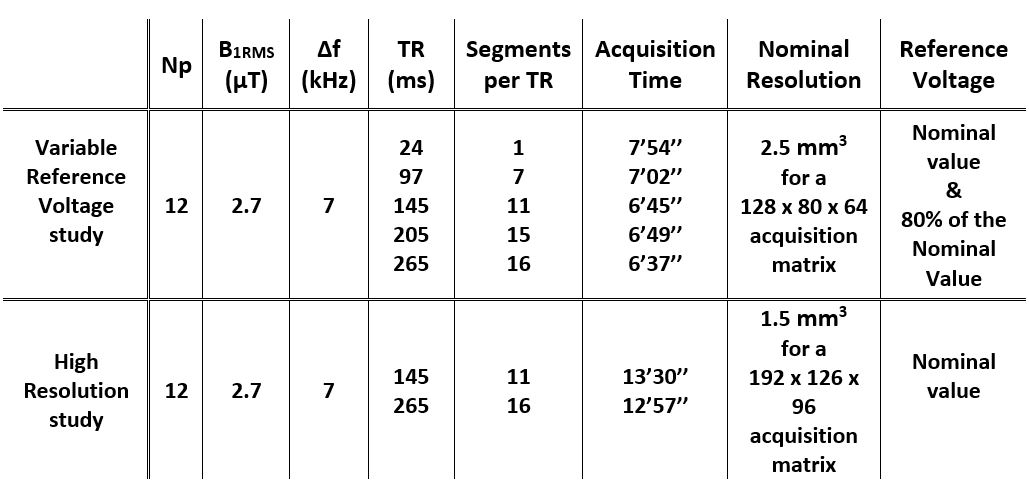
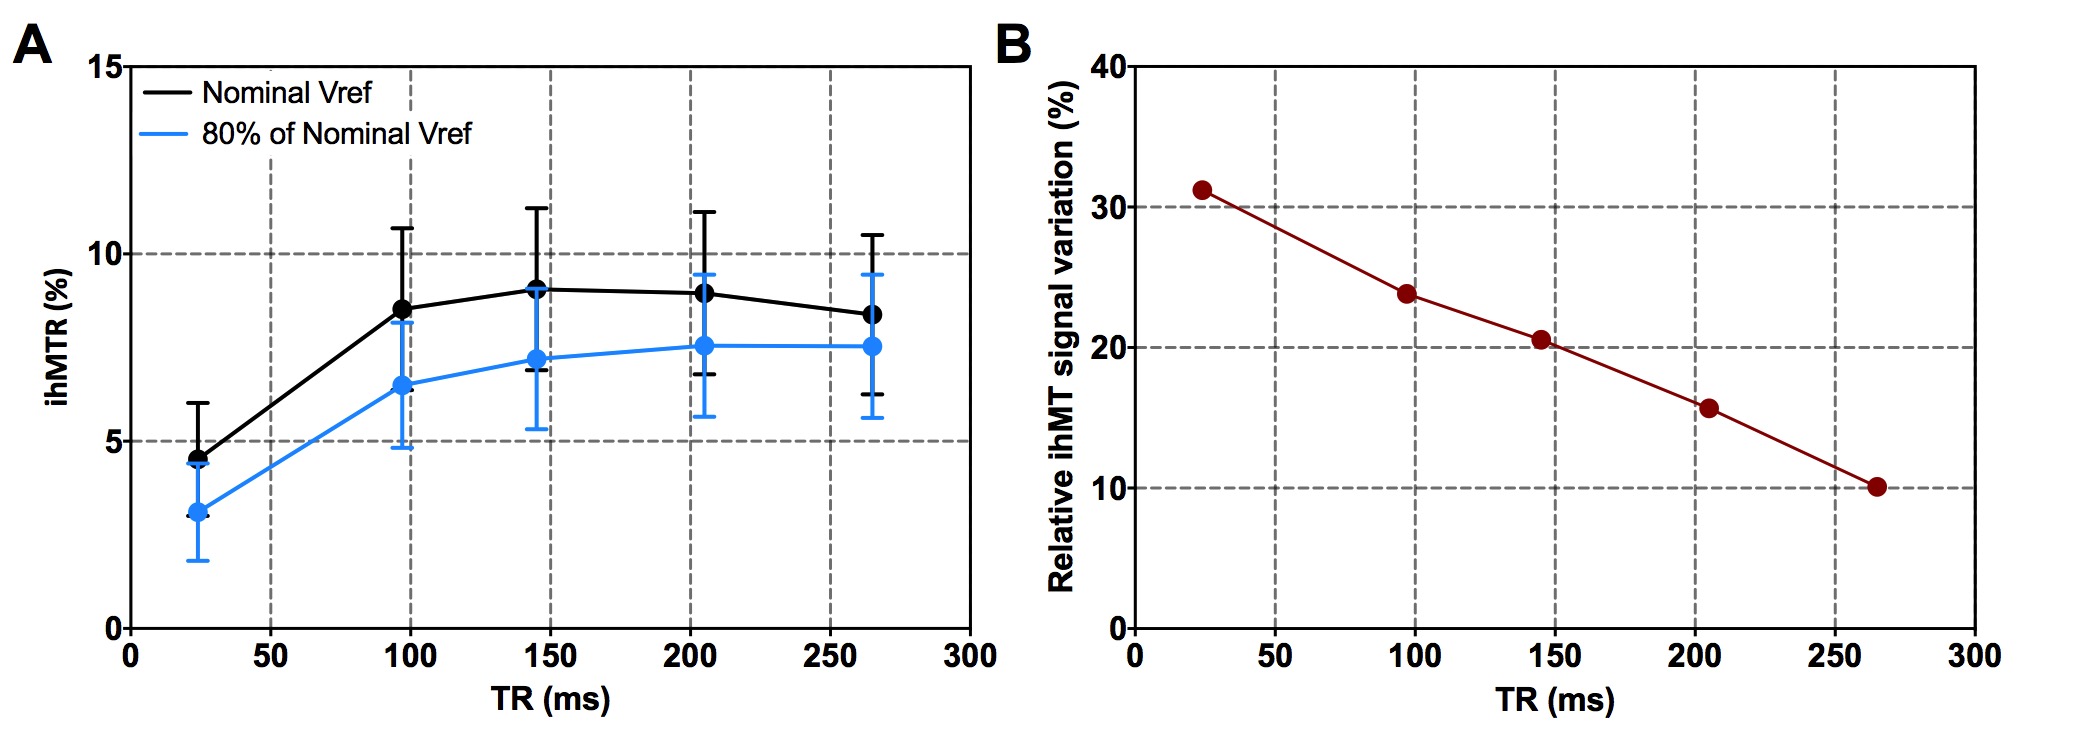
Fig.3: Assessment of the B1 sensitivity of ihMT-GRE as a function of TR. A) Experimental data of the TR dependency of ihMT-GRE measured for two reference voltage values. Data corresponds to the average signal ± standard deviation calculated over the whole White Matter mask derived from the MPRAGE-based automatic segmentation. B) corresponding fractional signal variations associated with the 20% drop in B1 intensity. The sensitivity of ihMT with B1 decreases linearly with TR, revealing the benefit of concentrating RF power for high field applications.