0785
A Sequence for High Quality Gradient Echo Myelin Water Imaging (GRE-MWI) at 3T and 7T1Electrical Engineering and Computer Science, Seoul National University, Seoul, Republic of Korea, 2Biomedical Engineering, Hankuk University of Foreign Studies, Seoul, Republic of Korea, 3Division of Cerebral Integration, National Institute for Physiological Sciences, Okazaki, Japan, 4Department of Radiology, Seoul St.Mary's Hospital, The Catholic University of Korea, Seoul, Republic of Korea
Synopsis
In this study, we propose an eddy current compensated 2D GRE-MWI sequence and demonstrate that the sequence is robust to physiological noises. The resulting myelin water fraction maps at 3T and 7T shows high quality images at high resolution (2 × 2 × 2 mm3 at 3T and 1.5 × 1.5 × 2 mm3 at 7T).
Introduction
Recently, myelin water imaging using a GRE sequence (GRE-MWI) has been proposed as an efficient method to acquire myelin contrast 1, 2. The method, however, has shown high sensitivity to error sources such as eddy current and physiological noises 3, 4. In this work, we propose a new sequence that is robust to these errors. A comparison between 2D vs 3D GRE-MWI was performed to demonstrate the characteristics of physiological noises and their error-compensated results. The new method was applied at 3T and 7T, revealing high quality myelin water images.Methods
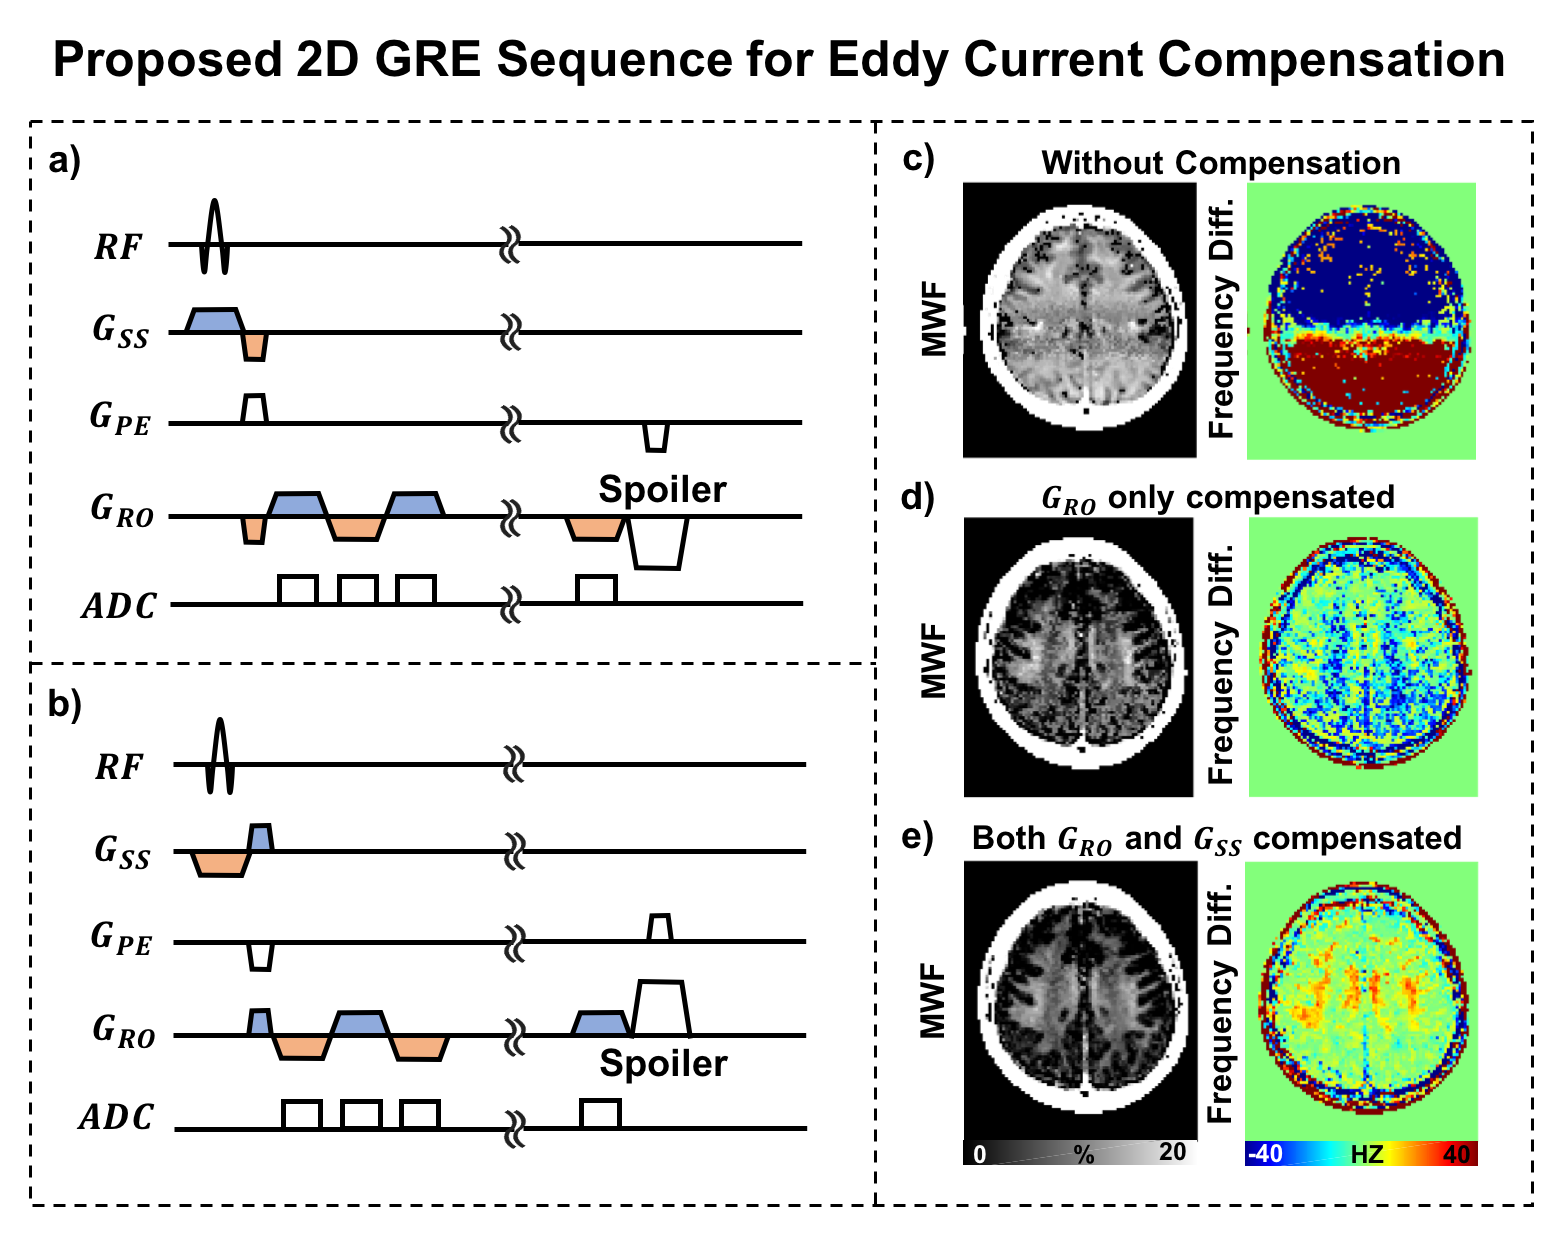
Eddy Current Compensation
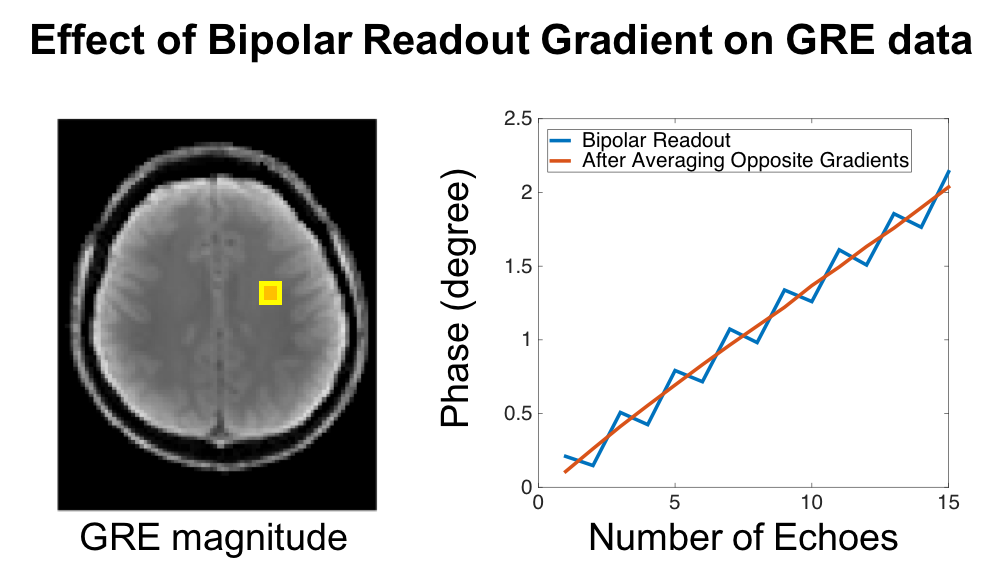
To capture fast decaying myelin water signal, a rapid multi-echo scan with a short echo space is necessary. Therefore, bipolar readout is preferred to monopolar readout (e.g. first four TEs are 2.4, 4.6, 6.8, and 9.0 ms in bipolar and 2.4, 5.2, 7.9, and 10.7 ms in monopolar). However, the bipolar readout induces significant differences between odd and even echoes due to eddy currents (Fig. 1) 5. In addition to the readout gradients, the slice-selective gradient is another source of eddy current. These eddy currents are a main source of artifacts in GRE-MWI and can be effectively removed by averaging two datasets with the opposite gradient polarity as shown in Fig. 2a and b 5.
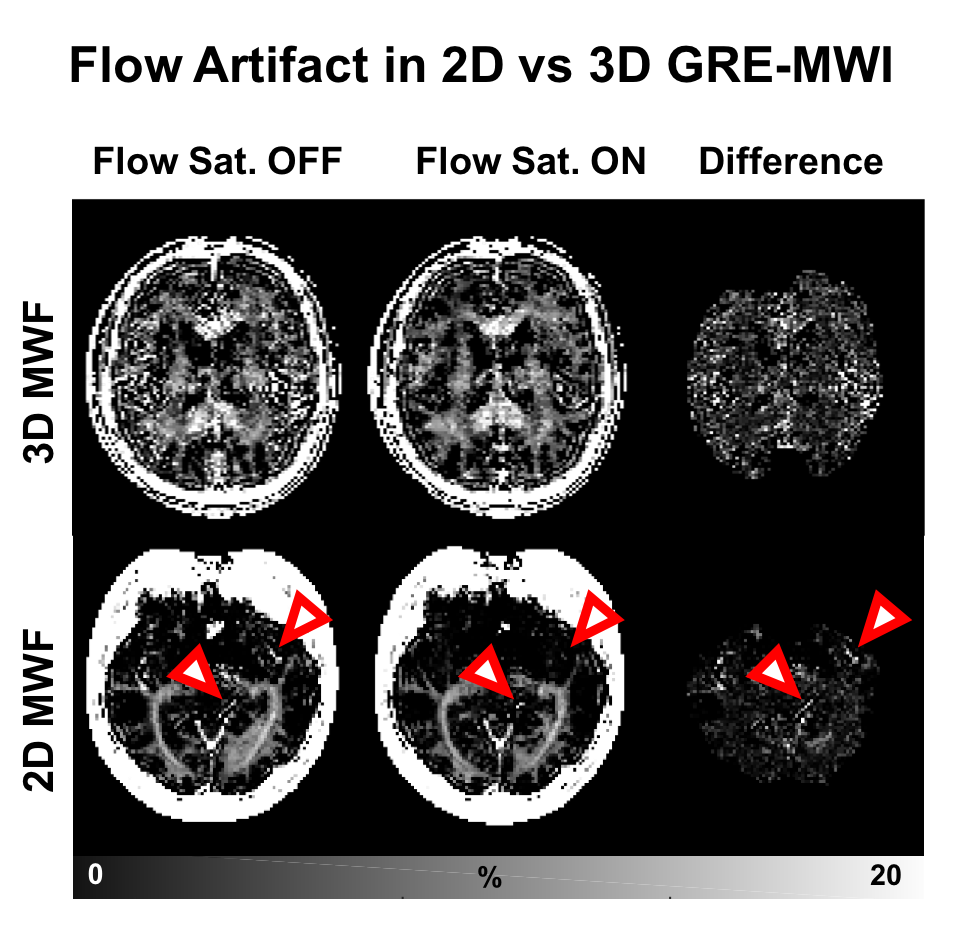
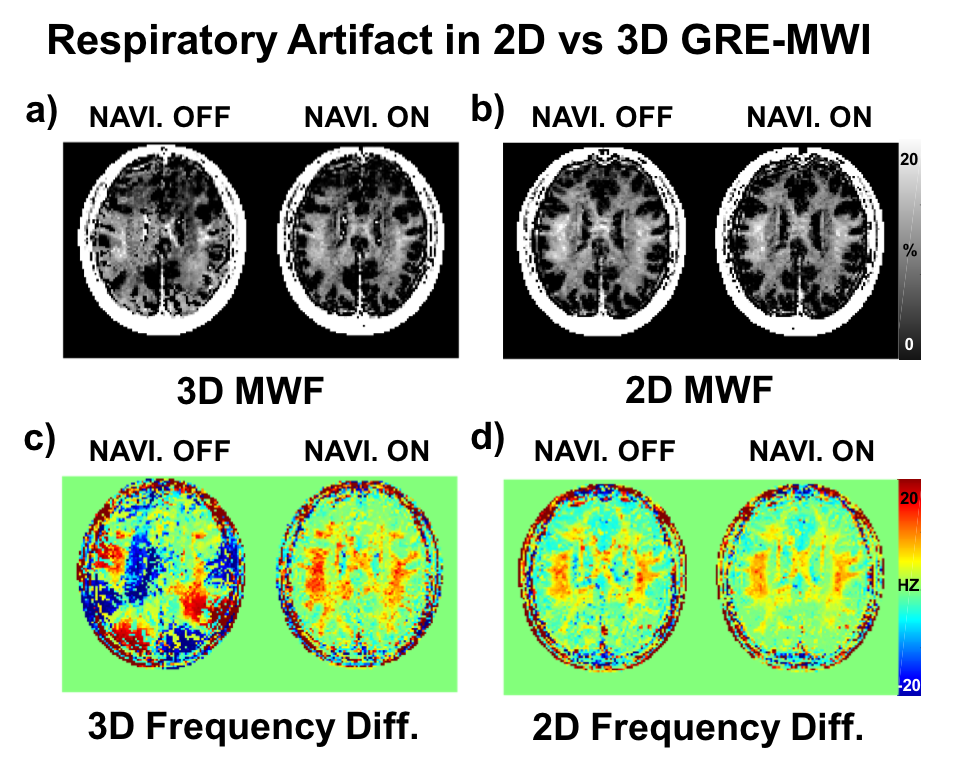
Effects of Physiological Noise in 2D and 3D GRE-MWI
In general, 3D GRE has higher SNR than 2D 6. However, physiological noises induce the opposite result as demonstrated in fMRI 6. In GRE-MWI, physiological noises play an important role 1, 3 and, therefore, 2D acquisition may provide more reliable results. To demonstrate this, 2D and 3D GRE data sets were acquired before and after applying physiological noise compensation (B0 navigator for respiration noise and flow saturation RF for inflow signal) 3.
Data Acquisition
[3T GRE Data] To test the effects of the eddy current and the physiological noises, we acquired six 2D multi-echo GRE datasets with three different corrections: (1) with or without eddy current compensation, (2) with or without B0 navigator, and (3) with or without flow saturation RF pulses. Common parameters were as follows: resolution = 2×2 mm2, slice thickness = 2 mm, TE = 2.4:2.2:33 ms, FOV = 208×256 mm2, and bandwidth = 500 Hz/pixel. To compare physiological noise characteristics between 2D and 3D, 3D datasets were acquired additionally. 3D GRE data for respiratory noise had the same parameters with 2D scans except TE (=2.1:2.2:34.8 ms). To demonstrate the effect of inflow, 3D GRE data from Nam et al 3, was utilized.
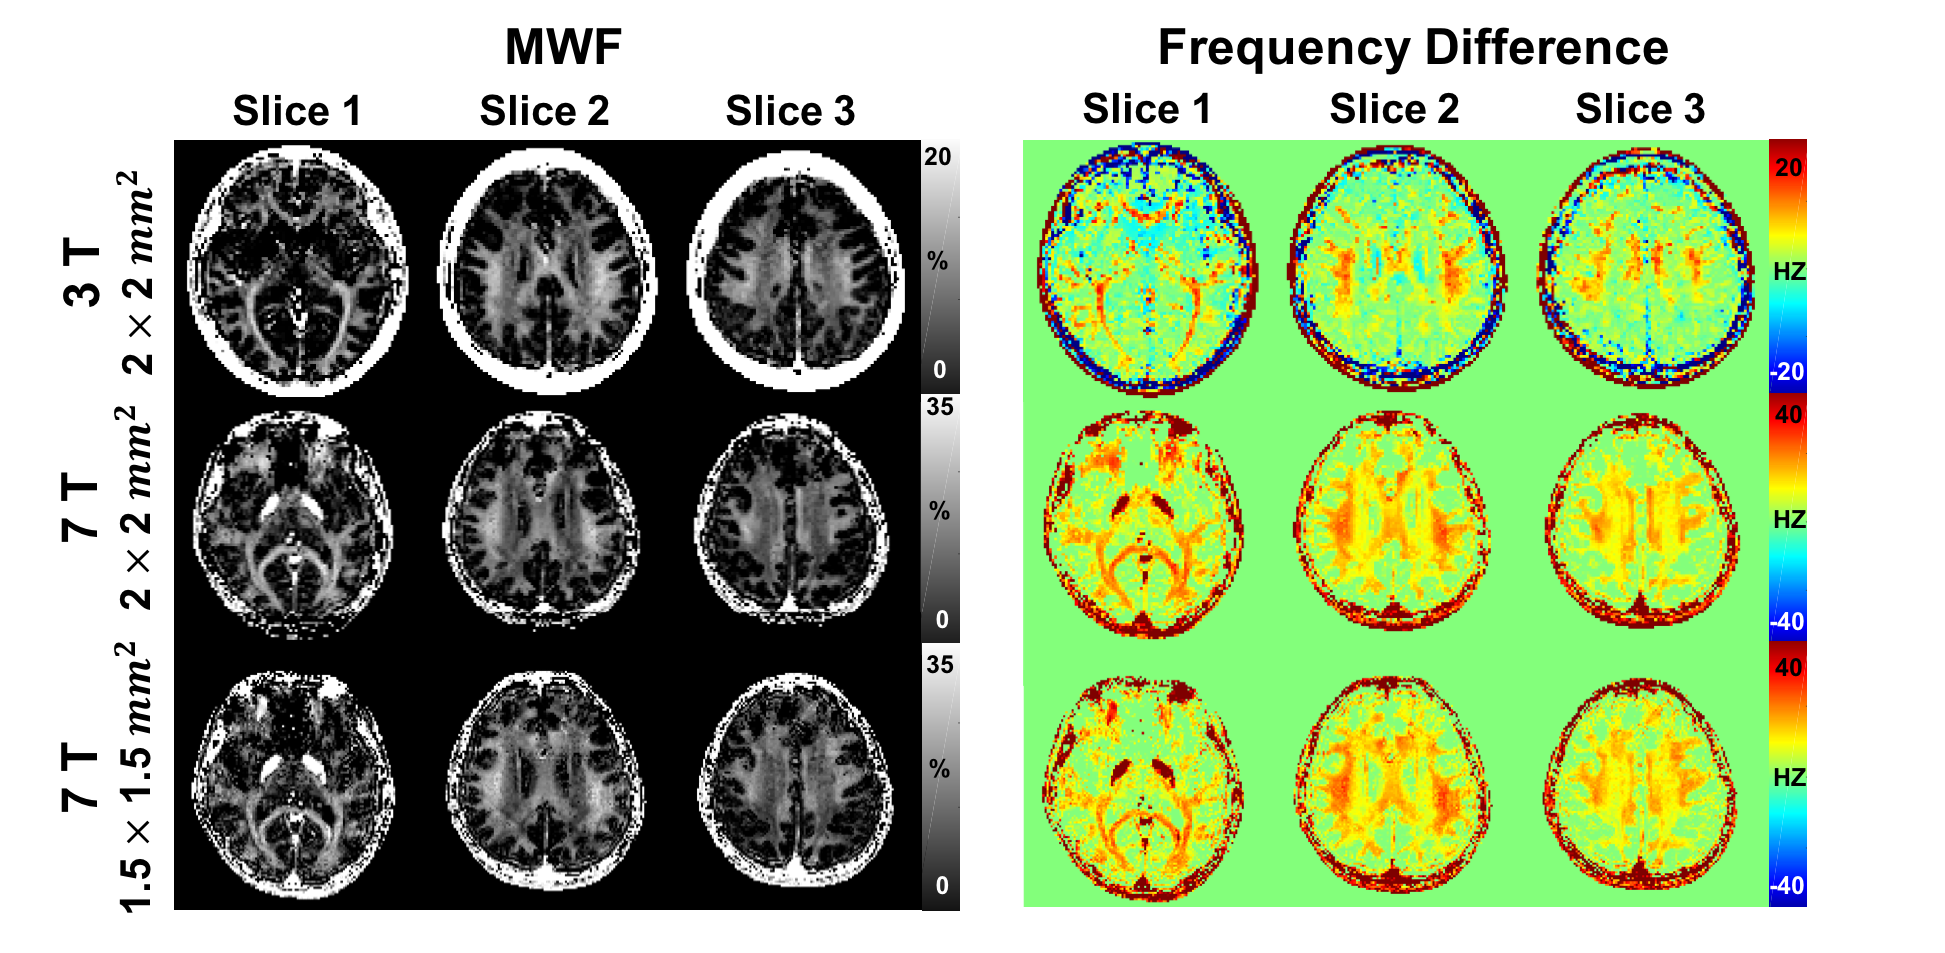
[7T GRE Data] For 7T, two different resolutions, 1.5x1.5 mm2 and 2x2 mm2, were acquired (TE=2.6:2.2:39 ms, FOV=256×256 mm2, others the same as 3). Eddy current effect from the slice-selective direction was compensated in post-processing.
[GRE-MWI Fitting] For 3T, the three pool complex model was applied to estimate myelin water fraction as described in 2. For 7T, the same procedure was applied using the initial values in 7.
Results
When GRE-MWI is generated from bipolar readout data, it shows substantially degraded MWI images (Fig. 2c). This degradation is corrected by averaging the two opposite gradient polarity data as proposed in our sequence (Fig. 1 red line; Fig. 2d and e). Compensation of the eddy current effects from both slice selection and readout gradients is necessary to achieve high quality MWI images (Fig. 2d and e).
When physiological noises are compared between 2D and 3D acquisitions, 2D MWI results show strong robustness to the noises (Fig. 3 and 4). The compensation methods, which are required in 3D MWI, have minimal effects in 2D MWI.
Figure 5 shows the results of 3T and 7T MWI using the eddy current compensated 2D sequence. All results show high quality images (no physiological noise compensation applied). The image quality of 7T MWI is superior to that of 3T but 7T results have higher MWF.
Conclusion and Discussion
In this study, we developed the eddy current compensated 2D GRE sequence that was robust to physiological noises. The results from 3T and 7T showed high quality MWF maps. By removing physiological noise compensation, more slices (121%) were acquired. Reversing slice selective gradient may excite slightly shifted slice in large field inhomogeneity regions. This problem can be mitigated by using a large bandwidth RF. When comparing 3T and 7T MWFs, 7T results had higher values than those of 3T for an unclear reason. A similar tendency was observed when comparing 1.5T and 3T results using conventional spin-echo MWI 4.Acknowledgements
This research was supported by Basic Science Research Program through the National Research Foundation of Korea(NRF) funded by the Ministry of Education(NRF-2015R1D1A1A01058360)References
[1] Du, Y. P., Chu, R., Hwang, D., Brown, M. S., Kleinschmidt DeMasters, B. K., Singel, D., & Simon, J. H. (2007). Fast multislice mapping of the myelin water fraction using multicompartment analysis of T2* decay at 3T: a preliminary postmortem study. Magnetic Resonance in Medicine, 58(5), 865–870. http://doi.org/10.1002/mrm.21409
[2] Nam, Y., Lee, J., Hwang, D., & Kim, D. H. (2015). Improved estimation of myelin water fraction using complex model fitting. NeuroImage, 116, 214–221. http://doi.org/10.1016/j.neuroimage.2015.03.081
[3] Nam, Y., Kim, D. H., & Lee, J. (2015). Physiological noise compensation in gradient-echo myelin water imaging. NeuroImage, 120, 345–349. http://doi.org/10.1016/j.neuroimage.2015.07.014
[4] Kolind, S. H., Mädler, B., Fischer, S., Li, D. K. B., & MacKay, A. L. (2009). Myelin water imaging: Implementation and development at 3.0T and comparison to 1.5T measurements. Magnetic Resonance in Medicine, 62(1), 106–115. http://doi.org/10.1002/mrm.21966
[5] Yu, H., Shimakawa, A., McKenzie, C. A., Lu, W., Reeder, S. B., Hinks, R. S., & Brittain, J. H. (2010). Phase and amplitude correction for multi-echo water-fat separation with bipolar acquisitions. Journal of Magnetic Resonance Imaging, 31(5), 1264–1271. http://doi.org/10.1002/jmri.22111
[6] Tijssen, R. H. N., Okell, T. W., & Miller, K. L. (2011). Real-time cardiac synchronization with fixed volume frame rate for reducing physiological instabilities in 3D FMRI. NeuroImage, 57(4), 1364–1375. http://doi.org/10.1016/j.neuroimage.2011.05.070
[7] Sati, P., van Gelderen, P., Silva, A. C., Reich, D. S., Merkle, H., de Zwart, J. A., & Duyn, J. H. (2013). Micro-compartment specific T2⁎ relaxation in the brain. NeuroImage, 77, 268–278. http://doi.org/10.1016/j.neuroimage.2013.03.005
Figures