0784
Comparison of Inhomogeneous Magnetization Transfer and Myelin Water Fraction Ex-Vivo at 7T1Physics and Astronomy, University of British Columbia, Vancouver, BC, Canada, 2UBC MRI Research Centre, University of British Columbia, Vancouver, BC, Canada, 3International Collaboration on Repair Discoveries, Vancouver, BC, Canada, 4Pathology & Laboratory Medicine, University of British Columbia, Vancouver, BC, Canada, 5Radiology, University of British Columbia, Vancouver, BC, Canada, 6Medicine, Division of Neurology, University of British Columbia, Vancouver, BC, Canada, 7Physics and Astronomy, McMaster University, Hamilton, ON, Canada, 8MR Clinical Science, Phillips Healthcare Canada, Markham, ON, Canada, 9ImageTech Lab, Faculty of Applied Sciences, Simon Fraser University, Surrey, BC, Canada
Synopsis
Inhomogeneous magnetization transfer (ihMT) shows promise as a
Introduction
Inhomogeneous magnetization transfer (ihMT) has become a method of interest for brain imaging because it shows potential for sensitivity to myelin1, 2. ihMT differs from conventional MT methods by taking the difference between images acquired with single-sided and dual-sided off-resonance prepulses1-5. The ihMT signal is thought to arise from long-lived dipolar order within lipid alkyl chains1,3,6. However, it has been shown that ihMT can arise in other molecules with dipolar coupling, which suggests that the contrast may not be myelin-specific3. Myelin water imaging (MWI) is a method recognized for being representative of myelin content7,8 although water exchange processes could cause MWI to underestimate myelin content9. Our work assesses ihMT, MT, and MWI to examine how the different myelin content quantification techniques compare in post-mortem human brain tissue.Methods
MR experiments were conducted on a 7T Bruker Avance system (Bruker Biospin, Ettlingen, Germany) with a quadrature volume coil (inner diameter = 7cm).
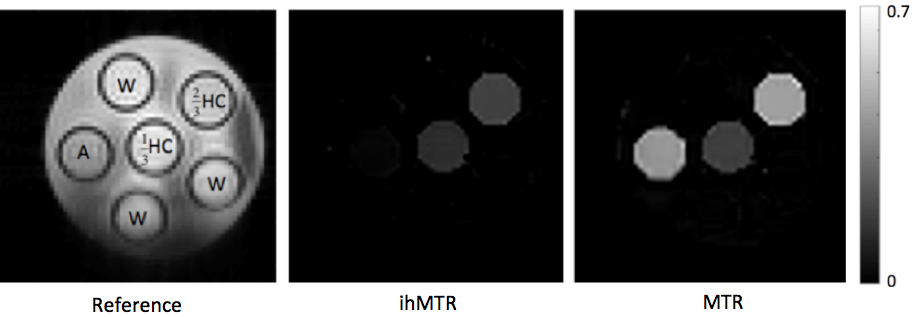
Sequence optimization: The ihMT sequence was first tested on a phantom containing deionized water, agar, and hair conditioner (which imitates the lamellar structure of myelin1,3). Two different hair conditioner concentrations were used (hair conditioner:water at 1:3 and 2:3) (Figure 1). To aid in optimizing ihMT saturation parameters to maximize white matter/grey matter (WM/GM) contrast, we ran 12 experiments varying the prepulse parameters (frequency offset (Δf), total saturation time (τ), TR, B1,rms, pulse width (PW)) and performed simulations using the modelling approach described previously8.
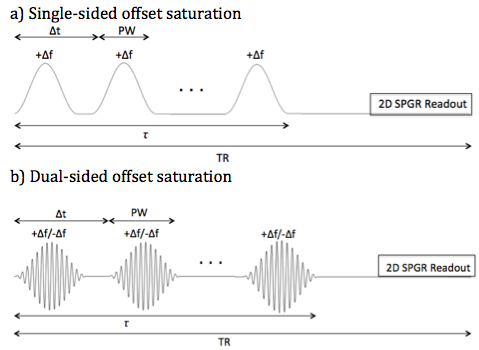
Brain tissue experiments: We employed a 2D sequence consisting of an ihMT prepulse combined with FLASH (Figure 2) on formalin-fixed brain samples from a multiple sclerosis patient and a normal control. Four sets of data were collected (single negative offset saturation (MT-), single positive offset saturation (MT+), dual offset saturation (MT+/-) and MT reference scan without saturation (MT0)). Brain scan parameters for ihMT and MT included Δf = 14kHz, TR/TE = 207.62/2.57ms, B1,rms = 17μT, FOV = 4x4cm2, matrix = 128x128, 312.5μm in-plane resolution, slice thickness = 1mm, flip angle = 30°, τ = 50ms, interpulse delay time Δt = 3.3ms, and PW = 3ms. For the single and dual saturation sequences, 15 Hann-shaped prepulses and 15 cosine-modulated Hann-shaped prepulses were applied, respectively. MWI parameters included TR/TE = 1500/6.753ms, 64 echoes, echo spacing = TE, and identical FOV, matrix, in-plane resolution, and slice thickness as the ihMT and MT experiments.
Data analysis: Images were processed using a Non-Local Means algorithm10 to denoise the four acquired images, which were then used to calculate the ihMT ratio (ihMTR = (MT+ + MT- – 2*MT+/-)/(2*M0)) and the MT ratio (MTR = (2*M0 - MT+ - MT-)/(2*M0)). MWI data was analyzed using NNLS11 and myelin water fraction (MWF) was defined as the ratio signal with T2<25ms to the total signal. For the brain slices, regions of interest included the entire area of normal or normal appearing white matter and grey matter, and MS diffusely abnormal white matter.
Statistics: Pearson’s correlation examined the relationship between voxelwise ihMTR and MTR against MWF in all tissue (ie. all ROIs combined).
Results and Discussion
Phantom: Figure 1 compares the phantom reference, ihMTR, and MTR images. Both MTR and ihMTR showed no signal for water, and a reduction in signal with lower hair conditioner concentration. However, only MTR showed a nonzero signal for agar, demonstrating that MTR is less specific to lipids than ihMTR.
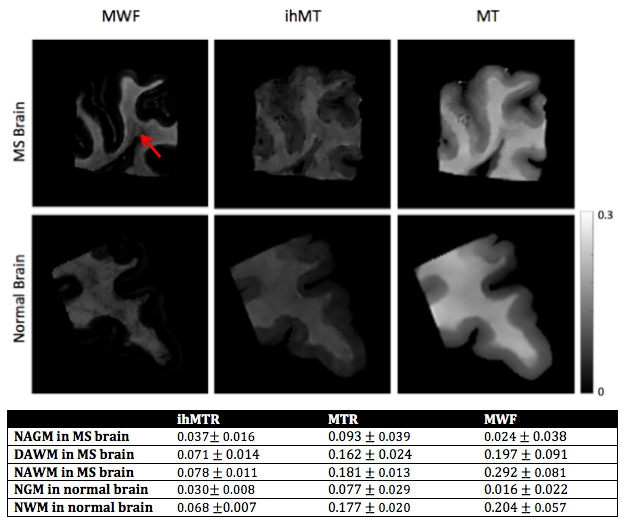
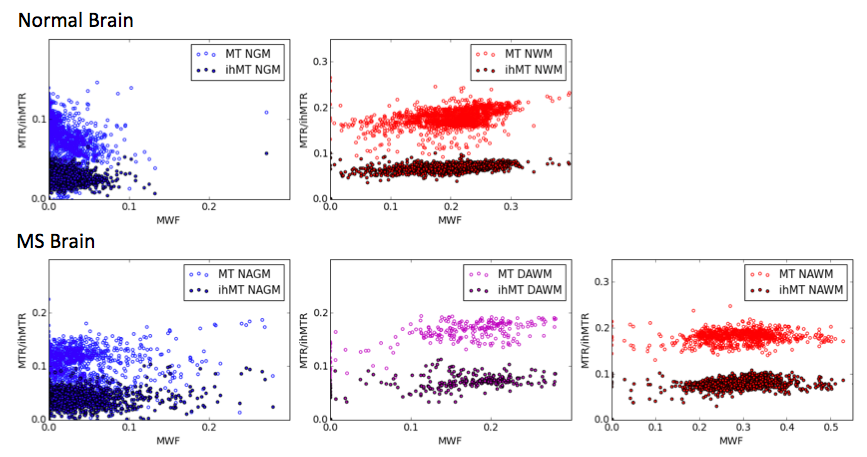
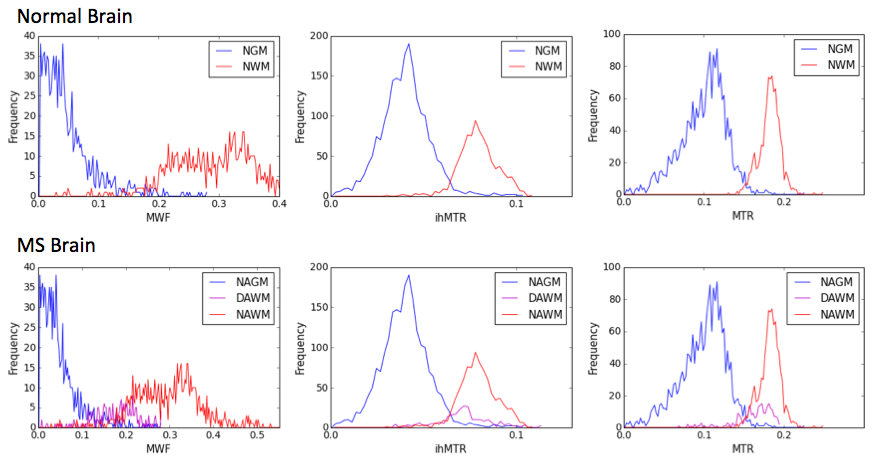
Brain tissue: Figure 3 shows MWF, ihMTR and MTR maps for normal and MS brain tissue, and mean values in NAGM, DAWM, NAWM, NGM, and NWM. Figure 4 demonstrates a pixel-by-pixel comparison of ihMTR, MTR, and MWF with correlation statistics taking into account all tissue; p<<0.005 for all cases, most likely skewed from the large sample size. MTR was always greater than ihMTR, which is consistent with the understanding that MT is also sensitive to molecules with short-lived dipolar couplings such as proteins. When MWF was zero, the ihMTR signal was nonzero, suggesting that ihMT is not specifically detecting myelin lipids but other molecules as well (ie. other membrane lipids) with proton-proton dipolar coupling3. NAWM and NWM ihMTR have a narrower dynamic range than MWF, making it easier to differentiate WM from GM, but MWF’s wider dynamic range may give more information about subtle differences or changes in myelin content (Figure 5). Alternatively, it is possible that MWI underestimates myelin content due to exchange. Histological comparison studies are warranted to address these questions.
Conclusion
This study compares different myelin imaging techniques. Our findings suggest that the WM/GM contrast seen from ihMT (and MT) is based on different tissue properties than that obtained by MWI.Acknowledgements
M. H. L. was supported by an NSERC Undergraduate Student Research Award. CL and GRWM hold operating grants from the MS Society of Canada. This study was supported by an NSERC Discovery grant (PK). Thank you to donors and families for tissue donations.References
1. Varma G., Alsop D.C., Duhamel G., et al. Magnetization Transfer from Inhomogeneously Broadened Lines: A Potential Marker for Myelin. Magn. Reson. Med. 2015; 73: 614–622.
2. Girard O.M., Prevost V.H., Varma G., et al. Magnetization transfer from inhomogeneously broadened lines (ihMT): Experimental optimization of saturation parameters for human brain imaging at 1.5 Tesla. Magn. Reson. Med. 2015; 73: 2111–2121.
3. Manning A.P., Chang K.L., Michal C.A., et al. The physical mechanism of ‘‘inhomogeneous” magnetization transfer MRI. J. Magn. Reson. 2017; 274: 125-136.
4. Prevost V. H., Girard O. M., Mchinda S., et al. Optimization of inhomogeneous magnetization transfer (ihMT) MRI contrast for preclinical studies using dipolar relaxation time (T1D) filtering. NMR Biomed. 2017; 30(6): e3706.
5. Varma G., Grant A. K., Alsop D.C., et al. In Vivo Measurement of a New Source of Contrast, the Dipolar Relaxation Time, T1D, Using a Modified Inhomogeneous Magnetization Transfer (ihMT) Sequence. Magn. Reson. Med. 2016; 78: 1362–1372.
6. Varma G., Girard O., Prevost V., Grant A., Duhamel G., Alsop D., Interpretation of magnetization transfer from inhomogeneously broadened lines (ihMT) in tissues as a dipolar order effect within motion restricted molecules, J. Magn. Reson. 2015; 260: 67–76. http://dx.doi.org/10.1016/j.jmr.2015.08.024
7. Laule C., Kozlowski P., Li D. K. B., et al. Myelin water imaging of multiple sclerosis at 7 T: Correlations with histopathology. NeuroImage. 2008; 40(4): 1575-1580.
8. Mackay A. and Laule C. Magnetic Resonance of Myelin Water: An in vivo Marker for Myelin. Brain Plasticity. 2016; 2(1): 71-91.
9. Dula AN, Gochberg DF, Valentine HL, Valentine WM, Does MD. Multi-exponential T2, Magnetization Transfer and Quantitative Histology in White Matter Tracts of Rat Spinal Cord. Magn. Reson. Med. 2010; 63: 902-909.
10. Coupé P, Yger P, Prima S, Hellier P, Kervrann C, Barillot C. An optimized blockwise nonlocal means denoising filter for 3-D magnetic resonance images. IEEE Transactions on Medical Imaging. 2008; 27(4): 425-441. doi:10.1109/TMI.2007.906087.
11. Whittal K.P., Mackay A.L. Quantitative interpretation of NMR relaxation data. J. Magn. Reson. 1989; 84: 134-152.
Figures