0783
Multidimensional T1 Relaxation-T2 Relaxation Correlation Spectroscopic Imaging (RR-CSI) for In Vivo Imaging of Microstructure1Electrical Engineering, University of Southern California, Los Angeles, CA, United States, 2Radiology, Children's Hospital Los Angeles, Los Angeles, CA, United States, 3Cardiology, Massachusetts General Hospital, Boston, MA, United States
Synopsis
We propose a new multidimensional MRI experiment called T1 Relaxation-T2 Relaxation Correlation Spectroscopic Imaging (RR-CSI) for probing microstructure. RR-CSI acquires imaging data with two-dimensional relaxation contrast encoding and estimates a high-dimensional spectroscopic image by using spatially-constrained reconstruction. The spectroscopic image comprises a full 2D T1-T2 spectrum at every voxel. The distinct peaks in these spectra correspond to different microscopic tissue compartments, which enables spatial mapping of microstructure. Compared to conventional methods, RR-CSI has improved capabilities for resolving tissue microenvironments with similar relaxation parameters. RR-CSI is demonstrated with real MRI data, including the first in vivo human brain results.
Introduction
Multicomponent relaxation imaging1-3 is a common approach to microstructure imaging, and is based on generating a 1D “spectrum” (or distribution) of MR relaxation parameters (T1, T2, or T2*) for each voxel of an MR image. This leads to a spectroscopic image comprising a 1D spectrum at every voxel. The different spectral peaks of this image are often interpreted as representing distinct microscopic sub-voxel compartments, which enables the generation of spatial maps of tissue microstructure. However, estimating the 1D spectrum involves multiexponential estimation, which is a highly ill-posed problem. Due to ill-posedness, conventional 1D approaches are unable to separate tissue compartments that have similar relaxation parameters.
We propose a new high-dimensional approach called T1 Relaxation-T2 Relaxation Correlation Spectroscopic Imaging (RR-CSI) that has better capabilities for resolving microscopic tissue compartments and enables improved spatial mapping of microstructure. Similar to previous 2D relaxation approaches4-8, RR-CSI uses 2D contrast encoding with both T1-relaxation and T2-relaxation instead of the 1D encoding used in more common approaches. This reduces the ill-posedness of the estimation problem. Distinct from previous approaches, RR-CSI uses spatially-constrained estimation of the high-dimensional spectroscopic image, which is important for further reducing ill-posedness and alleviating the sampling and data-quality requirements of conventional 2D relaxation approaches. In this work, we demonstrate RR-CSI with real data, including the first in vivo demonstration of this kind of high-dimensional contrast-based spectroscopic imaging.
Theory
RR-CSI is motivated by recent work called diffusion-relaxation correlation spectroscopic imaging (DR-CSI)9,10 that uses 2D diffusion-relaxation encoding with spatially-constrained estimation. Instead of diffusion-relaxation encoding, RR-CSI simultaneously encodes T1 and T2 with different combinations of multiple inversion times (TI) and echo times (TE), and then estimates a 2D T1-T2 relaxation correlation spectrum at every voxel. RR-CSI assumes a spatial-spectral multi-compartment signal model defined by: $$M(x,y,TI,TE)=\iint F(x,y,T_1,T_2)\left(1-2e^{-\frac{TI}{T_1}}\right)e^{-\frac{TE}{T_2}}dT_1dT_2,$$ where $$$M(x,y,TI,TE)$$$ is the measured data at position $$$(x,y)$$$, and $$$F(x,y,T_1,T_2)$$$ is the unknown 4D spectroscopic image. The spectroscopic image is estimated by solving a dictionary-based spatially-regularized nonnegative least squares optimization problem as in previous work9,10.
Methods
Pumpkin: Real RR-CSI data of a small pumpkin was acquired at 3T MRI (Philips, Best, The Netherlands) using an inversion recovery CPMG sequence with the following parameters: TR=5000ms, voxel size=3mmx3mm, and slice thickness=4mm. For contrast encoding, we used every combination of 7 TIs (0, 100, 200, 400, 700, 1000 and 2000ms) and 15 TEs (from TE=7.5ms to 217.5ms in 15ms increments) for a total of 105 contrasts.
In vivo human brain: We acquired in vivo human brain data using the same imaging parameters from the pumpkin experiment except for discarding all data with TE=7.5ms (a total of 98 contrasts). Two different slices were acquired. Acquisition time for a single slice was less than 20 minutes.
Results and Discussion
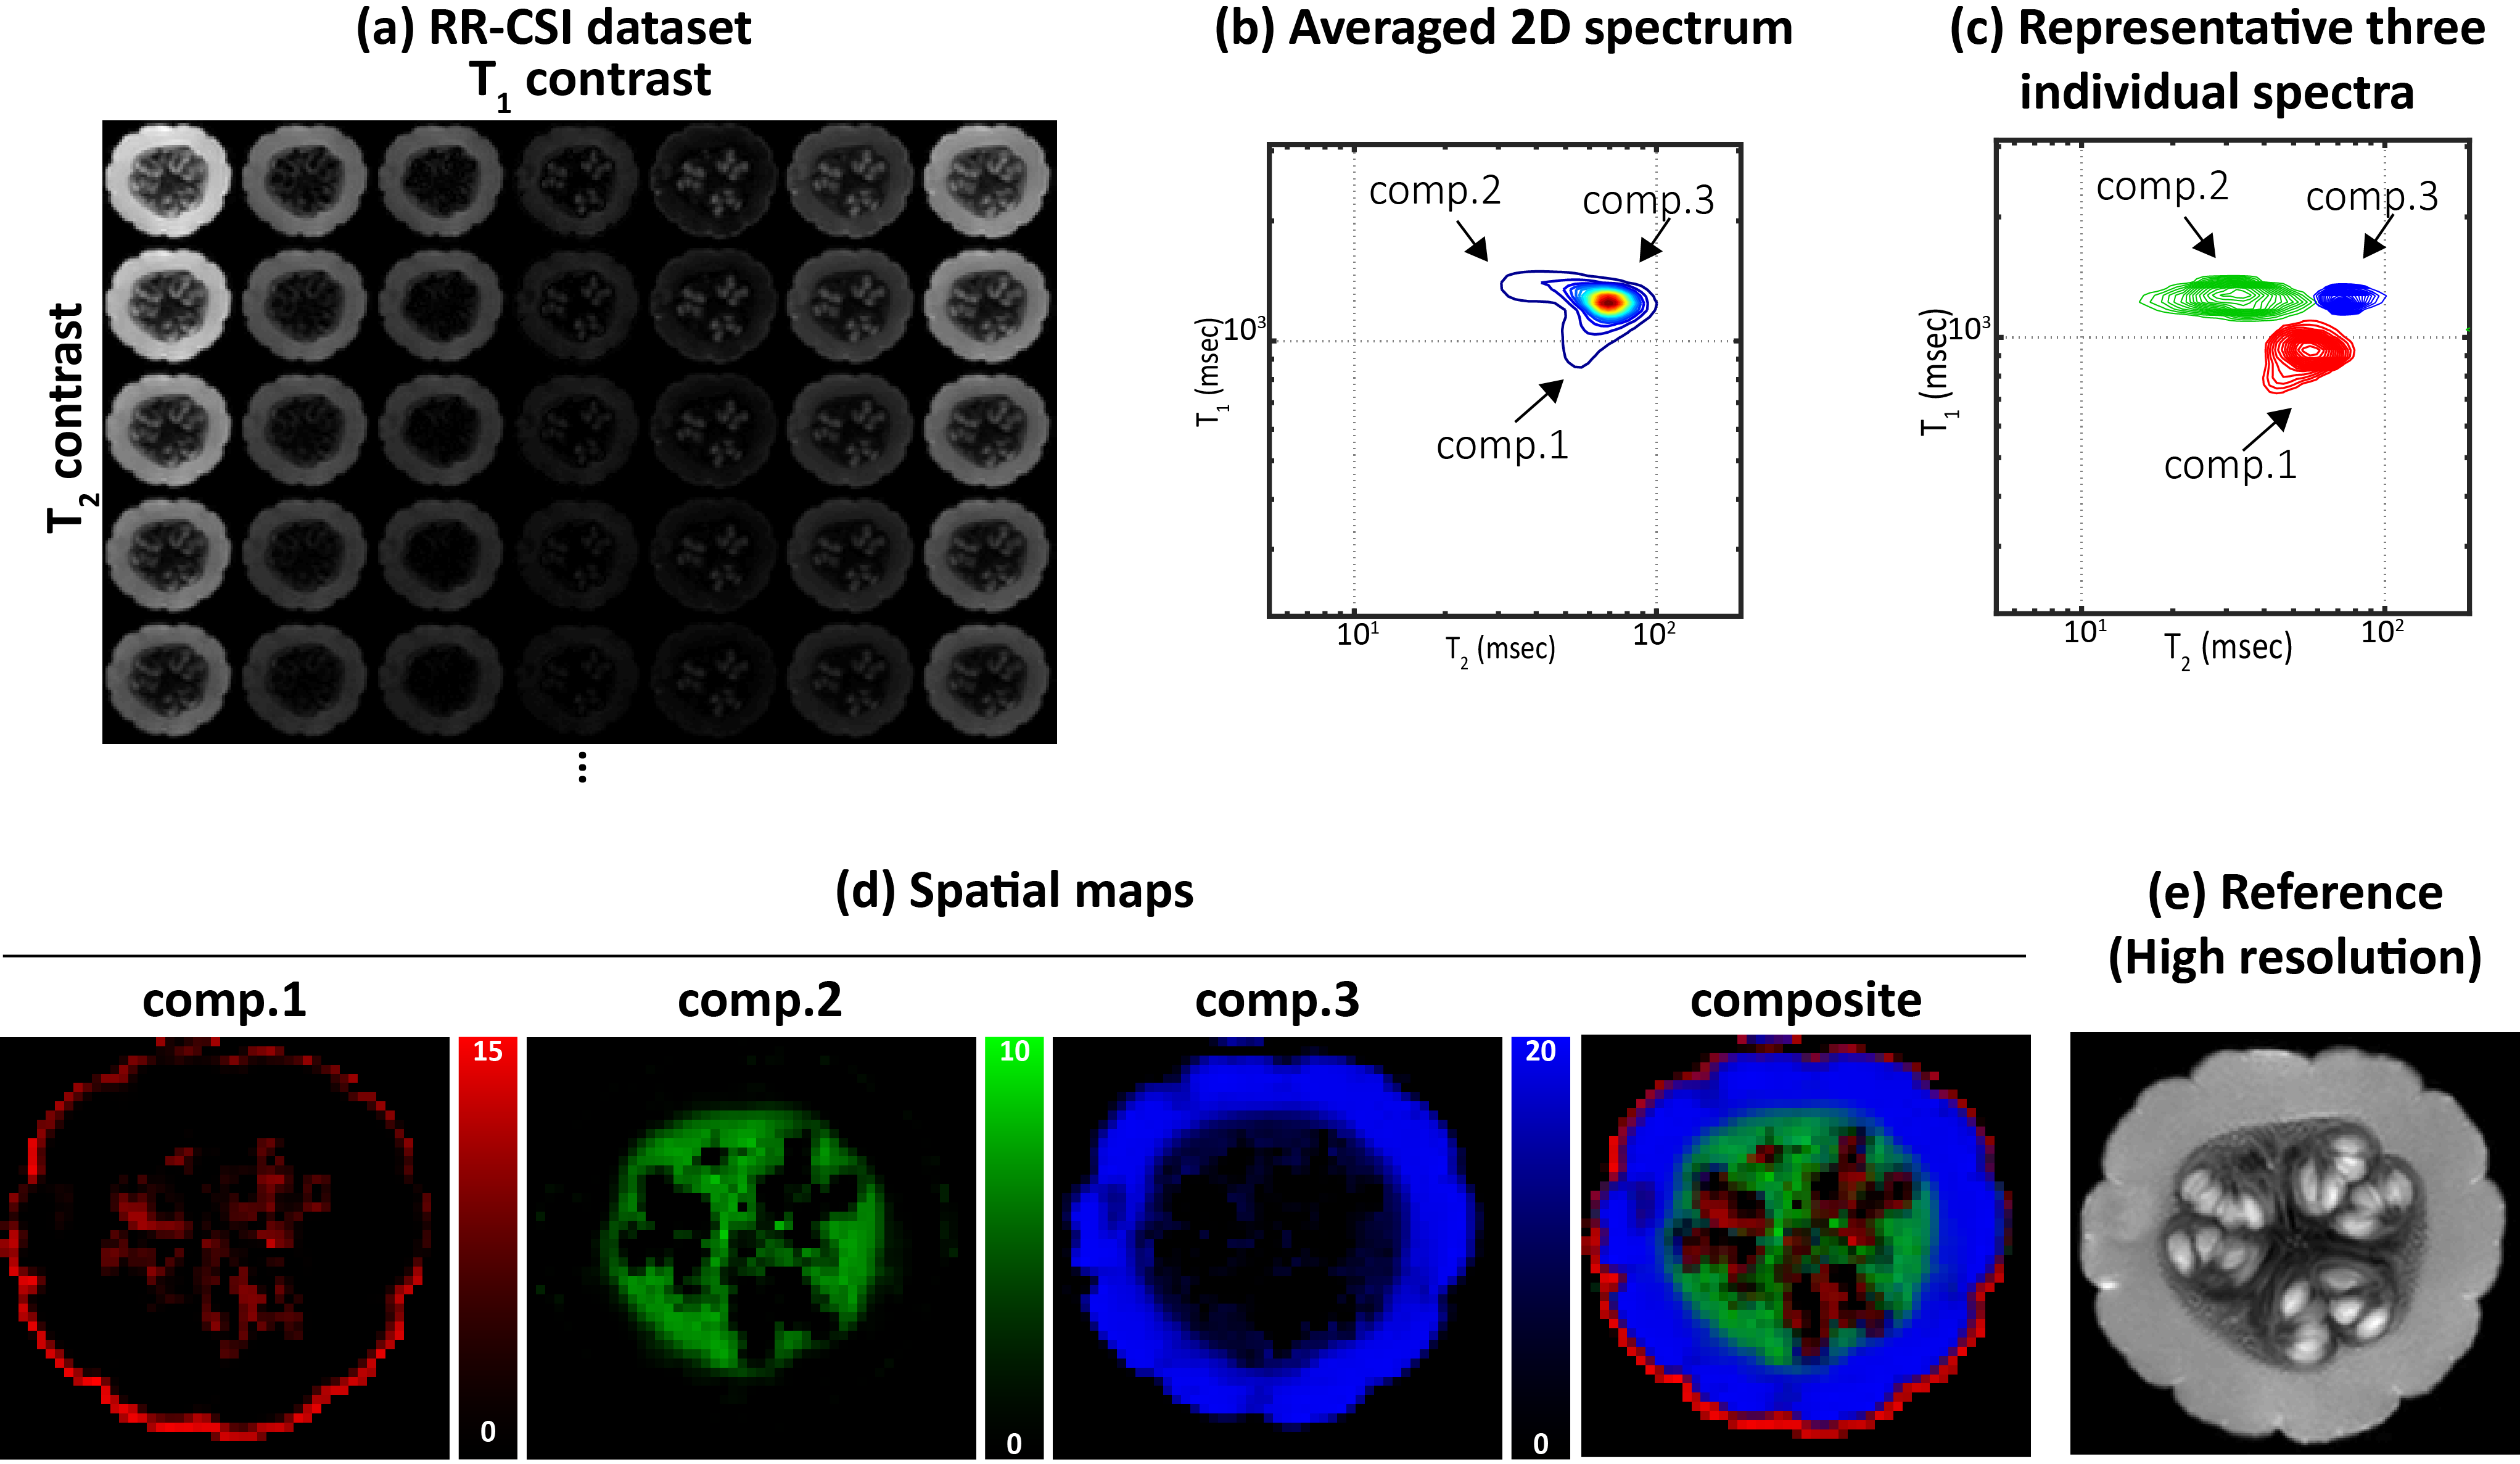
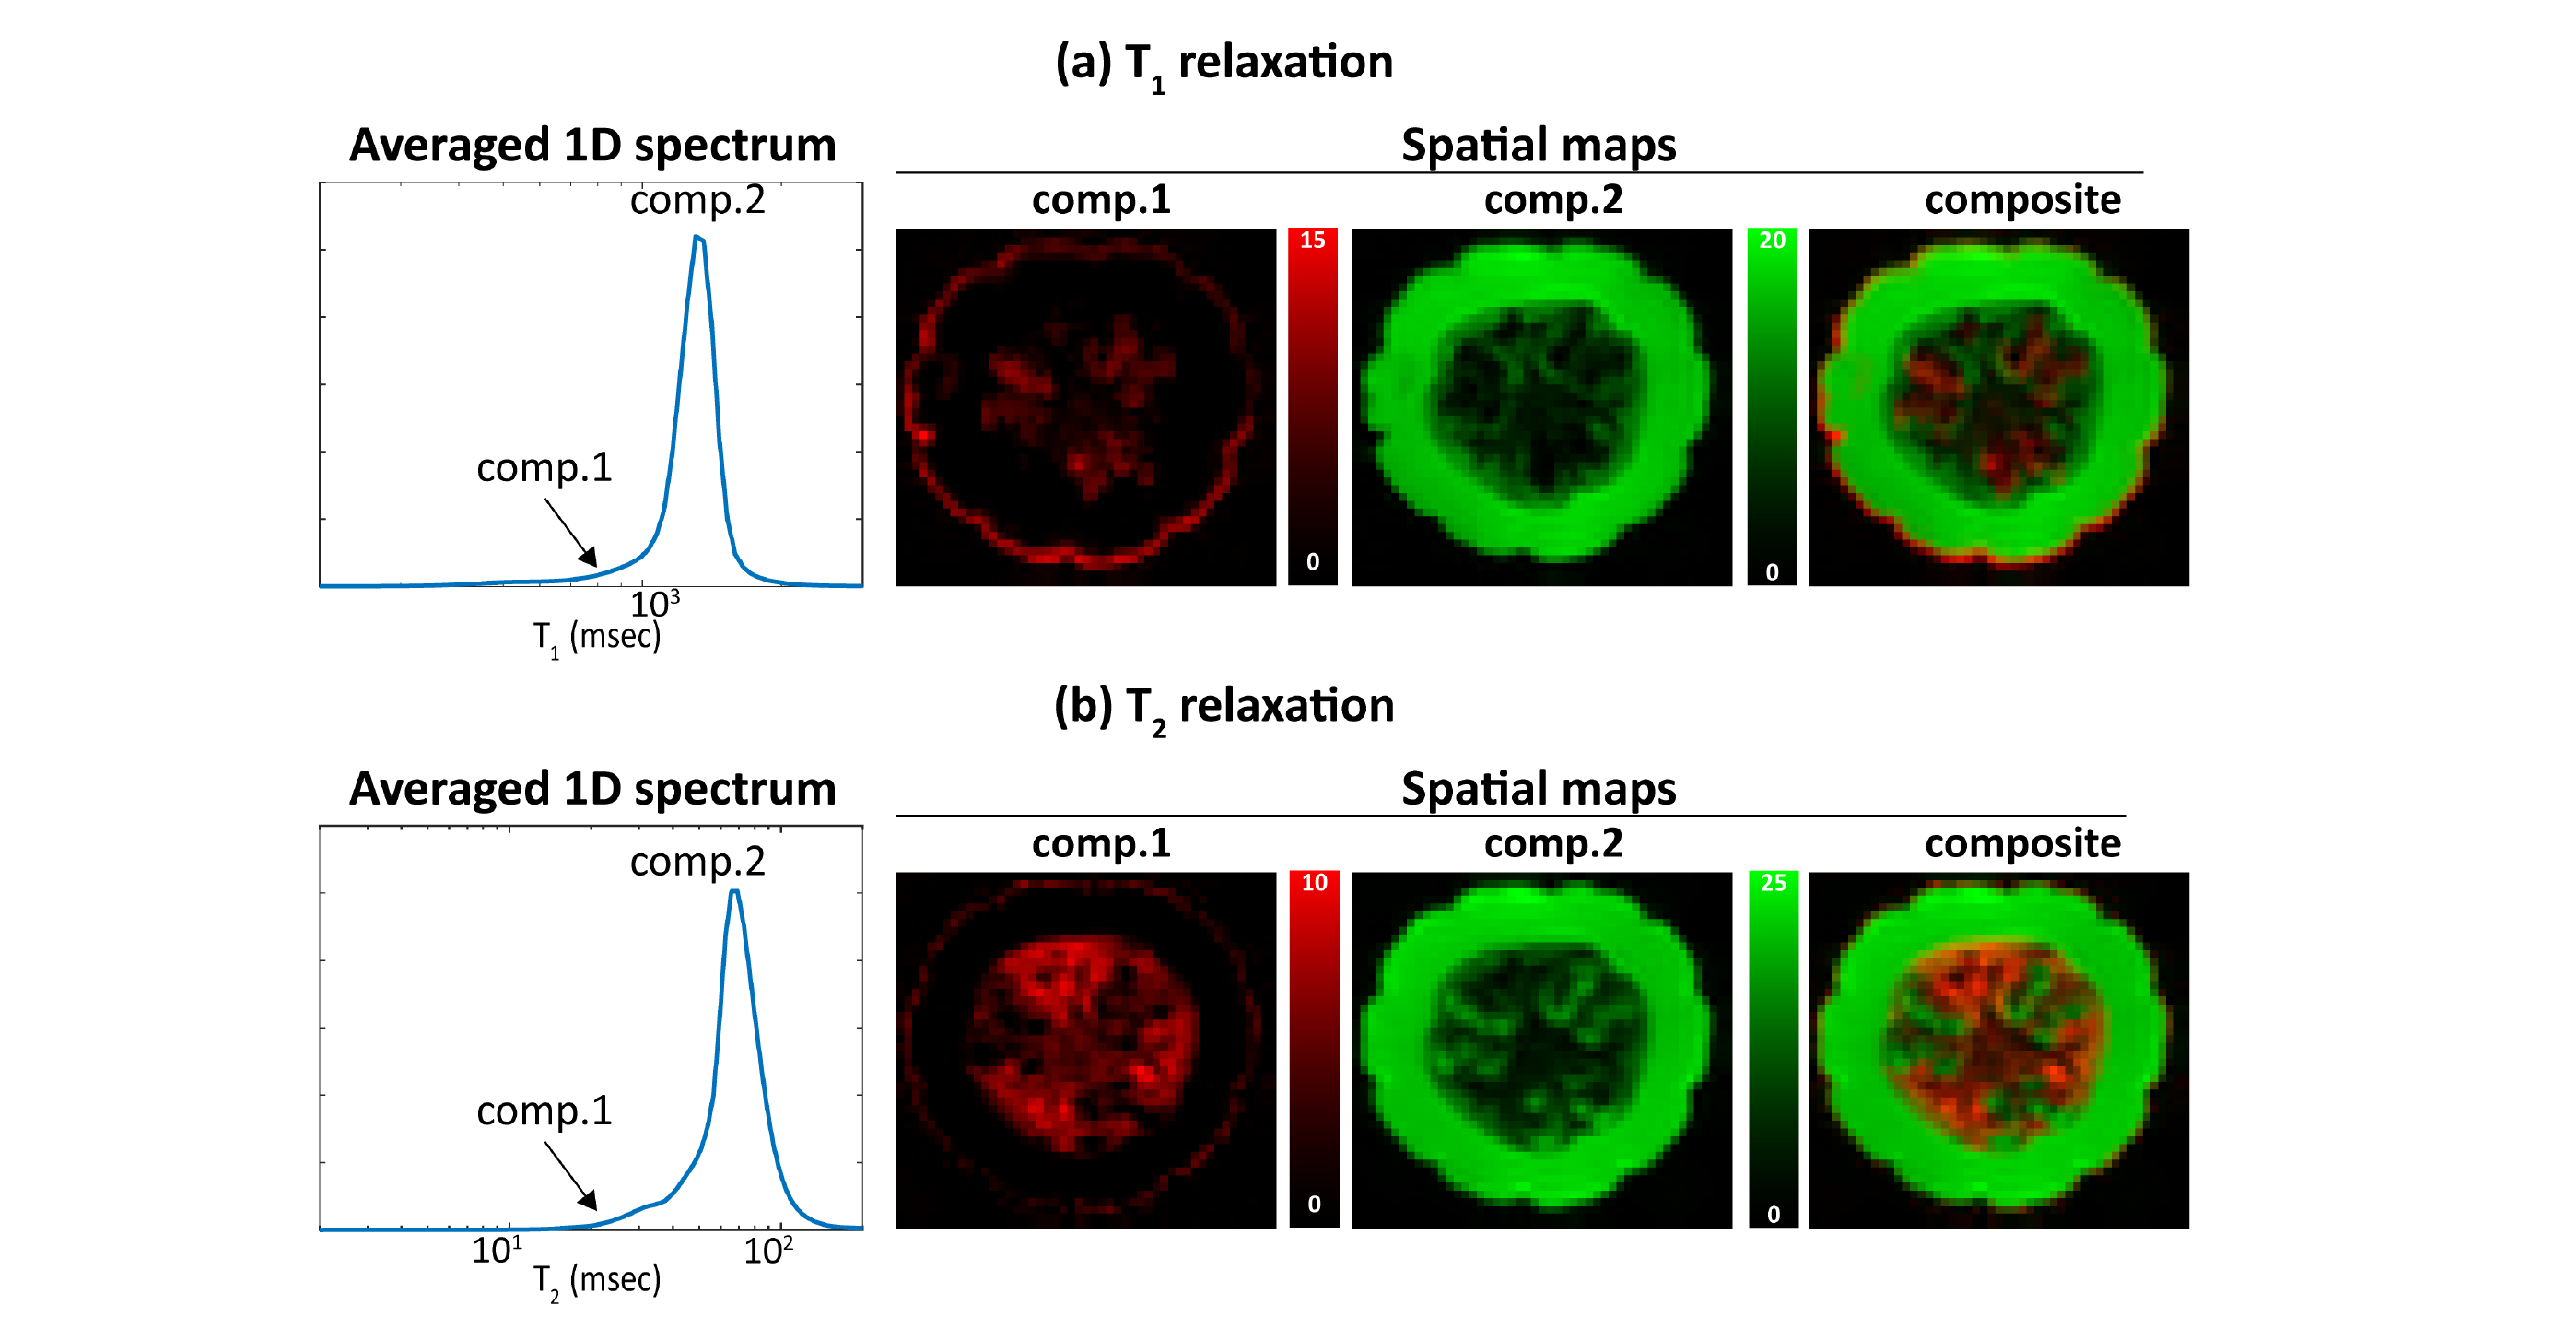
Fig.1 shows the RR-CSI results from the pumpkin. As shown in (b), (c), we observe three spectral peaks in the spectroscopic image. Spatial maps obtained by integrating these three peaks are shown in (d), revealing three different compartments of the pumpkin. These compartments are consistent with the high-resolution features of the reference image in (e). Fig.2 shows the comparison of RR-CSI against conventional 1D methods. The integrated spectra from the 1D methods only show two peaks instead of three, and spatial maps of these peaks demonstrate limited compartmental resolving power capabilities compared to our method.
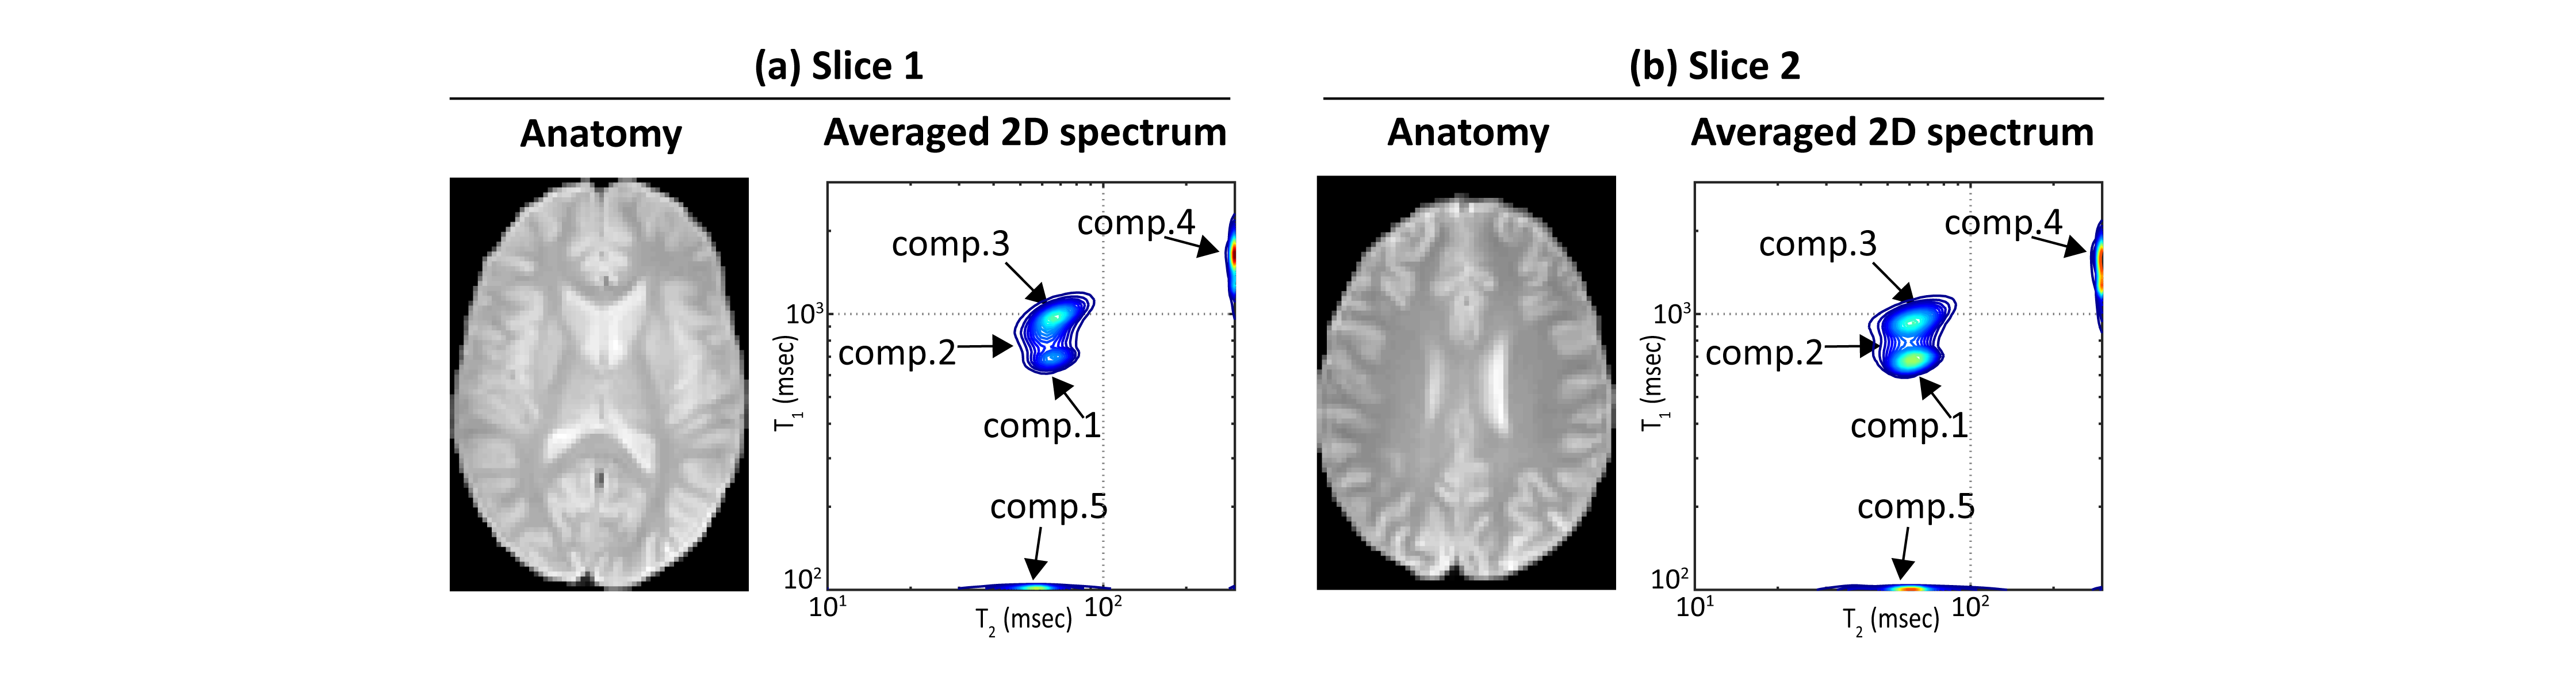
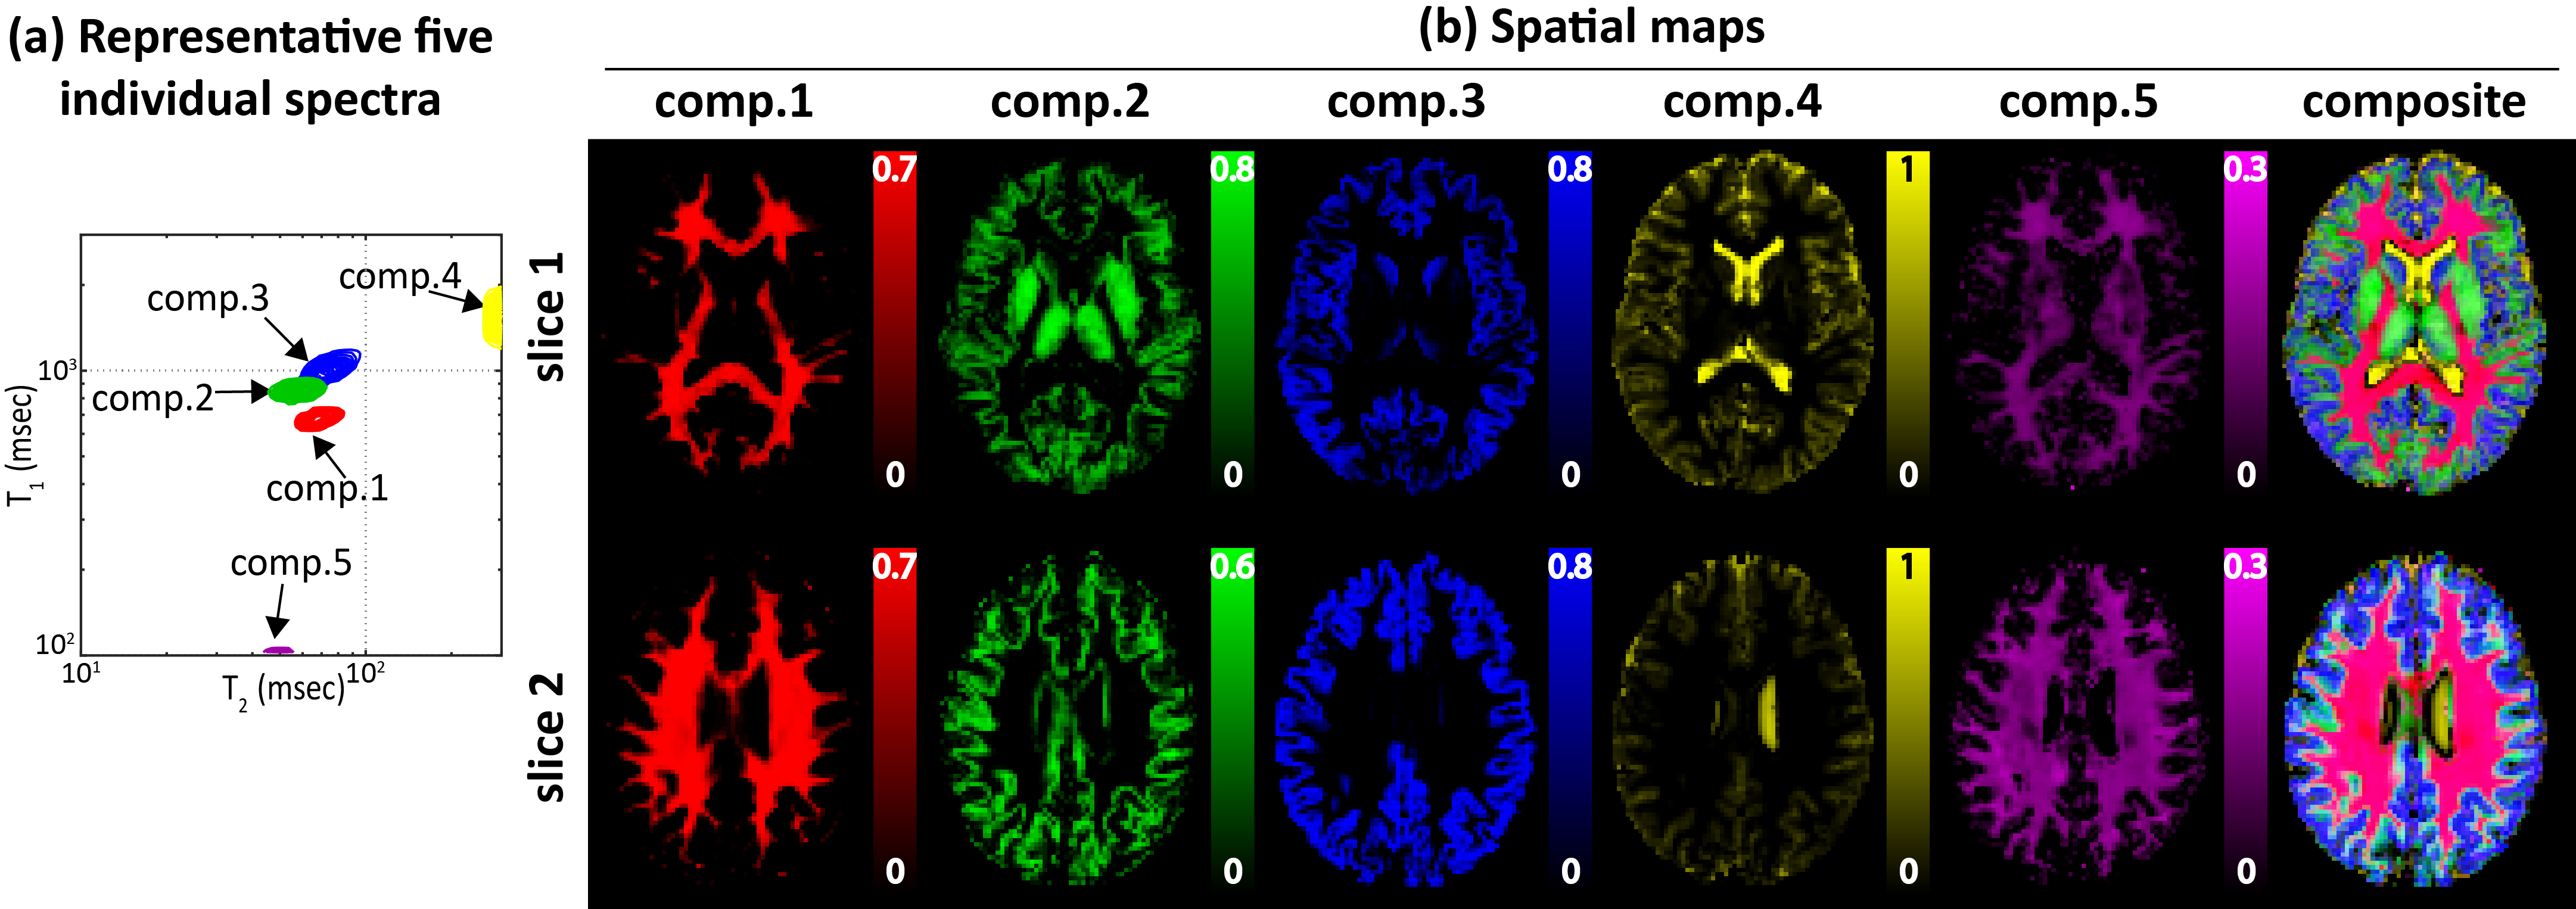
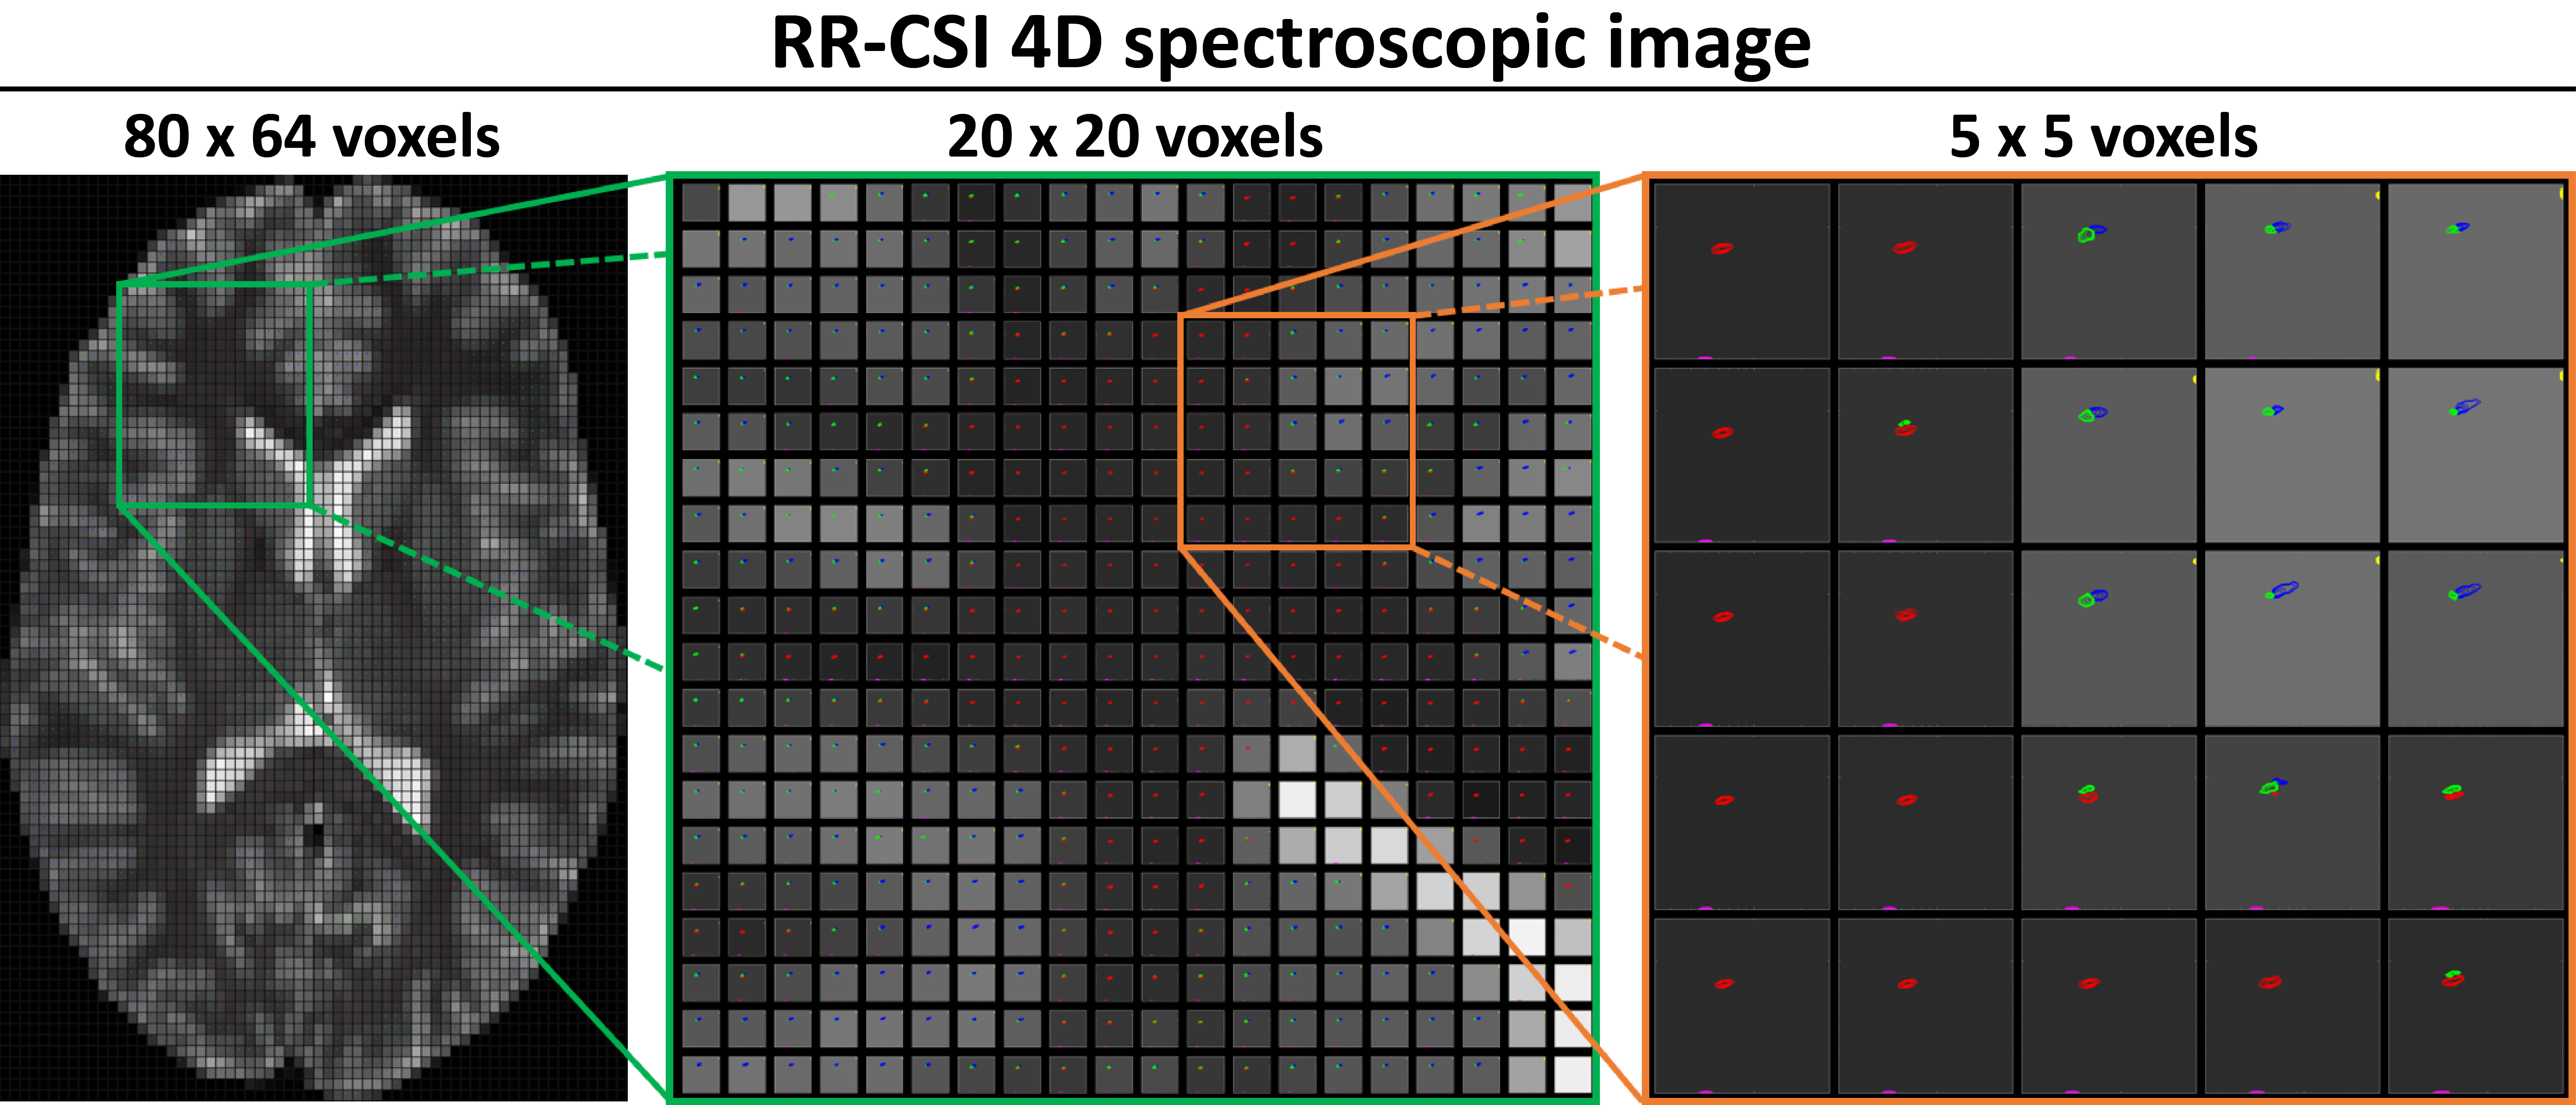
Fig.3 shows the spatially-averaged RR-CSI spectra from the brain, where five peaks are resolved. Fig.4 shows that the spatial maps of the five peaks closely match with the known anatomy of the brain. Specifically, the first four components seem to correspond to a part of white matter (WM), a mixture of WM and gray matter (GM), GM, and cerebrospinal fluid (CSF), respectively. Component 5 resembles the myelin water component indicated in previous literature1. However, the relaxation characteristics of the CSF-like and myelin water-like components do not match with the literature values, although we do not expect accurate estimation of short T1 or long T2 species based on our limited range of contrast encodings. Nonetheless, we can clearly separate out realistic anatomical structures better than conventional 1D methods. Fig.5 shows the spectroscopic image, further demonstrating the ability to identify multiple compartments within a single voxel.
We believe that our experiments acquired more data than necessary to achieve these results, and that the experiment can be substantially accelerated by optimizing the experiment design11.
Conclusion
We proposed a novel approach to imaging microstructure and demonstrated its potential with in vivo human brain data. Our results strongly support that RR-CSI has improved capabilities for separating sub-voxel microstructural tissue compartments.Acknowledgements
This work was supported in part by the USC Alfred E. Mann Institute and research grants NSF award CCF-1350563 and NIH grants R21-EB022951, R01-NS074980, and R01-NS089212.References
1. MacKay A, Whittal K, Adler J, Li D, Paty D and Graeb D. In vivo visualization of myelin water in brain by magnetic resonance. Magn. Reson. Med. 1994; 31:673-677.
2. Labadie C, Lee J-H, Vetek G, and Springer CS. Relaxographic imaging. J. Magn. Reson. 1994; 2:99-112.
3. Whittall KP, MacKay AL, Graeb DA, Nugent RA, Li DKB and Paty DW. In vivo measurement of T2 distributions and water contents in normal human brain. Magn. Reson. Med. 1997; 37:34-43.
4. Song Y, Venkataramanan L, Hürlimann M, Flaum M, Frulla P and Straley C. T1-T2 correlation spectra obtained using a fast two-dimensional Laplace inversion. J. Magn. Reson. 2002; 154:261-258.
5. Does MD and Gore JC. Compartmental study of T1 and T2 in rat brain and trigeminal nerve in vivo. Magn. Reson. Med. 2002; 47:274-283.
6. Galvosas P and Callaghan PT. Multi-dimensional inverse Laplace spectroscopy in the NMR of porous media. C. R. Physique 2010; 11:172-180.
7. Bai R and Cloninger A, Czaja W and Basser PJ. Efficient 2D MRI relaxometry using compressed sensing. J. Magn. Reson. 2015; 255:88-99.
8. Benjamini D and Basser PJ. Use of marginal distributions constrained optimization (MADCO) for accelerated 2D MRI relaxometry and diffusometry. J. Magn. Reson. 2016; 271:40-45.
9. Kim D, Doyle EK, Wisnowski JL, Kim JH and Haldar JP. Diffusion-relaxation correlation spectroscopic imaging: A multidimensional approach for probing microstructure. Magn. Reson. Med. 2017; early view.
10. Kim D, Wisnowski JL, Haldar JP. MR correlation spectroscopic imaging of multidimensional exponential decays: probing microstructure with diffusion and relaxation. In: Proc. SPIE Wavelets and Sparsity XVII, 2017; p.103940D.
11. Kim D, Haldar JP. Faster diffusion-relaxation correlation spectroscopic imaging (DR-CSI) using optimized experiment design. In: Proc. Int. Soc. Magn. Reson. Med. 2017; p.176.
Figures