0782
PET-MR multiparametric imaging biomarkers for differentiating between progression and radionecrosis of brain tumors1Neuroradiology, Pitié Salpêtrière Hospital, APHP, Paris, France, 2UMR S 1127, CNRS UMR 7225, ICM, UPMC Univ Paris 06, Paris, France, 3Centre de NeuroImagerie de Recherche – CENIR, ICM, Paris, France, 4Nuclear Medecine, Pitié Salpêtrière Hospital, APHP, Paris, France
Synopsis
The aim of this work was evaluating the diagnostic accuracy of PET-MRI in difficult cases of differentiating between tumor progression and radionecrosis in neuro-oncology. For each lesion, PET (SUVmax, SUV mean, SUVpeak) and MRI (ADC, CBV, CBF, pCASL CBF) biomarkers were extracted. The combination of PET and MRI biomarkers allowed to improve the diagnostic accuracy. The logistic regression model has shown that 94% cases were correctly classified using the combination of SUVpeak and pCASL rCBF. Excellent diagnostic accuracy was achieved for both qualitative and quantitative evaluation by means of combined analysis of morphological, functional and metabolic imaging markers.
INTRODUCTION
Close follow-up under treatment of patients presenting with high-grade glioma is essential for early detection of the tumor progression. The magnetic resonance imaging (MRI) is the modality of choice in daily routine for such follow up. However, standard anatomical MRI may not be always reliable after radiation or chemotherapy1-2, which induce necrosis and increase the incidence of non-specific treatment- induced signal changes caused by inflammation, edema, ischemia, or specific treatment-related effects such as anti-angiogenic or immune therapy. In radiotherapy-treated glioma patients, the specificity of standard MRI may be as low as 50% for detecting the recurrent disease3. Various advanced MRI techniques4, as well as positron emission tomography (PET)5-6, were proposed for improving the diagnostic accuracy, which still remains moderate and variable across studies. The hybrid imaging PET-MRI brain allows, combined and optimal studying, in a single examination session, the metabolic profile in PET, the anatomical extension, the perfusion and the tumor cellularity7-9. Our objective was evaluating the diagnostic accuracy of PET-MRI in difficult cases of differentiating between tumor progression and radionecrosis in neuro-oncology.METHODS
Subjects: Between December 2015 and September 2017, patients followed for primary malignant brain tumors underwent FDOPA PET-MRI in order to differentiate between tumor progression and radio-necrosis.
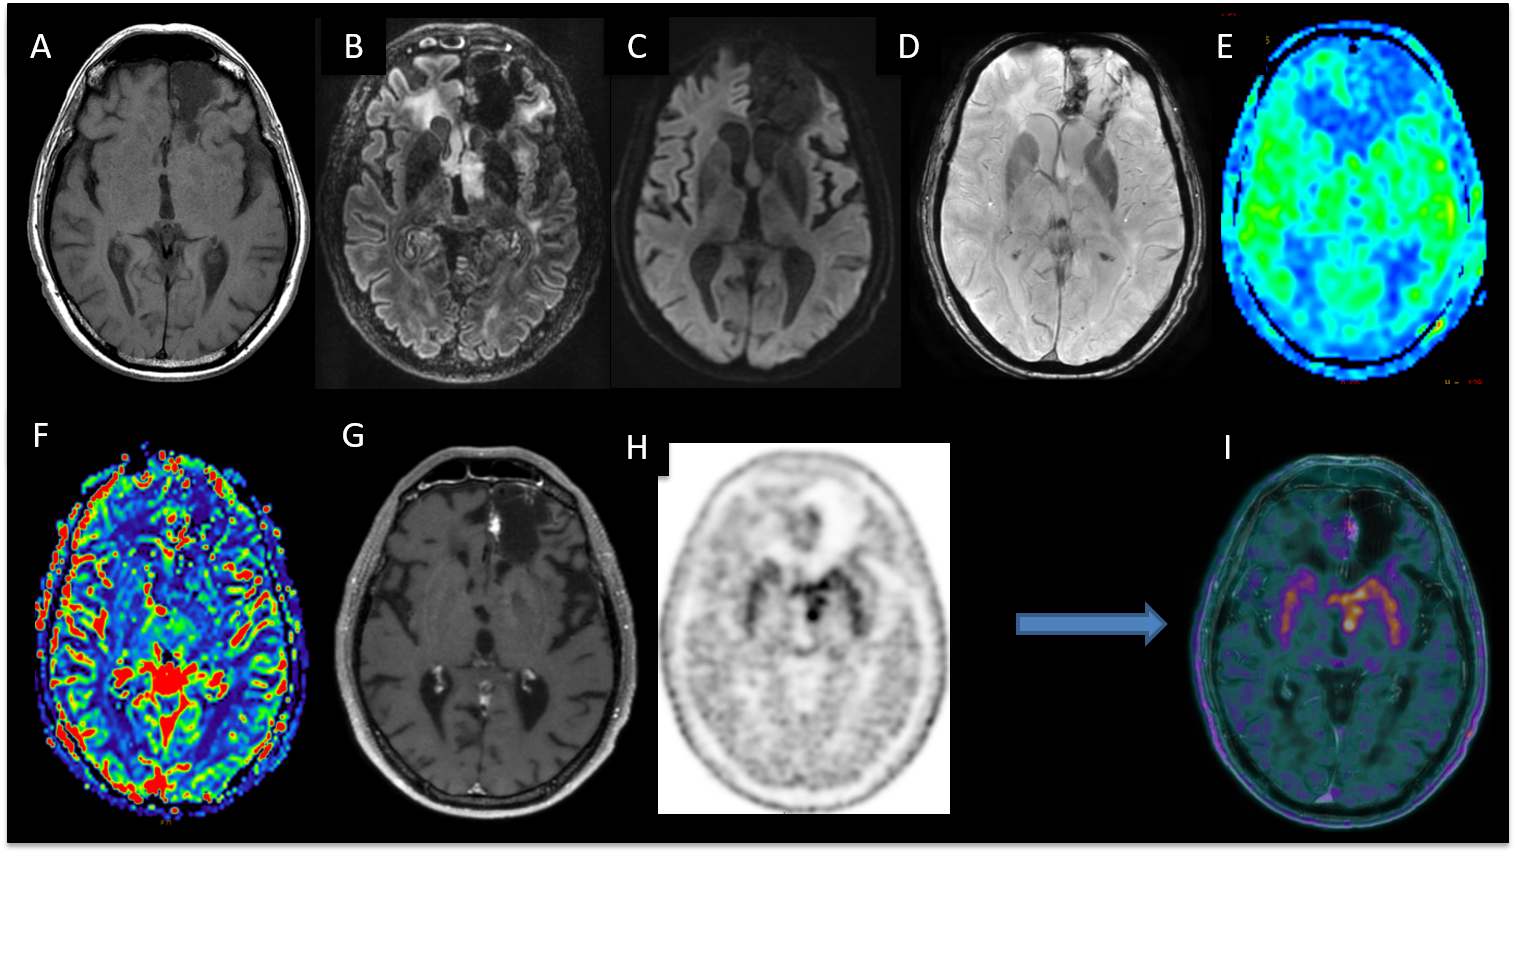
MRI data acquisition: The acquisition was performed with a PET-MR system (SIGNA, GE Healthcare, Milwaukee, USA) 10 min after the injection of 2 MBq/kg of FDOPA. The MRI acquisition included Spin-echo (SE) 3D T1-weighted (T1-w) images without contrast and after injection of 0.2 ml/kg of Gadolinium (Gd)-DOTA (0.5 M Dotarem, Guerbet, Roissy, France), 3D FLAIR imaging, susceptibility-weighted angiography (SWAN), diffusion-weighted imaging (DWI) and pseudo-continuous arterial spin labeling (pCASL) and dynamic susceptibility-contrast (DSC) perfusion. Scanning time included a 20 min single-bed-position PET emission scan (Figure 1). PET images were reconstructed with an OSEM algorithm, integrating TOF, PSF modeling, and attenuation and scatter correction with 8 iterations and 28 subsets, a FOV of 300 x 300 mm2, and a voxel size of 1.17x1.17x2.78mm3.
Image analysis: All the measurements were performed using a GE AW workstation (GE Healthcare, Milwaukee, USA). The relative cerebral blood volume (rCBV) and relative cerebral blood flow (rCBF) maps were calculated for DSC perfusion and CBF maps for pCASL perfusion, using the READY view post-processing tool. The SUVmax, SUVmean, and SUVpeak were measured in each lesion within the volume of interest (VOI). A region of interest was drawn in each lesion and the mean relative apparent diffusion coefficient (ADC), rCBV, and rCBF for both DSC and pCASL perfusion were calculated. In addition, visual analysis was performed by a neuroradiologist for MR images and by a nuclear medicine physician for PET images. Then both experts rated the whole PET-MR examination. The results were compared with the gold standard, which comprises histological results or follow-up at more than 3 months.
Statistical analysis: The diagnostic threshold value was calculated using receiver operating characteristic (ROC) curve analysis, and the sensitivity and specificity of the cut-off points were estimated using the Youden index. The sensitivity, specificity, and diagnostic accuracy were calculated for all the variables. The best combination of variables for diagnostic prediction was determined using a logistic regression model.
RESULTS
Forty-four patients (mean age 55.7±13.8 years) were analyzed.
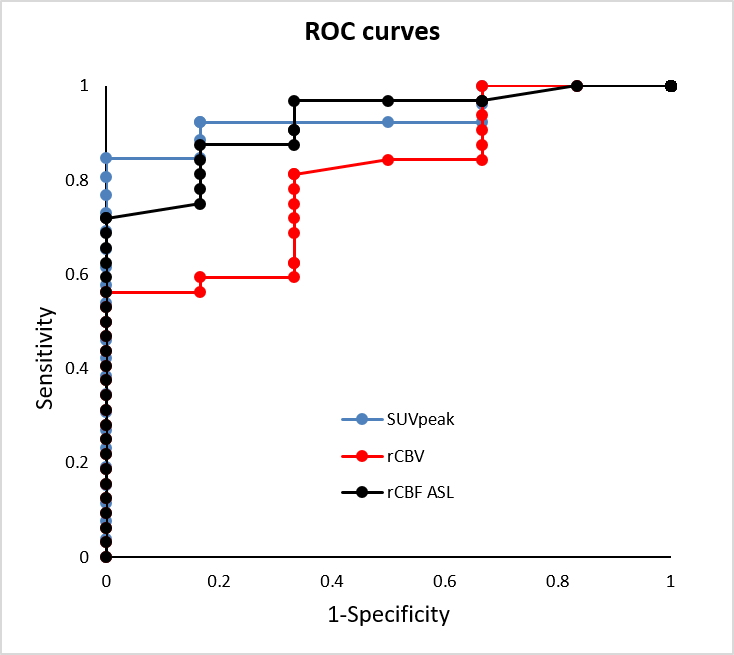
ROC analysis showed good discrimination between progression and radio-necrosis with high diagnostic accuracy for SUVmax (0.82), for SUVpeak (0.9), and for ASL rCBF (0.86). The accuracy was lower for rADC (0.63) and rCBV (0.75) (Figure 2).
A logistic regression model was utilized to determine the best variable combinations, optimizing the disease prediction. The logistic regression model was statistically significant (p<0.0001), correctly classifying 94% of the cases. Among predictor variables, the combination of the SUVpeak and pCASL rCBF variables improved sensitivity (0.94), specificity (0.83) and the AUC (0.97, 95% CI=[0.93,0.99]).
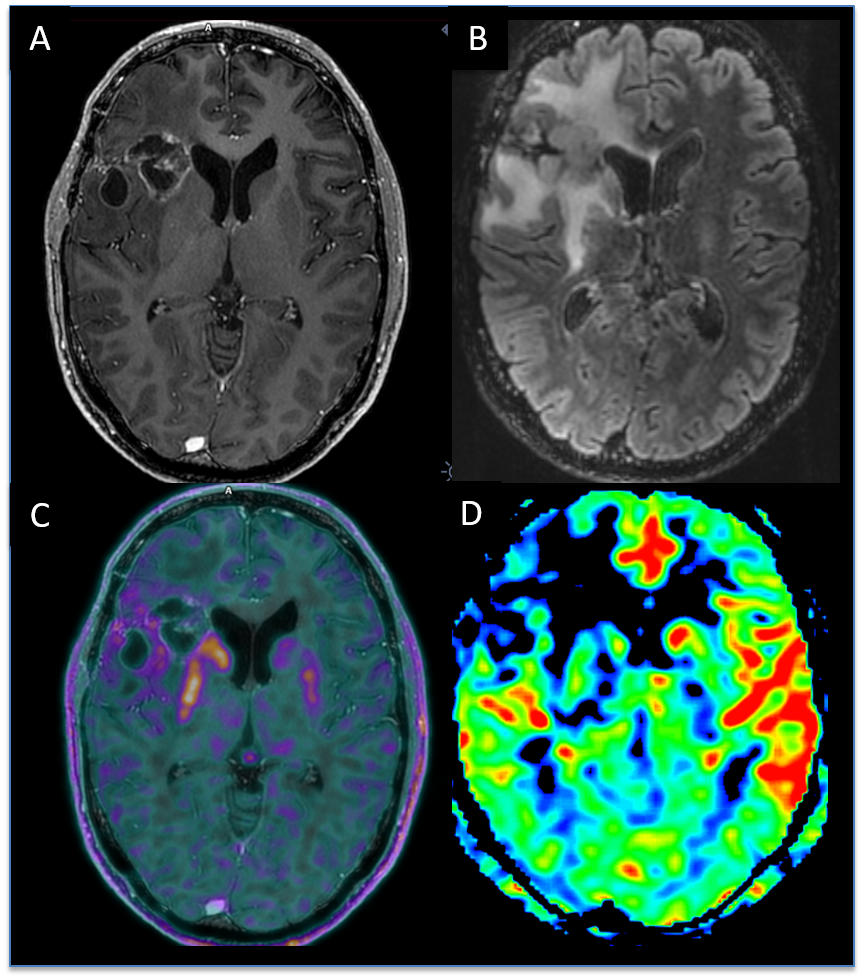
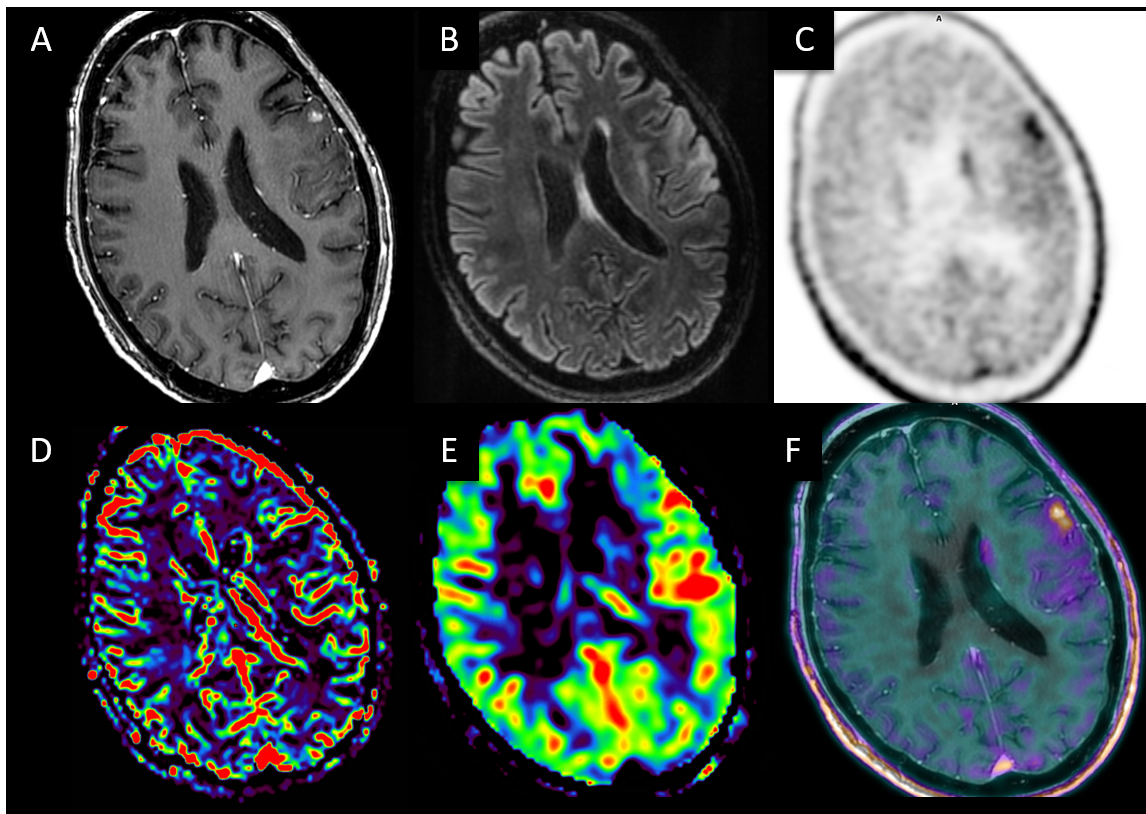
Visual analysis (Figure 3,4) gave the diagnostic accuracy of 0.77 for PET reading only, of 0.89 for PET reading with morphological MRI, and of 0.98 for PET-MRI combined reading using all the available MRI sequences.
DISCUSSION
We have observed an increase of the diagnostic accuracy in combined analysis of PET and MRI biomarkers? for both qualitative and qualitative ones. The logistic regression has shown that SUVpeak and pCASL rCBF, being the most significant, provided excellent diagnostic accuracy. The combined analysis of morphological, functional and metabolic imaging markers in this context is optimal, considering their simultaneous acquisitions, overcoming the problems of spatial coregistration, and possible temporal variations.CONCLUSION
Combined PET-MR imaging allows to increase the diagnostic accuracy for differentiating between tumor progression and radionecrosis in neuro-oncology.Acknowledgements
No acknowledgement found.References
1. Mullins ME, Barest GD, Schaefer PW, Hochberg FH, Gonzalez RG, Lev MH. Radiation necrosis versus glioma recurrence: conventional MR imaging clues to diagnosis. AJNR Am J Neuroradiol. 2005; 26(8):1967–72. 3.
2. Kumar AJ, Leeds NE, Fuller GN, Van Tassel P, Maor MH, Sawaya RE, et al. Malignant gliomas: MR imaging spectrum of radiation therapy- and chemotherapy-induced necrosis of the brain after treatment. Radiology 2000 ; 217(2):377–84.
3. Rachinger W, Goetz C, Popperl G, Gildehaus FJ, Kreth FW, Holtmannspotter M et al Positron emission tomography with O-(2-[18F]fluoroethyl)-L-tyrosine versus magnetic resonance imaging in the diagnosis of recurrent gliomas. Neurosurgery 2005; 57:505–511
4. Ellingson BM, Bendszus M, Sorensen AG, Pope WB Emerging techniques and technologies in brain tumor imaging. Neuro Oncol 2014; 16(Suppl 7):vii12–vii23
5. Galldiks N, Langen KJ, Pope WB From the clinician’s point of view: what is the status quo of positron emission tomography in patients with brain tumors? Neuro Oncol 2015; 17:1434–1444
6. Albert NL, Weller M, Suchorska B, Galldiks N, Soffietti R, Kim MM et al. Response Assessment in Neuro-Oncology working group and European Association for Neuro-Oncology recommendations for the clinical use of PET imaging in gliomas. Neuro Oncol. 2016
7. Fink JR, Muzi M, Peck M, Krohn KA Multimodality brain tumor imaging: MR imaging, PET, and PET/MR imaging. J Nucl Med. 2015; 56:1554–1561
8. Catana C, Drzezga A, Heiss WD, Rosen BR (2012) PET/MRI for neurologic applications. J Nucl Med 53:1916–1925
9. Werner P, Barthel H, Drzezga A, Sabri O Current status and future role of brain PET/MRI in clinical and research settings. Eur J Nucl Med Mol Imaging 2015; 42:512–526
Figures